Université de Montréal
Searching for novel gene functions in yeast: Identification
of thousands of novel molecular interactions by
protein-fragment complementation assay followed by automated
gene function prediction and high-throughput lipidomics
par Kirill Tarasov Département de biochimie Programme de Biochimie Faculté de médecine Université de Montréal
Thèse présentée à la faculté des études supérieures en vue de l'obtention du grade Philosophiae Doctor (Ph.D)
en biochimie
September, 2014
Université de Montréal Faculté des études supérieures
Cette thèse s'intitule:
Searching for novel gene functions in yeast: Identification
of thousands of novel molecular interactions by
protein-fragment complementation assay followed by automated
gene function prediction and high-throughput lipidomics
Présentée par:
Kirill Tarasov
a été évaluée par un jury composé des personnes suivantes:
Martine Raymond Président-rapporteur
Muriel Aubry Membre du jury (en remplacement du directeur de recherche)
François Major Membre du jury Vladimir Titorenko Examinateur externe
Résumé
La compréhension de processus biologiques complexes requiert des approches expérimentales et informatiques sophistiquées. Les récents progrès dans le domaine des stratégies génomiques fonctionnelles mettent dorénavant à notre disposition de puissants outils de collecte de données sur l’interconnectivité des gènes, des protéines et des petites molécules, dans le but d’étudier les principes organisationnels de leurs réseaux cellulaires. L’intégration de ces connaissances au sein d’un cadre de référence en biologie systémique permettrait la prédiction de nouvelles fonctions de gènes qui demeurent non caractérisées à ce jour. Afin de réaliser de telles prédictions à l’échelle génomique chez la levure Saccharomyces cerevisiae, nous avons développé une stratégie innovatrice qui combine le criblage interactomique à haut débit des interactions protéines-protéines, la prédiction de la fonction des gènes in silico ainsi que la validation de ces prédictions avec la lipidomique à haut débit. D’abord, nous avons exécuté un dépistage à grande échelle des interactions protéines-protéines à l’aide de la complémentation de fragments protéiques. Cette méthode a permis de déceler des interactions in vivo entre les protéines exprimées par leurs promoteurs naturels. De plus, aucun biais lié aux interactions des membranes n’a pu être mis en évidence avec cette méthode, comparativement aux autres techniques existantes qui décèlent les interactions protéines-protéines. Conséquemment, nous avons découvert plusieurs nouvelles interactions et nous avons augmenté la couverture d’un interactome d’homéostasie lipidique dont la compréhension demeure encore incomplète à ce jour. Par la suite, nous avons appliqué un algorithme d’apprentissage afin d’identifier huit gènes non caractérisés ayant un rôle potentiel dans le métabolisme des lipides. Finalement, nous avons
étudié si ces gènes et un groupe de régulateurs transcriptionnels distincts, non préalablement impliqués avec les lipides, avaient un rôle dans l’homéostasie des lipides. Dans ce but, nous avons analysé les lipidomes des délétions mutantes de gènes sélectionnés. Afin d’examiner une grande quantité de souches, nous avons développé une plateforme à haut débit pour le criblage lipidomique à contenu élevé des bibliothèques de levures mutantes. Cette plateforme consiste en la spectrométrie de masse à haute resolution Orbitrap et en un cadre de traitement des données dédié et supportant le phénotypage des lipides de centaines de mutations de Saccharomyces cerevisiae. Les méthodes expérimentales en lipidomiques ont confirmé les prédictions fonctionnelles en démontrant certaines différences au sein des phénotypes métaboliques lipidiques des délétions mutantes ayant une absence des gènes YBR141C et YJR015W, connus pour leur implication dans le métabolisme des lipides. Une altération du phénotype lipidique a également été observé pour une délétion mutante du facteur de transcription KAR4 qui n’avait pas été auparavant lié au métabolisme lipidique. Tous ces résultats démontrent qu’un processus qui intègre l’acquisition de nouvelles interactions moléculaires, la prédiction informatique des fonctions des gènes et une plateforme lipidomique innovatrice à haut débit , constitue un ajout important aux méthodologies existantes en biologie systémique. Les développements en méthodologies génomiques fonctionnelles et en technologies lipidomiques fournissent donc de nouveaux moyens pour étudier les réseaux biologiques des eucaryotes supérieurs, incluant les mammifères. Par conséquent, le stratégie présenté ici détient un potentiel d’application au sein d’organismes plus complexes.
Mots-clés: Interaction protéine-protéine, complémentation de fragments protéiques, protéine membranaire, métabolisme des lipides high-throughput screen, lipidomics, apprentissage automatique, prédiction de la fonction d’un gene, visualisation analytique, criblage à haut débit
Abstract
Understanding complex biological processes requires sophisticated experimental and computational approaches. The advances in functional genomics strategies provide powerful tools for collecting diverse types of information on interconnectivity of genes, proteins and small molecules for studying organizational principles of cellular networks. Integration of that knowledge into a systems biology framework enables prediction of novel functions of uncharacterized genes. For performing such predictions on a genome-wide scale in the yeast
Saccharomyces cerevisiae, we have developed a novel strategy that combines high-throughput interactomics screen for protein-protein interactions, in silico gene function prediction, and validation of predictions with high-throughput lipidomics. We started by performing a large-scale screen for protein-protein interactions using a protein-fragment complementation assay. The method allowed to monitor interactions in vivo between proteins expressed from their natural promoters. Furthermore, the method did not suffer from bias against membrane interactions comparing to established genome-wide techniques for detecting protein interactions. As a result, we detected many novel interactions and increased coverage of an interactome of lipid homeostasis that has not been yet comprehensively explored. Next, we applied a machine learning algorithm to identify eight previously uncharacterized genes with a potential role in lipid metabolism. Finally, we investigated whether these genes and a set of distinct transcriptional regulators, not implicated previously with lipids, have a role in lipid homeostasis. For that purpose, we analyzed lipidome of deletion mutants of the selected genes. In order to probe a large number of strains, we have developed a high-throughput platform for
high-content lipidomic screening of yeast mutant libraries that consists of high-resolution Orbitrap mass spectrometry and a dedicated data processing framework to support lipid phenotyping across hundreds of Saccharomyces cerevisiae mutants. Lipidomics experiments confirmed functional predictions by demonstrating differences of the lipid metabolic phenotypes of deletion mutants lacking YBR141C and YJR015W genes predicted to be involved in lipid metabolism. An altered lipid phenotype was also observed for a deletion mutant of the transcription factor KAR4 that has not been linked previously with lipid metabolism. These results demonstrate that a workflow that integrates the acquisition of novel molecular interactions, computational gene function prediction and novel high-throughput shotgun lipidomics platform is a valuable contribution to an arsenal of methods for systems biology. The developments of functional genomic methods and lipidomics technologies provide means to study biological networks of higher eukaryotes, including mammals. Therefore, the presented workflow has a potential to find its applications in more complex organisms.
Keywords: Protein-protein interactions, protein-fragment complementation assays, high-throughput screen, membrane proteins, lipid metabolism, lipidomics, machine learning, gene function prediction, visual analytics.
Table of contents
Résumé ... iii
Abstract ... v
Table of contents ... vii
List of Figures ... xv
Dedication ... xvii
Acknowledgements ... xviii
Abbreviations ... xix
Chapter 1 : Introduction ... 1
1.1. Yeast as a model system ... 2
1.2. Genetic manipulation of yeast ... 3
1.3. Functional genomics studies in yeast ... 6
1.3.1. Gene expression and protein abundance ... 6
1.3.2. Collection of single gene deletion mutants ... 8
1.3.3. Protein localization studies ... 9
1.3.4. Studies of molecular interactions ... 10
1.4. Strategies for mapping protein-protein interaction networks ... 12
1.4.1. Yeast two-hybrid ... 12
1.4.2. Tandem affinity purification coupled to mass spectrometry ... 14
1.4.3. Protein-fragment complementation assays ... 15
1.4.4. Large-scale studies of protein-protein interactions in yeast ... 17
1.5.1. Metabolomics ... 18
1.5.2. Lipidomics ... 22
1.6. Informatics and mathematics concepts related to yeast functional genomics studies ... 25
1.6.1. Hypothesis testing and statistical significance ... 25
1.6.2. Correlation methods ... 28
1.6.3. Clustering analyses ... 29
1.6.4. Filtering and quality evaluation of datasets of protein interactions ... 30
1.6.5. Methods for interpretation of interaction networks ... 33
1.6.5.1. General properties of interaction networks ... 33
1.6.5.2. Subnetworks and modules ... 36
1.6.5.3. Protein function prediction ... 38
1.6.6. Methods for network visualization ... 41
1.6.6.1. Graphs of nodes and edges ... 41
1.6.6.2. Matrix-based representation... 42
1.6.7. Interpretation of metabolic data ... 44
1.6.7.1. Comparison of metabolite abundances ... 44
1.6.7.2. Pathway analyses ... 45
1.6.8. Yeast databases ... 46
1.7. Rationale of the study ... 48
Chapter 2 : An in vivo map of the yeast protein interactome ... 49
2.2. Abstract ... 50
2.3. Introduction ... 51
2.4. Results ... 52
2.4.1. Experimental set-up ... 52
2.4.2. Automated image analysis ... 57
2.4.3. Data filtering ... 63
2.4.3.1. Detection of non-specific interactions ... 63
2.4.3.2. Interaction signal vs. background noise ... 65
2.4.3.3. Final filtered network ... 71
2.4.4. Hierarchical clustering of the yeast in vivo protein-protein interaction network ... 71
2.5. Discussion ... 75
2.5.1. Overlap with previous studies ... 75
2.5.2. Novel interaction ... 81
2.5.3. Enrichment of interactions with membrane proteins ... 81
2.5.4. Enrichment of interactions between compartments and processes ... 85
2.5.5. Enrichment of lipid related protein interactions ... 87
2.6. Conclusions ... 91
2.7. Materials and Methods ... 92
2.7.1. Data acquisition and image analysis ... 92
2.7.2. Statistical analyses ... 94
2.7.4. Analysis of protein abundance ... 95
2.7.5. Analysis of Gene Ontology enrichment ... 95
2.7.5.1. GO enrichment of sets of proteins ... 95
2.7.5.2. GO enrichment of interactions between pairs of terms ... 96
2.7.5.3. Semantic similarity scores ... 97
2.7.6. Datasets compared with DHFP PCA results ... 97
2.7.7. Overlap with previous large-scale studies ... 98
2.7.8. Clustering of high confidence interactions ... 99
Chapter 3 : High-content screening of yeast mutant libraries by shotgun lipidomics ... 101
3.1. Contribution to the published work ... 101
3.2. Abstract ... 103
3.3. Introduction ... 103
3.4. Materials and methods ... 107
3.4.1. Chemicals and lipid standards ... 107
3.4.2. Yeast strains ... 107
3.4.3. Prediction of uncharacterized genes with potential function in lipid metabolism. 108 3.4.4. First round screening: 96-well plate culturing ... 109
3.4.5. Lipid extraction in 96-well plates at 4˚C ... 109
3.4.6. Mass spectrometric lipid analysis and data processing for 96-well plate cultures 110 3.4.7. Classification of mutant strains into growth phase categories ... 111
3.4.9. Second round screening: Liquid culturing ... 112
3.4.10. Lipid extraction at 4˚C of samples obtained by liquid culturing ... 113
3.4.11. Mass spectrometric lipid analysis and data processing for samples obtained by liquid culturing ... 113
3.4.12. SoamD calculation ... 114
3.5. Results and discussion ... 116
3.5.1. A high-throughput platform for lipid phenotyping ... 116
3.5.2. Lipid profiling and data filtering for first round screening ... 120
3.5.3. Classification of deletion strains into growth phases ... 122
3.5.4. Identification of deletion strains with perturbed lipid phenotype ... 124
3.5.5. Second round screening of deletion strains with lipid phenotypes ... 127
3.5.6. YJR015W has a plausible role in GPI-anchor synthesis ... 130
3.5.7. Ybr141cp – a putative methyltransferase involved in sterol lipid metabolism .... 133
3.5.8. Kar4p – a transcription factor linked to nuclear membrane dynamics ... 135
3.6. Conclusion ... 138
3.7. Acknowledgments... 139
Chapter 4 : iVici: Interrelational Visualization and Correlation Interface ... 140
4.1. Contribution to the published work ... 140
4.2. Abstract ... 140
4.2. Introduction ... 141
4.3. Results ... 142
4.3.2. Extended color-schemes for comparing datasets ... 143
4.3.3. Software implementation ... 145
4.4. Discussion ... 145
4.4. Conclusion ... 147
Chapter 5 : Analysis of Lipid Experiments (ALEX): A Software Framework for Analysis of High-Resolution Shotgun Lipidomics Data ... 149
5.1. Contribution to the published work ... 149
5.2. Abstract ... 151
5.3. Introduction ... 152
5.4. Materials and Methods ... 154
5.4.1. Chemicals and lipid standards ... 154
5.4.2. Mouse brain tissue sampling ... 155
5.4.3. Lipid extraction ... 155
5.4.4. Shotgun lipidomics analysis ... 156
5.4.5. Annotation of lipid species ... 157
5.4.6. ALEX software ... 157
5.4.7. Data processing and visualization ... 158
5.5. Results and Discussion ... 158
5.5.1 Input: high-resolution shotgun lipidomics data ... 158
5.5.2. Design of the ALEX software framework ... 160
5.5.3. ALEX lipid database ... 163
5.5.5. ALEX converter ... 164
5.5.6. ALEX target list generator ... 166
5.5.7. ALEX extractor and ALEX unifier ... 168
5.5.8. Application of the ALEX software framework ... 170
5.5.9. Outlining the auxiliary workflow... 173
5.5.10. Application of the auxiliary workflow ... 176
5.6. Conclusions ... 179
5.7. Acknowledgments... 180
5.8. Author Contributions ... 180
Chapter 6 : Discussion and Conclusion ... 181
6.1. Contribution of DHFR PCA screen to the yeast interactome mapping ... 181
6.2. Normalized evaluation of the overlap between interaction datasets. ... 184
6.3. High-throughput lipidomics ... 185
6.4. Function prediction with experimental confirmation ... 186
6.5. Systems for visual programming and visual analytics ... 188
6.6. Future directions ... 190
6.6.1. Towards dynamics of protein-protein interactions ... 190
6.6.2. Database of reference lipidomic profiles ... 193
6.6.3. Investigation of special organization of lipid metabolic machinery ... 195
6.6.4. Correlation analysis of lipid concentrations with network constraints ... 197
6.7. Conclusion ... 198 Chapter 7 : References ... 201
List of Figures
Figure 1-1. Number of PubMed citations of “omics” technologies per year. ... 5
Figure 1-2. Matrix-based network representation. ... 43
Figure 2-1. In vivo PCA screen of the yeast protein-protein interaction network. ... 53
Figure 2-2. Experimental set-up of a large-scale PCA screen of the yeast protein-protein interaction network. ... 55
Figure 2-3. Automated extraction of colony intensities on plates. ... 62
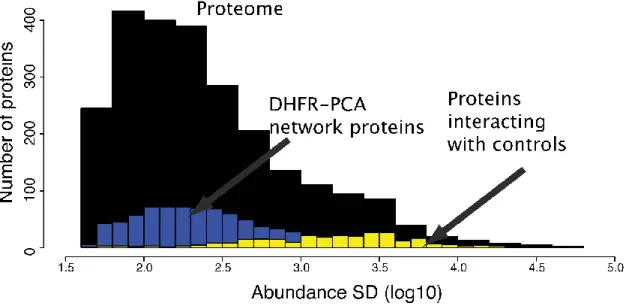
Figure 2-4. Distribution of protein abundance... 64
Figure 2-5. Distribution of colony intensities on plates. ... 64
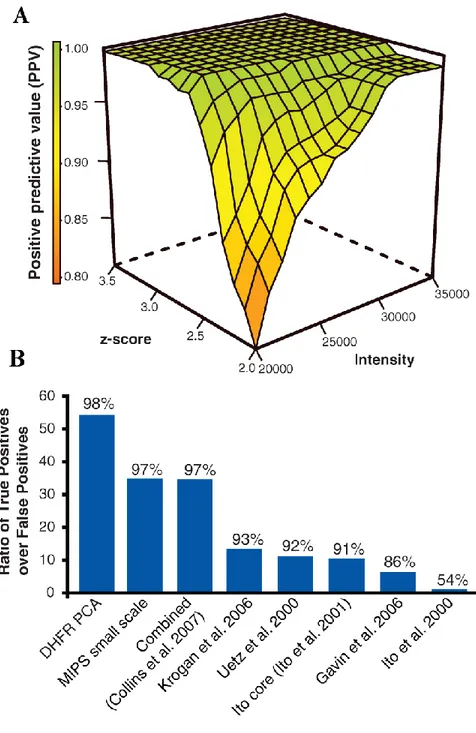
Figure 2-6. Quality assessment of DHFP- protein-protein interaction network. ... 69
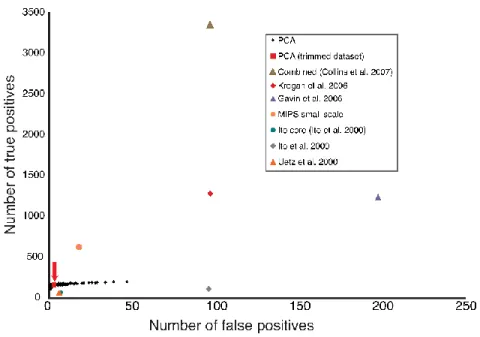
Figure 2-7. True Positives and True Negatives in PCA and other studies. ... 70
Figure 2-8. The DHFR PCA network is modular and interconnected. ... 74
Figure 2-9. Overlap of the DHFR PCA network with other large-scale experiments. ... 76
Figure 2-10. Comparison of normalized and non-normalized calculations of the overlap between datasets. ... 77
Figure 2-11. PCA protein-protein interactions versus protein complexes. ... 79
Figure 2-12. Interactions are enriched within Cellular Compartments Gene Ontology categories. ... 84
Figure 2-13. Interactions are enriched within Biological Process and Molecular Function Gene Ontology categories. ... 86
Figure 2-14. Network cluster linking proteins with unknown function with lipid related proteins... 90
Figure 3-1. Protein-protein interaction network of lipid metabolism and function. ... 115
Figure 3-2. Validation of the shotgun lipidomic screening platform. ... 119
Figure 3-3. Classification of strains into groups based on growth phase. ... 123
Figure 3-4. Identification of lipid phenotypes by robust principal component analysis. 126 Figure 3-5. Scoring of lipid phenotypes. ... 129
Figure 3-6. Interaction network and lipid phenotype of yjr015wΔ. ... 132
Figure 3-8. Lipid phenotype of kar4Δ. ... 137
Figure 4-1. Screenshot of iVici interface with PCA network. ... 144
Figure 5-1. Figure 1. Overview of the ALEX software framework and auxiliary workflow. ... 161
Figure 5-2. The ALEX lipid calculator. ... 165
Figure 5-3. Screenshots of the ALEX target list generator and ALEX extractor... 167
Figure 5-4. Quality control analysis. ... 171
Figure 5-5. Outline of the auxiliary workflow used for lipidome data processing. ... 175
Dedication
To my family. Thank you for your love and support.Acknowledgements
I would like to thank all the colleagues that worked with me during these years: the fantastic lab in Montreal, Canada (Michnick lab), the young lipidomics group in Odense, Denmark (Ejsing lab) and the lab of Danila Perumov and the whole Molecular and Radiation Biophysics Department of the Nuclear Physics Institute in St. Petersburg, Russia, where my scientific career has started, teachers from school N211 St.Petersrurg. I am grateful to Valentin Ribchin for the introduction to biophysics, Embek Nikolaevich Kazbekov for opening the lab to me, Danila Perumov for all his teaching and my first car, Rimma Kreneva for being a big part of my life, Sergey Steinberg for introducing me to demanding calculations and the science in 3D, my Finnish colleagues. I would like to thank Steven Michnick for the opportunity to work on the large-scale protein interaction project, the freedom to learn every aspect of it and the tough independence lessons. I’m grateful for the support to Jean-Francois Paradis and Sylvie Beauchemin. I thank Muriel, Colm, Edith and Zoya for their comments on the thesis manuscript.
Many thanks to friends around the globe. Special thanks to those who did not forget me while I was doing science overseas. Christophe, Luc, Alex, Philippe, Dimitri, Eugene, Igor for frequently reminding me that life is not only about science. My neighbors in Lachine (Marin, Lena, Anuta) for hospitality.
Finally, I thank my family for being there all the time. Without them, this work would not have been possible. Grandpa, thank you for believing in me!
Abbreviations
ALEX Analysis of lipid experiments
BP Biological process
cAMP Cyclic adenosine monophosphate
CC Cellular compartment
Cer Ceramide
CV Coefficient of variation
CYGD Comprehensive yeast genome database
DAG Diacylglycerol
DHFR Dihydrofolate reductase
DNA Deoxyribonucleic acid
dTMP Thymidine monophosphate
ER Endoplasmic reticulum
ESI Electrospray ionization
FT MS Fourier transform mass spectrometry
GDP Guanosine diphosphate
GFP Green fluorescent protein
GO Gene ontology
GPI Glycosylphosphatidylinositol
IPC Inositol-phosphoceramide
KEGG Kyoto encyclopedia of genes and genomes
LPA Lysophosphatidic acid
LPC Lysophosphatidylcholine
LPE Lysophosphatidylethanolamine
LPI Lysophosphatidylinositol
LPS Lysophosphatidylserine
mDHFR Murine dihydrofolate reductase
MF Molecular function
MIPS Munich information center for protein sequences mRNA Messenger ribonucleic acid
MS Mass spectrometry
MS/MS Tandem mass spectrometry
NMR Nuclear magnetic resonance
OD Optical density
ORF Open reading frame
PA Phosphatidic acid
PC Phosphatidylcholine
PCA1 Protein-fragment complementation assays PCR Polymerase chain reaction
PE Phosphatidylethanolamine
PE O- Ether-linked phosphatidylethanolamine
PI Phosphatidylinositol
PPV Positive predicted value
PS Phosphatidylserine
RNA Ribonucleic acid
ROC Receiver operating characteristic
SC Synthetic complete
SD Synthetic defined
SE Sterol ester
SGD Saccharomyces Genome Database
SHexCer Sulfatide
SoamD Sum of absolute mol% difference
TAG Triacylglycerol
TAP-MS Tandem affinity purification coupled to mass spectrometry
Y2H Yeast two-hybrid
1 An abbreviation for an experimental protein-fragment complementation assays (PCA) is the same as for a
mathematical method, called principal component analysis. In order to avoid confusion, abbreviation PCA in this thesis is only used in relation to protein-fragment complementation assay. The name of the mathematical method is always spelled out in the text as principal component analysis.
Chapter 1 : Introduction
Biological activity of the cell is orchestrated through the coordinated action of thousands of molecules. The coordination implies the assembly of large complexes consisting of smaller components, passing signals from one component to another, synchronization of events, and adaptation of cellular systems to perturbations. Recent developments in experimental technologies provide unprecedented opportunities to monitor the state of thousands of molecules and interactions between them at different time and conditions. Data generated by such large-scale screens stimulate development of computational methods for data integration and interpretation. Every new dataset provides observations for improving models of cellular processes and discovering new components and functions. The understanding of biological principles based on these data is a cyclic process. New data help to generate novel insights and hypotheses that can be validated and refined based on results of further experiments. The present thesis describes one of such cycles. First, we developed a novel methodology for screening interactions between proteins. Next, using computational analyses, we identified connections between proteins that suggested novel functions related to lipid metabolism for uncharacterized proteins. Finally, we conducted the second experimental screen to monitor changes in lipid composition due to inactivation of the predicted proteins to test proposed hypotheses about involvement in lipid metabolism and provided further details related to the discovered functions. In the introduction chapter, we present our model system, i.e. yeast. We describe experimental techniques for elucidating complex cellular networks and highlight advantages of our method for detecting protein-protein interactions. Further, we introduce
visualization and computational methods that are commonly used for network analyses, and we emphasize developments related to the function prediction. Finally, recent advances in metabolomics, lipidomics and its applications in yeast are reviewed. We conclude the introduction with setting the goal of the study presented in the thesis.
1.1. Yeast as a model system
To understand a complex system, one needs to study its smaller components. The cell is the smallest unit of life that is able to reproduce independently. In this thesis, we use yeast to study cellular networks. The benefit of yeast is not limited to baking, brewing and wine making. Yeast is an excellent model system to study cellular processes because of the following factors: fast growth (doubling time is about 90 minutes, in comparison, human HeLa cells double in about 24 hours); ease of handling in the lab; availability of powerful strategies for genetic manipulation; and finally, complex cellular organization similar to cells of higher eukaryotes, such as humans. The most popular species of yeast, Saccharomyces cerevisiae, also known as baker’s or budding yeast, was the source for the first sequenced eukaryotic genome completed in 1996 [1] (strain S288C). The study identified 5885 potential protein-encoding genes organized in 16 chromosomes. Because only 4% of the genes in Saccharomyces cerevisiae contain introns, the effect of alternative splicing is negligible. Thus, the number of proteins in the budding yeast is about the same as the number of the protein-encoding genes. About 31% of the yeast genes were found to have homologs in mammals [2] and for a number of disease-causing genes in humans corresponding yeast counterparts were identified [3].
1.2. Genetic manipulation of yeast
Success of genetic manipulation strategies is based on efficient transformation methods for introducing exogenous DNA into the yeast cells, the integration of a foreign DNA into specific regions of the genome, and the availability of the selectable markers for detecting the integration events.
The first reports of genetic transformation of Saccharomyces cerevisiae appeared in 1960 and currently standardized transformation protocols have been developed based on spheroplasting, electroporation, agitation with glass beads, or addition of lithium acetate, single-stranded carrier DNA and polyethylene glycol [4]. The latter method is the most commonly used because of the highest efficiency of the transformation [5]. Details about mechanisms causing the uptake of a foreign DNA are still poorly understood, and conditions of transformation protocols have been optimized empirically. The yeast cell can be transformed if incubated only with polyethylene glycol and DNA. It has been suggested that polyethylene glycol increases membrane permeability. The transformation rate is increased by heat shock and lithium acetate in intact cells, but not in cells with a disrupted cell wall. Therefore, it is likely that heat shock and lithium acetate help DNA to pass through the cell wall [6]. Double and single stranded DNA sticks to the cell wall. The addition of carrier DNA could saturate the DNA binding cites allowing the vector DNA that carry genetic material for manipulation to pass through the cell wall. It has been proposed that single stranded DNA further increases the transformation rate because it does not compete with the double-stranded vector DNA and binds more efficiently to the cell wall [4].
The transformations are performed with vectors that carry an engineered the yeast DNA construct with modified gene sequence and sequences coding for selectable markers. The transformation with vector DNA leads to incorporation of the construct sequence into a specific locus of the yeast genome [7]. The process relies on the yeast mechanisms for homologous recombination, which is a conserved process with a particular importance in repairing DNA double-strand breaks [8]. The insertion of an exogenous DNA sequence is driven by short sequences (30-50 bases) flanking the construct sequence that are homologous to the targeted region. The endogenous genomic sequence between the homologous regions is replaced with the sequence of the construct. Thus, the method is suited for gene modification by inserting particular sequences as well as for gene disruption by partly or completely deleting gene sequences [9].
Clones in which targeted DNA was successfully incorporated into the chromosomal DNA are selected based on the activity of a marker gene introduced with the construct. The functioning selectable marker allows cells to grow in the presence of an antibiotic (antibiotic resistance markers) [10] or in the absence of an indispensable compound, such as an amino acid, that cannot be synthetized by the original strain (auxotrophic markers) [11].
Yeast strains that were used in this thesis are based on the popular laboratory strain S288C that was sequenced in 1996 [1]. BY4741 strain is a MATa mating type, and BY4742 is a MATα mating type. Both strains are auxotrophic for histidine, leucine and uracil. In addition, BY4741 is auxotrophic for methionine, and BY4742 is auxotrophic for lysine, which allows mating type specific selection [11].
Figure 1-1. Number of PubMed citations of “omics” technologies per year.
Numbers of citations for each term per year is extracted with PubMed trend available at: http://dan.corlan.net/medline-trend.html
1.3. Functional genomics studies in yeast
Functional genomics is a discipline that attempts to study genes, proteins, small molecules and the interactions between them on a large scale. It combines the experimental high-throughput technologies and bioinformatics methods for data integration. Different types of function genomics studies performed in yeast are discussed below. Data presented in this thesis are generated using protein-protein interaction screen and lipidomics. Therefore, these technologies are discussed in detail. The level of development of each particular functional genomics field can be compared based on analysis of a number of PubMed citations per year. The trends plotted in Figure 1-1 show that protein-protein interactions and lipidomics fields are relatively new comparing to genomics and proteomics.
1.3.1. Gene expression and protein abundance
The earliest studies that took advantage of the availability of the whole genome sequence for conducting experiments on a genome-wide scale measured gene expression levels. The pioneering work that studied gene expression in the exponential growth phase and the diauxic shift defined the term “transcriptome” as a collection of gene identifiers and their expression levels in a population of cells [12]. Shortly after, changes of gene expression levels were studied during the cell cycle [13], sporulation [14] and stress response [15]. These are just a few examples of early studies that stimulated the development of technologies that were further applied to investigate transcriptome in other conditions in various organisms. Previous vast knowledge of yeast biochemistry made yeast an important validation test bed for development
of novel experimental high-throughput methods, such as DNA microarrays [16], and statistical methods for data analysis, such as hierarchical clustering and heat map visualizations [17]. Collectively, these efforts provided data on transcriptional regulation of the yeast genome in thousands of conditions. A dedicated resource for storing and retrieving yeast expression data combined results from over 2400 experimental conditions, which can be mined by an efficient data search algorithm for visualization of expression patterns of genes of interest and retrieving potentially related genes based on similarity of the expression profiles [18].
Gene transcription is not the only process that defines cellular abundance of proteins. Regulation of translation, post-translational protein modifications and degradation of proteins need to be considered for making accurate assumptions regarding protein levels at a given time in the cell. Therefore, dedicated methods for probing protein abundance are needed. Protein quantification in yeast has been performed by two-dimensional gel electrophoresis [19], quantitative western blot analyses of high-affinity epitopes [20] and flow cytometry of green fluorescent protein [21] fused with a collection of the yeast proteins, and more recently, mass spectrometry based analyses [22][23]. Comparison of the results of proteomics and transcriptomics studies have demonstrated that there is a significant correlation between mRNA and protein concentrations, but the estimated correspondence of mRNA expression and protein abundance in yeast is in the range between 30% and 90% [24]. Thus, proteomics measurements are important for understanding processes related to protein homeostasis that follow gene transcription. Measuring protein abundances is experimentally more challenging. Widely available gene expression data are commonly used as an estimate of cellular quantities of
corresponding proteins. Despite the differences in protein and gene expression, the latter provides highly accurate indication of whether a protein is present in the cell [25].
1.3.2. Collection of single gene deletion mutants
The genome-wide experimental strategies that followed early studies of gene expression used the sequence information and the genome transformation methods to systematically perturb or alter the yeast genes. The first study of that kind investigated phenotypes produced by a nearly complete collection of single gene deletion mutants [26,27]. A surprising outcome of the studies was the observation that most of deletion mutants did not show any growth defects. Only 18% of genes were found to be essential for growth on rich glucose medium. These data provided first hints about robustness and adaptation of an organism to perturbations of its individual components. A logical conclusion regarding the non-essential genes was that their role might be more important for surviving in specific conditions and resistance to particular perturbations. The essentiality of genes was further tested in numerous studies that investigated fitness of the gene deletion mutants under different growth conditions and in the presence of various drugs (comprehensively reviewed in [28]). The strategy helped to identify gene functions based on its response to specific perturbations. For example, screens with DNA damaging agents allowed to find genes required for maintaining the integrity of the genome [29][30]; modulation of the phosphatidylinositol metabolic pathway with wortmannin helped to establish novel pathway functions [31]. On the other hand, mechanism of action of drugs can be proposed based on the types of gene deletion mutants that are sensitive to the chemical compounds [32]. Using optical microscopy, additional cellular morphological phenotypes can be identified, such as shape, size
and aggregation tendency [27], which provide further data for inferring functions of the deleted genes.
1.3.3. Protein localization studies
The important feature of the genetic modification of yeasts by homologous recombination is the ability to insert sequences at desired locations. This strategy was employed to study cellular localization of the yeast proteins whose genes were tagged with a sequence of green fluorescent protein at C terminus. 4156 tagged strains expressed fusions with green fluorescent protein that could be observed by fluorescence microscopy [33]. Proteins were classified into 22 distinct subcellular localization categories, such as cytoplasm, nucleus and mitochondrion. 70% of proteins covered by the study did not have previously any localization information. Another study employed confocal laser scanning microscopy to investigate with high-resolution localization of lipid metabolic proteins. Increased resolution of the method allowed to gain insight into suborganellar organization of lipid biosynthetic pathways and visualize proteins localized to endoplasmic reticulum membrane, membrane extensions from the nuclear envelope and lipid droplets [34]. It will be discussed below that these observations are particularly important in the context of the current thesis, because they link lipid metabolism with membrane proteins. Next level of resolution for localization studies is achieved by employing isolation of cellular suborganelles and analysis of the protein content by mass-spectrometry. Investigation of protein content of lipid droplets is one example of such analyses [35]. Lipid droplets are particles that store cellular reservoirs of non-polar lipids used as energy sources and as membrane building blocks. Mass spectrometry analysis of protein content of the
particles revealed that they contain enzymes involved in fatty acid and ergosterol metabolism demonstrating that lipid droplets are essential for the lipid synthesis in addition to the role in lipid storage. Important extension to the mass spectrometry analysis of protein content of cellular components was the development of methodology for isolating protein complexes. As described below, applications using this strategy provided the most information on protein-protein interactions in yeast.
1.3.4. Studies of molecular interactions
Functional genomics strategies described above investigate a collection of states of individual components of the yeast cells, such as location or concentration of a given protein or phenotype produced by deletion of a gene. An important aspect of regulation of cellular processes is the coordinated communication between the cellular components that can be viewed as networks of molecular interactions. Biological networks are collections of associations between molecules that can be represented as graphs for computational data analysis and visualizations. The nodes of such networks are molecules (proteins, genes, metabolites) and edges are relationships between the nodes (protein-protein interactions, phosphorylation events, correlation between concentrations). Different types of experimental methodologies for capturing biological networks are described below.
Regulation of gene expression is mediated by transcription factors, proteins that bind to DNA sequence of their target genes and activate or repress the transcription. Large-scale identification of binding sites of transcription factors is enabled by chromatin immunoprecipitation followed by DNA sequencing or experiments with genomic microarrays
[36–38]. Experimentally defined binding sites of transcription factors can be used for predicting target genes based on determined binding sites specificities and promoter sequence analysis. Combination of knowledge about transcription factor bindings and data from gene expression analysis allow to identify factors that cause particular gene expression patterns [39].
Functional activity of a protein can be efficiently regulated by phosphorylation events, which lead to activation/deactivation of a protein function. This type of regulation is particularly important when a quick response to stimuli is needed. Phosphorylation events can be captured by variety of methods including mass spectrometry, kinase activity assays and western blot. Up to date, over 20 000 phosphorylation sites in yeast have been experimentally verified by high throughput mass spectrometry proteomics studies and small-scale experiments [40].
Analysis of gene essentiality in yeast demonstrated that individual deletion of most yeast genes does not result in growth defects [27]. However, when a pair of deletions is introduced it can enhance or reduce growth. Pair-wise relationships between deletion mutants are studied by accurate quantification of colony sizes or fitness of the mutants [41,42]. These data are assembled into gene interaction networks. Similarity of genetic interaction patterns between genes suggests that they might be involved in a common cellular process.
Recently, a novel large-scale approach has been developed for identification of protein-lipid interactions [43]. Authors have examined interactions between almost 200 proteins that have known lipid-binding domains and lipid enzymatic activities with lipid molecules from major lipid classes. Over 500 detected interactions provide another level of information for studying molecular networks.
1.4. Strategies for mapping protein-protein interaction networks
The focus of our study are networks of protein-protein interactions. An association of proteins into complexes of various sizes and interactions with other proteins for passing cellular signals define their functions. A collection of all protein-protein interactions forms an interactome of the cell that has been intensively studied for the last 15 years. Analysis of the interaction network can reveal functions of novel genes based on the connections with other proteins with established functional roles. The success of the protein function prediction is dependent on the coverage and accuracy of the interactome. At the time when we set our goal to contribute to the protein-protein interaction network mapping, reported experimental strategies for genome-wide analysis of the yeast interactome relied on two methods: yeast two-hybrid (Y2H) and tandem affinity purification coupled to mass spectrometry (TAP-MS). These methods and the method that we chose for novel genome-wide interaction screen, i.e. protein-fragment complementation assays (PCA)1, are described below, followed by an overview of large-scale documented applications of the techniques.
1.4.1. Yeast two-hybrid
The yeast two-hybrid method was developed as a genetic system for detecting protein-protein interactions in vivo. In contrast to traditional biochemical methods such as crosslinking,
1 An abbreviation for an experimental protein-fragment complementation assays (PCA) is the same as for a
mathematical method, called principal component analysis. In order to avoid confusion, abbreviation PCA in this thesis is only used in relation to protein-fragment complementation assay. The name of the mathematical method is always spelled out in the text as principal component analysis.
co-immunoprecipitation and co-fractionation by chromatography, Y2H does not require any protein purification or isolation [44]. Therefore, Y2H can be efficiently adopted for conducting large-scale experiments [45]. Y2H is based on the activity of the transcriptional factor GAL4 (the most common option, however, applications with other transcription factors also exist) that consists of a DNA binding domain and an activating domain. Two hybrid proteins are then constructed: a protein “X” with the binding domain and a protein “Y” with the activating domain. If two proteins “X” and “Y” interact in the nucleus, they bring into proximity the GAL4 domains and enable transcription of GAL4 controlled genes, which products are used as reporters for the interaction. The advantage of Y2H is the ability to detect potentially direct protein-protein interactions. It should be noted that in vitro experiments with purified proteins are needed for confirming that an interaction is truly direct. Interactions that are detected by cell-based assays could be mediated by other protein, DNA and RNA molecules. Nevertheless, interactions detected by Y2H are commonly described as binary. This term implies that the method used for detecting an interaction tested a pair of proteins as opposed to a protein complex co-membership minimizing the chance for presence of intermediates. Another attractive feature of the method is the ability to use cell-based survival assays for detecting interactions. Thus, protein purification, extraction and identification steps are avoided. These factors define the cost-effectiveness and scalability of Y2H and explain why it is the most widely used method for both small and large-scale studies [46]. Early genome-wide screens for protein interactions in yeast have been suspected to contain a large number of false positive interactions [47]. However, recent developments of the method that control artifacts related to spontaneous auto-activation of the reporters, contamination by several plasmids, genetic mutations and effects of
overexpression of tested proteins significantly improved the reliability of the technique [48]. The main limitation of Y2H is the fact that interactions are detected in the nucleus of Saccharomyces cerevisiae. Thus, non-nuclear proteins are not tested in their natural context that may lead to false positive and false negative results. Proteins are directed into nucleus by nuclear localization signal attached to binding and activating domains of the GAL4. Regardless of the presence of the nuclear localization signal, for some proteins, such as transmembrane proteins, it would be difficult or impossible to enter the nucleus. Therefore, Y2H results are biased against interactions involving this type of proteins. Finally, the fusion of proteins with GAL4 domains are expressed from plasmids, which disconnects interaction events from the physiological regulatory mechanisms.
1.4.2. Tandem affinity purification coupled to mass spectrometry
TAP-MS (tandem affinity purification coupled to mass spectrometry) is an alternative strategy that is suited for monitoring protein-protein associations under near-physiological conditions. The strategy is based on the extraction and purification of proteins that are physically associated with a tagged bait protein followed by the identification of purified proteins by mass spectrometry [49][50]. Because of the efficient methods for tagging bait proteins, scalable purification procedures and increased availability of mass spectrometers, TAP-MS method rapidly gained popularity for studying protein complexes. The advantage of the method is the untargeted identification of protein complex composition. Binary methods for detecting interactions require preparation of corresponding protein fusions for all pairs of proteins that need to be tested. In the case of TAP-MS, experiments with a few tagged baits can reveal
composition of large complexes. In yeast tag can be introduced by homologous recombination, so tagged proteins remain under the regulation of the native promoters, which is a clear advantage for investigating dynamics of protein associations under different conditions in the nearly intact physiological context.
Strictly speaking, the method does not identify protein interactions. It detects collections of associated proteins that are assigned to protein complexes based on co-purification frequency and clustering analyses [51]. In the context of TAP-MS method, an interaction between two proteins means that these proteins belong to the same complex. Thus, for a pair of proteins from a macromolecular complex the method does not provide an answer of whether there is a physical contact between the two. TAP-MS experiments are associated with a technical challenge related to nonspecific binding of proteins to the tag or solid matrix used for immobilization of a ligand that require careful control experiments [52]. Furthermore, TAP-MS experiments are repeated with several baits for retrieving components of the same complexes multiple times. Processing of co-purification data with sophisticated statistical algorithms minimizes the influence of the contaminants on the determination of complex composition [51].
1.4.3. Protein-fragment complementation assays
To increase the coverage of the yeast interactome, we have conducted a genome-wide screen utilizing a technique that combines strengths of Y2H and TAP-MS approaches. Protein-fragment complementation assays (PCA) can be conducted in vivo as a survival cell-based assay like Y2H screens, without the need for mass spectrometers. Similarly to TAP-MS, PCA is based on protein tagging that can be performed in yeast by homologous recombination to introduce
desired sequence to the targeted genes. Thus, tested gene products remain under control of their natural promoters. Tagging from the C-termini keeps the N-termini localization signal intact. Therefore, tagged proteins can follow their physiological localization path. The PCA strategy is based on a simple idea that a reporter protein can be dissected into two fragments. These fragments can be fused with proteins which ability to interact is being tested [53]. When two proteins interact, they bring into proximity the reporter fragments and allow them to fold into a normal three-dimensional structure and regain the reporter function. PCA strategy can be employed with variety of functional reporters, such as fluorescent proteins for microscopy assays and reporter enzymes that can be used for survival selection assays [54]. PCA detects direct or near-direct binary interactions between proteins. The detected interactions may be mediated by other molecules. However, the length of linkers that connect interacting proteins with the reported fragments defines how far two proteins can be apart from each other to allow fragment refolding. The large-scale screen described in Chapter 2 [55], relied on a survival selection assay based on a dihydrofolate reductase (DHFR) PCA [56]. The screening strategy employs yeast strain with inhibited endogenous DHFR activity that is not able to grow in the presence of methotrexate, a drug that inactivates cellular proliferation. Methotrexate-resistant DHFR mutant is used as a reporter. Yeast strain that expresses a pair of interacting proteins fused with fragments of methotrexate-resistant DHFR can proliferate in the presence of methotrexate when an interaction leads to refolding of the reporter fragments into a functional methotrexate-resistant DHFR reporter.
1.4.4. Large-scale studies of protein-protein interactions in yeast
We started setting up the genome-wide protein-protein interaction screen by DHFR PCA when the yeast interactome coverage was limited with few published reports describing technological developments for conducting large-scale protein interactions screens. Two studies presented large-scale Y2H screens in 2000 and 2001 and two studies published results of TAP-MS screens in 2002. The first Y2H study [57] reported 957 interactions between 1004 proteins and the second study [58] reported in total 4549 interactions between 3278 proteins. However, a smaller number of interactions from the second study was confirmed two (1533 interactions) or three times (841 interactions). The later set of interactions (core data) is considered more reliable and interactions that were not confirmed multiple times are commonly excluded from data analyses. The two TAP-MS studies reported data on complex membership of about 25% of the yeast proteins each [59,60]. One of the most intriguing observations that came from comparative analysis of the results was that the majority of interactions reported by each study were novel [47,61]. It has been proposed that the poor overlap between the studies is due to the large number of potential false-positive interactions in the early screens and method specific biases or preferences for certain types of interactions. Based on the results of these studies it was estimated that the yeast interactome contains from 16 000 to 26 000 interactions [62]. Therefore, it was evident that none of the screens reached saturation in covering the interactome. An alternative screen with a novel technique would significantly contribute to the interaction network mapping. Prior to publication of results of our DHFR PCA screen, several large-scale interaction studies were published [63–65] that were extensively compared with our data as
described in Chapter 2. For consistency, it should be noted that after the publication of our results two more studies have been published presenting a comprehensive map of binary Y2H [66] and membrane interactions [67]. However, these recent results were not part of our computational analyses.
1.5. Yeast metabolomics and lipidomics
1.5.1. Metabolomics
In the previous sections, methods for elucidating biological networks of molecular interactions were discussed. The investigation of networks followed the path starting from genes (carriers of inherited information), to proteins (performers of particular cellular functions), to cellular phenotypes (collections of observable characteristics defined by combination of cellular functions). Metabolic state of a system is a novel type of information that recently received substantial attention. Small molecule metabolites are important cellular constituents that are metabolized by proteins and contribute to the cellular homeostasis. The amount of currently available information about genes and proteins on a genome-wide scale is wider than what we know about metabolites. This is mainly related to analytical challenges associated with monitoring abundances of small models. Moreover, the absence of a blue print for metabolites, such as genome sequence for proteins, makes the discovery of new bioactive molecules a much slower process than modern genome sequencing. The advances in chromatographic techniques, such as gas and liquid chromatography, nuclear magnetic resonance spectroscopy and mass spectrometry have been instrumental for commencing investigation of the cellular metabolome
- the full collection of metabolites of the cell [68]. Metabolomics is a corresponding field of research that focuses on identification and quantification of all cellular metabolites that can be classified into the following major classes: amino acids, nucleotides, toxins, vitamins, sugars and lipids. Comparing to 4 bases that define genome and 20 amino acids that are used to build proteins, metabolome is more complex in terms of diversity of chemical structures it comprises. This leads to emergence of metabolomics sub-disciplines, such as lipidomics, glycomics and peptidomics, that study particular types of metabolites [69]. The division is associated with physiochemical properties of molecules of particular types, as for example, lipidomics focused on lipids, which are generally hydrophobic compounds soluble in organic solvents.
In contrast to many functional genomics strategies discussed above that were first developed and tested in yeast before finding their applications in other organisms, the development of metabolomics is not originating from yeast research. In fact, there has been a tremendous development of metabolomics applications in plants because of the rich source of metabolites and potential scientific and applied applications [70]. Because of implications of metabolites into various diseases [71] and the promising potential of metabolic biomarkers in early disease diagnostics [72], metabolomics studies of human samples greatly outnumber attempts to scrutiny metabolome of simple eukaryotic model systems. Nevertheless, a number of elegant studies were performed in Saccharomyces cerevisiae that paved the way for integration of metabolomics into the yeast systems biology framework.
The first proof of concept metabolomics study in yeast investigated metabolic phenotypes of deletion mutants that did not show any growth defect in glucose-limited aerobic
and anaerobic conditions [73]. Authors proposed that despite the absence of an observable growth phenotype, destitution of metabolites in the mutants could be adjusted to compensate for the effect of the mutation and maintain the normal growth rate. Measurements of metabolites by enzymatic assays and high-resolution 1H-NMR spectroscopy demonstrated that deletion of PFK26 and PFK27 genes that encode 6-phosphofructo-2-kinase (6PF-2-K; EC 2.7.1.105), which catalyzes the conversion of fructose-6-phosphate into fructose-2,6-bisphosphate, resulted in distinct metabolic phenotypes comparing to the reference strain. Moreover, if the function of only one of the genes were known, the function of the second gene would be suggested based on the observed similarity of metabolic signatures of the two mutants. A follow-up study performed by the same group further developed the technology to enable high-throughput metabolomics screens [74]. Authors performed metabolic analysis of extracellular metabolites of about 20 gene deletion mutants from a broad range of metabolic categories. Measurement of extracellular metabolites (metabolic footprinting) was performed as alternative to determination of intracellular levels (metabolic fingerprinting) because it allows to avoid complications associated with a rapid turnover, quenching and extraction of metabolites. Unlike, quantitative metabolic profiling that focuses on quantification of all measured metabolites, the method compared raw mass spectra to identify differences between strains and experimental conditions that can be further investigated with higher accuracy. The method was not sufficiently sensitive to identify unknown peaks in the metabolic footprint. However, it could detect differences between the mutants and group together deletion strains of genes with common function, e.g. amino acid metabolism. The short running time of 2 minutes per sample makes the method attractive for a rapid systematic search for mutants with perturbed metabolism. Alternative
metabolic profiling methods with higher resolution have been developed for relative or absolute quantification of metabolites by 1H-NMR spectroscopy [75,76] and mass spectrometry [77–80]. These early works centered on the development of technologies for quantification of 50-100 molecules from various metabolic classes and demonstrated their performance on metabolic differences induced by selected growth conditions or few mutations. Data generated by these efforts stimulated development of computational methods for integrating metabolomics with transcriptomics [81,82] and the genome-scale yeast metabolic models [83].
The first genome-wide metabolomics study in Saccharomyces cerevisiae assessed amino acid levels in 5000 single-gene deletion mutants [84]. Researchers who performed the study, argued that metabolomics methods based on chromatography, mass spectrometry and nuclear magnetic resonance studies are time intensive limiting their accessibility for screening for thousands of samples. Alternatively, amino acids were analyzed starting from fluorescent derivatization of cell extracts, separation by capillary electrophoresis and detection by laser-induced fluorescence. Analysis of one sample took about 8 minutes allowing to conduct the whole screen in 2 months. Around 700 gene deletion mutants showed at least eightfold change comparing to the reference strain in at least one amino acid. The findings suggest that various factors influence amino acid levels, such as vacuolar structure and mitochondrial activity. In line with previous studies, authors demonstrated that similarity of metabolic profile help to propose gene functions to previously uncharacterized genes. The yeast metabolome has not been covered yet at this scale by mass spectrometry methods. However, recent studies demonstrate increasing feasibility of experiments employing mass spectrometry by providing data for
hundreds of samples related to metabolome dynamics in various conditions [85] and genetic factors of metabolome variability [86].
1.5.2. Lipidomics
Metabolomics approaches measure a range of diverse metabolites, such as amino acids, nucleic bases, vitamins, sugars and metabolic precursors. As discussed earlier, in-depth analysis of specific metabolites requires dedicated analytical platforms. Lipids are the focus of lipidomics. The diversity of lipids define their involvement in many key biological processes, such as membrane homeostasis, energy storage and signaling [87]. That is the reason why eukaryotes have dedicated hundreds of genes to maintenance of lipid homeostasis. This makes lipidomics an attractive tool for functional genomics studies of a broad range of cellular processes. Current advances in the yeast lipidomics are summarized below and a novel lipidomics approach for discovery of lipid related genes is presented in Chapter 3.
Similarly to other “omics” technologies, the advancements in lipidomics can be viewed as a two-step process. First, analytical methods are developed and optimized to increase speed, coverage and quantification accuracy of lipid species detection. Next, the established platforms are applied for answering biological questions. The classical methods for studying lipids relied on radioactive and fluorescent labeling of lipids and separation by high performance liquid chromatography and thin-layer chromatography. Gas chromatography followed by mass spectrometry is a common method for analysis of fatty acid content of chromatographically separated lipid classes. However, these methods can be tedious and time consuming, and they are not sensitive enough to distinguish between various lipid species with a similar molecular
mass. A breakthrough in lipidomics is associated with a new generation of methods that take advantage of increased sensitivity and resolution of mass spectrometry combined with the development in tandem mass spectrometry, soft ionization techniques that don’t cause lipid fragmentation (matrix-assisted laser desorption/ionization and electrospray ionization (ESI)) and faster liquid chromatography methods that require lower sample volumes [88,89]. NMR spectroscopy has been also applied for determining structures of purified lipids and investigation of the structure and dynamics of lipid membranes. However, higher sensitivity of mass spectrometry-based methods make them much more common in lipidomic applications.
One of the early studies that applied mass spectrometry lipidomics in the yeast Saccharomyces cerevisiae utilized nanoelectrospray ionization tandem mass spectrometry to investigate membrane phospholipid composition of distinct cellular compartments [90]. It has been known that distribution of lipid classes is not uniform among the cellular compartments with examples of membrane specific classes, such as cardiolipin for the inner mitochondrial membrane, and sterol and sphingolipids for the plasma membrane. By utilizing tandem mass spectrometry lipid molecular species, i.e. lipid head group that defines the lipid class and the precise acyl chain substituent of a lipid, could be detected. A clear difference between acyl chain composition within phospholipid classes was observed in different membranes providing evidence that membrane lipid composition is regulated at the molecular species level. A later study demonstrated for the first time functional differences between two pathways of phosphatidylcholine synthesis [91]. This major lipid class of the eukaryotic membranes is synthesized either via the methylation of phosphatidylethanolamine or via the CDP-choline route. By blocking one of the pathways, phosphatidylcholine synthesis was forced to go through
one of the routes. As a result, distinct profiles of molecular lipid species were observed with a greater molecular diversity of phospholipids attributed to the CDP-choline route. These pioneering studies highlighted a new level of complexity of lipid regulation that can be investigated by the modern mass spectrometry methods. The technology was rapidly adopted by several research groups that collected lipidomics data for refining the current knowledge of lipid metabolism in yeast (for a comprehensive review see [92,93]). The technology was further improved for analyzing diverse lipid classes in a single experiment. Several methods for a rapid and comprehensive coverage of the yeast lipidome by mass spectrometry have been recently published [94–97]. Electron spray ionization followed by high resolution mass spectrometry was utilized as a rapid method for detecting lipid species from the major yeast lipid classes (glycerophospholipids, free fatty acids, triacylglycerides and sphingolipids) [94,95]. In this approach, that is termed as shotgun lipidomics, lipid extracts are directly infused into a mass spectrometer avoiding the time consuming chromatographic separation, which shortens the running time of the MS analysis to 5 to 10 minutes. An alternative protocol that optimized lipid extraction procedures and solvent composition, and employed tandem mass spectrometry (MS/MS) experiments quantified 250 lipid species from 21 lipid classes [96]. It was also demonstrated that an increased coverage of lipid classes and minor lipid species could be achieved by coupling liquid chromatography with ESI-MS. An introduction of a 30 minutes separation step allowed to profile simultaneously in a simple MS experiment glycerophospholipids, sphingolipids, waxes, sterols and mono-, di- as well as triacylglycerides [97]. The availability of tools for a fast and comprehensive analysis of the yeast lipidome empowered lipidomics studies that could investigate a greater number of lipids in more
conditions and mutants. The recent applications of the methods include investigation of the lipid composition of lipid rafts [98], influence of variety of growth conditions on dynamic properties of the lipidome [99], and relation of mitochondrial membrane lipidome to the yeast longevity [100]. However, there were no previous reports of attempts to analyze lipidomes of hundreds of yeast samples similarly to the above-mentioned functional genomics studies. Thus, to the best of our knowledge, the lipidomics screen described in Chapter 3 is the first step towards a large-scale identification of the lipidomic phenotypes in yeast.
1.6. Informatics and mathematics concepts related to yeast
functional genomics studies
1.6.1. Hypothesis testing and statistical significance
Generation of new hypotheses based on available data and conducting experiments for confirming them is a crucial process in biological sciences. A common hypothesis tested by biologists is whether there are differences between certain properties of biological systems, such as phenotypic characteristics between different types of cells and changes in gene expression, protein and metabolite levels due to perturbation. Statistical tests evaluate whether there is a difference between observations that is unlikely due to chance or experimental error. We briefly summarize below conceptual basics of statistical testing. Details about calculations and additional methods can be found, for example, in the following references: [101,102]. In case, when a number of samples is low, graphical plots of measurements with error bars are employed
to evaluate uncertainty associated with a measurement. In Chapter 3 of the thesis, we use such representation to display an average of two values with an error bar displaying two originally measured values (Figures 3-6 – 3-8). Alternatively, error bars can display standard deviation or confidence intervals. When a large number of samples is available, that is typical in high-throughput experiments, statistical significance of a result can be computationally tested. In that case, research hypothesis, i.e. a prediction made by a researcher, is reformulated with two statistical hypotheses: the null hypothesis (H0 in mathematical notation) that states that there is no difference between observations and the alternative hypothesis (H1) that states that there is a difference. Statistical testing is employed to calculate a test statistics. A value of a test statistics is compared to a theoretical distribution of all possible values that test statistics could have if an experiment was repeated an infinite number of times using the same number of samples. Critical values of test statistics that are unlikely to be observed if the null hypothesis is correct can be found in special statistical tables. Comparison of observed test statistics with these critical values indicate whether a result of a study is statistically significant. In scientific practice, it is common to call a result statistically significant if a likelihood of obtaining such a result by chance is not higher than 5%. A likelihood is indicated by a p-value, therefore for a statistically significant result the following notation is used: p <= 0.05. Methods for calculating test statistics and p-values are dependent on data distribution and can be parametric or non-parametric. Parametric methods, such as a popular Student’s t-test rely on assumption that experimental outcomes are independent from one another and come from a normal distribution. If the assumptions are met, a p-value can be calculated based on a magnitude of differences between mean values of experimental outcomes detected in different conditions and a standard deviation