OATAO is an open access repository that collects the work of Toulouse
researchers and makes it freely available over the web where possible
Any correspondence concerning this service should be sent
to the repository administrator:
[email protected]
This is an author’s version published in:
http://oatao.univ-toulouse.fr/20988
To cite this version:
Fabié, Laure and Agostini, Pierre and Stopel, Martijn and
Blum, Christian and Lassagne, Benjamin and Subramaniam,
Vinod and Ondarçuhu, Thierry Direct patterning of
nanoparticles and biomolecules by liquid nanodispensing.
(2015) Nanoscale, 7 (10). 4497-4504. ISSN 2040-3364
Official URL:
https://doi.org/10.1039/c4nr06824f
Direct patterning of nanoparticles and biomolecules
by liquid nanodispensing
Laure Fabié,
a,bPierre Agostini,
cMartijn Stopel,
dChristian Blum,
dBenjamin
Lassagne,
cVinod Subramaniam,
d,eand Thierry Ondarçuhu
aWe report on the localized deposition of nanoparticles and proteins, nano-objects commonly used in many nanodevices, by the technique of liquid nanodispensing (NADIS) which consists in depositing droplets of solution through a nanochannel drilled at the apex of an AFM tip. We demonstrate that the size of spots can be adjusted from microns down to sub-50nm by tuning the channel diameter, independently of the chemical nature of the solute. In the case of nanoparticles, we demonstrated the ultimate limit of the method and showed that large arrays of single (or pairs of) nanoparticles can be reproducibly deposited. We further explored the possibility to deposit different visible fluorescent proteins using NADIS without loss of protein function. The intrinsic fluorescence of these proteins is characteristic of their structural integrity; the retention of fluorescence after NADIS deposition demonstrates that the proteins are intact and functional. This study demonstrates that NADIS can be a viable alternative to other scanning probe lithography techniques since it combines high resolution direct writing of nanoparticles or biomolecules with the versatility of liquid lithography techniques.
Introduction
The miniaturisation of devices and machines undertaken by nanotechnology is mainly motivated by the wish to improve their performances. Indeed, nanodevices often include nano-objects as building blocks in order to benefit from the specificities of matter at the nanoscale. Among these objects, nanoparticles and proteins have attracted significant attention due to the wide spectrum of envisioned applications that may emerge in nanoelectronics or nanobiotechnology. The interest aroused by nanoparticles comes from the exceptional properties resulting from their large surface/volume ratio. In the last decades, the synthesis of colloids has known great progress leading to the fabrication of a huge variety of nanoparticles with controlled sizes and shapes and in various materials like metals, ceramics or polymers.1 The patterning of arrays of biomolecules and in particular proteins on surfaces is also of great interest, providing new opportunities both for fundamental studies such as cell adhesion2 and for potential applications in genomics or proteomics (biochips, biosensors…).3
The development of such hybrid nanodevices is extremely promising but still suffers from several difficulties. Among them, the physical manipulation of matter at the nanoscale, for example to integrate nano-objects onto pre-structured surfaces or to fabricate functional arrays, remains challenging and thus
attracts a lot of attention, with as ultimate goal, the deposition and manipulation of individual nano-objects.
With that aim, various techniques have been designed to complement standard lithography methods such as e-beam lithography. Addition lithography methods such as micro- or nano-contact printing,4 nanoimprint,5 inkjet printing,6 or scanning probe nanolithography7 often combined with self-assembly, have been successfully applied to create patterns of nanoparticles or biomolecules. These strategies have allowed achieving a high lateral resolution which is routinely of the order of 100 nm – 1 µ m and can be scaled down to sub-50 nm. 8-12
In this framework, Scanning Probe Nanolithography techniques- lithography assisted by an atomic force microscopy tip - and especially Dip Pen Nanolithography (DPN), have proven their efficiency for the deposition of patterns with high resolution and versatility.13 DPN is a process relying on transferring molecules by molecular diffusion from an inked AFM tip put in contact with the substrate, and gives lateral resolutions that can be as small as 15 nm.14, 15 It is particularly well adapted for direct deposition of small molecules but it experiences limitations for the transfer of large objects. Indeed DPN is often used as an indirect deposition method using thiol molecules, whose patterning by DPN is well documented, as intermediates for the immobilization of larger objects. Patterns of functionalized thiol molecules on gold are used as templates to attach the molecules of interest, in a
second step usually performed ex situ. Many different nanoparticles or biological objects have been patterned using this indirect patterning.16
Direct patterning of large objects faces the issue of their very low diffusion. It is only in particular situations that nanoparticles can be deposited reproducibly from the tip.17-20 Direct patterning of biomolecules has been demonstrated in many situations but requires specific strategies based on chemical functionalization of the tip and substrate, to control the interaction with the molecules and to facilitate their adsorption and diffusion.12 Dedicated tips with porous21 or agarose gel22 coatings provide a more generic use of DPN. Since the nano-objects of interest are often dispersed in a liquid solvent, it appeared that the development of a generic method, independent of the solute nature, would be facilitated if the deposition could be performed directly from the solution. Elaborate solutions such as nanofountain pen23, 24 or FluidFM technologies25, 26 have been developed with that aim and have demonstrated sub-micron resolution in air or liquid environments.
Fig 1 (a) Schematic representation of the deposition of nano-objects by a NADIS
tip; (b) SEM image of a NADIS tip with a 130 nm channel drilled at its apex.
To overcome the restrictions inherent to DPN and improve the resolution of related methods, a liquid nanodispenser called NADIS was developed. NADIS is a scanning probe lithography method using a modified AFM tip to transfer liquid from a reservoir droplet, placed on the cantilever, to the surface (Fig. 1a).27 The liquid flows by capillarity through a channel drilled at the tip apex by Focused Ion Beam (FIB) milling, and feeds the meniscus that is created when the tip is brought into contact with surface. Previous work demonstrated the high repeatability of this method for a large range of spot sizes from several microns down to 50 nm.28 Using highly concentrated solutions of small molecules as markers of the droplet size, the deposition mechanism could be understood providing protocols to adjust the main deposition parameters (nanochannel size, contact time) for a desired target spot size.29 In this manuscript, we demonstrate that NADIS is a generic method that can be applied to a wide range of nano-objects. We show that colloidal particles and even proteins can be patterned with high lateral resolution regardless of their precise chemical nature. NADIS is particularly suitable for this operation since the deposition is directly performed by transferring a small volume of solution, keeping the particles in their initial phase. The only requirement is to use a solvent with a low volatility to avoid the evaporation of the open reservoir placed on the cantilever. We demonstrate the fabrication of arrays of individual polystyrene nanoparticles. We further show that fluorescent proteins can be
deposited with sub-50 nm resolution while keeping the structure and hence activity intact, as evidenced by multiparameter fluorescence microscopy. This study emphasizes the advantages of a direct manipulation of droplets of liquid solutions30 both in terms of versatility and in terms of deposited material.
Results and discussion
Deposition of polystyrene nanoparticles.
We first used NADIS to pattern nanoparticles. In fact, more than showing that NADIS can be used to deposit large objects, we also aimed at demonstrating that it allows one to reach an ultimate resolution with the deposition of individual objects. We therefore selected particles with rather large size (25 nm in diameter) chosen to enable the imaging and counting of nanoparticles. For the deposition presented herein, polystyrene nanoparticles were diluted in glycerol to reduce the evaporation of the reservoir. The concentration of 3,8.10-8 mol/L which corresponds to 1 NP/43aL was chosen so that, for the range of available dispensed volumes (from femtoliter down to attoliter) the expected number of particles per spot should vary from hundreds to less than one. The volume of the droplets was adjusted by changing the aperture size. Indeed, a previous study showed that, for hydrophobic tips such as the ones used in the present study, the size of glycerol droplets on APTES functionalized substrates is approximately twice the size of the aperture.28 Note that in the experiments reported below, the contact time is large enough to obtain a meniscus in equilibrium state. A fine control of the droplets size could be obtained by reducing the contact time according to the spreading mechanism reported in 29 but was not used here.
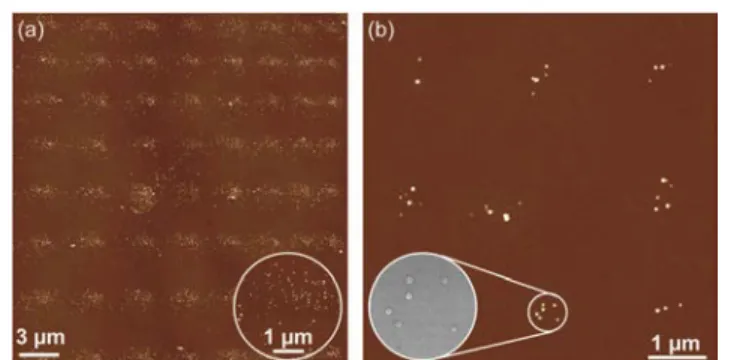
A first pattern of nanoparticles was made to prove the feasibility of depositing nanoparticles with NADIS using a tip with a large aperture of 760 nm (Fig. 2a). The array imaged by AFM after solvent evaporation appears regular. All spots are present and have similar properties, the same size (2 µm in diameter) and contains about one hundred particles per spot (a precise counting is difficult since AFM is not always able to differentiate NPs in aggregates). This is consistent with the fact that droplets volume is of the order of 3 fL which, given the NPs concentration, should correspond to ~70 NP/spot.
Fig. 2 (a) AFM image of an array of 64 spots obtained with a NADIS tip with a
nm; inset : SEM image of one spot with 6 NPs which confirms that the dots observed by AFM are individual NPs.
Then, to reduce the size of the deposits, we changed tip properties by decreasing the diameter of the channel down to 300 nm (tip presented in Fig. 1b). Figure 2b represents an array of spots deposited with this NADIS tip. The number of nanoparticles by feature is decreased to less than 10 while the spot diameter measures about 500 nm. Imaging by SEM of the same spots confirmed that the protrusions observed by AFM consist of individual NPs (Fig. 2b). The droplet volume is estimated of the order of 200 aL which corresponds to about 4 NP/spot, consistent with the observations.
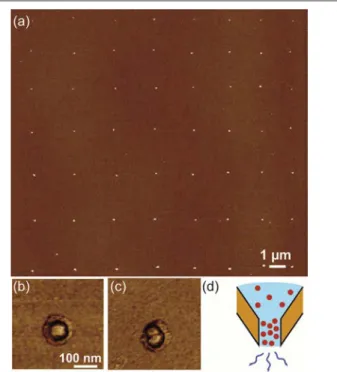
In the aim to further reduce the deposit size and assess the limit of the method, we performed experiments with a NADIS tip with a channel diameter of 130 nm. An AFM image of a pattern of 56 spots is reported in Fig. 3a. Surprisingly, we observe that no spots are missing and each one includes only one or two NPs. The number of NP/spot can be estimated on the topographic image or on the profile, but is more visible in the phase image which clearly shows the number of NPs present in the spot (Fig. 3b-c). SEM images confirmed the interpretation from the AFM images.
Fig. 3 (a) AFM image of an array of 56 spots obtained with a NADIS tips with a
diameter of 130 nm; (b) AFM phase image of a spot with individual NP; (c) Same on a pair of NP. Note that the lateral size of the particle is affected by tip effects and is therefore much larger than the actual size of the particle; (d) Scheme of the concentration at the tip apex induced by evaporation.
Even if the initial volume of the droplets is not known precisely, we estimate that it is of the order of 10 aL. Since the concentration of the NPs suspension corresponds to 1 NP/43 aL, it is expected that not each spot would contain a nanoparticle, and thus that many spots should therefore not be resolvable in the AFM image. Moreover, a statistical
distribution was expected, as observed for example on Fig. 2b where the number of NPs/spot ranges from 2 to 7 for the small part of the array reported. We observe that in the case of the 130 nm aperture tip, for the whole array of 56 spots the distribution is peaked with 43 % of spots with 1 NP and 57 % with 2 NP/spot. One possible interpretation of this observation could be that, given the very small volumes of liquid present at the extremity of the nanochannel, evaporation may lead to an increase of the concentration of NPs at the tip apex (Fig. 3d). Indeed, this is consistent with the fact that, in all experiments performed with small aperture tips, the first (or the first two) arrays were not found. It is therefore possible that a large concentration is required to have deposition and, when this condition is achieved, the deposition is reproducible, with the number of NP/spot being defined by geometrical contraints. This study shows that the deposition of large objects like NPs is possible by NADIS. For a given system, it is possible to control the number of NP/spot by changing the nanochannel diameter with hydrophobic tips. We have demonstrated the reproducible deposition of individual (or pairs of) NPs over large arrays. This latter case is interesting since it allows to go beyond the anticipated statistical distribution observed for larger droplets. Such direct deposition of individual objects was not reported yet using scanning probe lithography techniques. Moreover, compared to direct deposition with DPN, which leads to a dense layer of NPs,18 one advantage of NADIS is that the density of NPs in the spot can be smaller and may be controlled by the concentration of the dispensed solution. The resolution is also better than the that obtained by nanofountainpen23 or FluidFM approaches.26
Immobilization of proteins
The direct patterning of biomolecules by DPN has proved its efficiency,12, 31-33 provided tip functionalisation is performed to increase adsorption on the tip and diffusion of the molecules to the surface to speed the writing process. Since this surface treatment depends on the nature of the biomolecule, DPN may be potentially hampered by a lack of generality. Another potential drawback of this method is that partial drying of the solution on the tips may lead to protein denaturation.12, 32 These issues are partially fixed by using porous or gel covered tips.21, 22
We have used NADIS as an alternative approach to pattern proteins. The main advantages of NADIS may come from the direct manipulation of droplets of solutions which should be independent of the chemical nature of the proteins, significantly increase the speed of transfer from tip to surface and reduce the denaturation by keeping the biomolecules in their solution state during the whole deposition process.
We used different visible fluorescent proteins as model systems. The fluorescence of fluorescent proteins relies on the structural integrity of the protein, since disturbing the characteristic 3D beta-barrel structure of the protein scaffold invariably results in a loss of fluorescence.34, 35 We can thus use the intrinsic fluorescence of fluorescent proteins as a reporter of the protein structural integrity. Further we deposited
monomeric as well as tetrameric fluorescent proteins. Monomeric fluorescent proteins typically have a molecular weight around 25kDa, forming a protein barrel of a diameter of 2,4 nm and a height of 4,2 nm. The tetrameric variants used are of roughly 100 kDa, forming a cube of roughly 5 nm. The fluorescent proteins used in this study thus bridge the size range between the low molecular weight small molecules and the nanoparticles deposited in this work. In order to increase the evaporation time of the reservoir which is too short for aqueous solutions, we performed NADIS deposition with glycerol/water mixtures as solvent of the proteins. Previous studies demonstrated the feasibility of glycerol as solvent for fluorescent proteins. Denaturation of any loss of structural integrity or activity has not been observed when using glycerol36 as solvent which is in full agreement with our observation that glycerol does not affect the fluorescent protein emission spectra in solution.
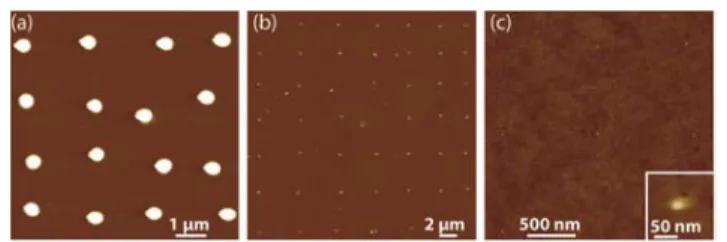
We first patterned the monomeric enhanced green fluorescent proteins (EGFP) with different NADIS tips in order to check if the transfer mechanism is similar to the one already observed with small molecules or nanoparticles. The results reported in Fig. 4 were obtained with a hydrophobic tip with a 760 nm aperture, a hydrophilic tip with a 110 nm channel and the same tip after treatment to make its outer wall hydrophobic. The mean spots sizes are 650 nm, 100 nm and 30 nm respectively. This follows the trends already demonstrated with NADIS tips on the influence of wetting properties of the tip and of the aperture diameter. This observation is consistent with the fact that the size of spots with NADIS is mainly determined by the wetting properties of the solvent on the substrate. More precise tuning of droplet size could be obtained by decreasing contact time.29 Figure 4c also demonstrates that NADIS reaches very high resolution, comparable with the state-of-the-art of biomolecular patterning. The number of proteins per spot in this case (Fig. 4c) is estimated of the order of 60.
Fig. 4 AFM images of arrays of spots of EGFP proteins obtained with (a) a
hydrophobic tips with a 760 nm aperture ; (b) a hydrophilic tip with a 110 nm aperture ; (c) the same tip as (b) functionalized by dodecanethiol; inset: zoom on a spot.
To verify the general applicability of the NADIS method to deposit fluorescent proteins we repeated the experiments with different proteins of different properties. We deposited the monomeric proteins S65T which is emitting in the green part of the spectrum and the red emitting monomeric protein mStrawberry. To see if the size and molecular weight has a direct influence on the deposition, we also patterned the tetrameric protein DsRed. In essence we obtained the same results as with EGFP in terms of spot sizes with a wide range of
available sizes. We did not observe differences between depositing monomeric or tetrameric proteins. Independent of the proteins being monomeric or tetrameric, we do observe some differences in the repartition of the molecules. Two major types of pattern shapes were identified: (i) a flat island with height 4 ± 0,2 nm, coherent with the size of the proteins, which covers the whole part of the initial droplet (Fig. 4a) or only a part of it (Fig. 5a) the latter case giving irregular shapes; (ii) an aggregate of proteins at the center of the initial droplets (Fig. 5b-c). This variation may come from the differences in the interaction of the proteins with the substrate but it more probably originates in the exact mechanism of evaporation37-39. Depending on the concentration of biomolecules in the initial droplets, the evaporation may occur with a fixed contact line leading to islands (Fig 5a) or with a fixed contact angle resulting in central aggregates (Fig. 5c) or intermediate case (Fig. 5b).
Fig. 5 AFM images of proteins arrays (a) monomeric mStrawberry proteins
deposited with a hydrophobic 760 nm NADIS tip; inset: zoom on one spot showing an island like deposit. Note that the size of this island is consistent with an arrangement of 6000 proteins ( the estimated number of deposited proteins) in close-packed monolayer. (b) monomeric S65T proteins deposited with a 760 nm NADIS tip; inset: zoom on one spot showing a protein aggregate in the center. (c) tetrameric DsRed proteins deposited with a 300 nm NADIS tip. Scale bar of insets : 1 µm.
NADIS can therefore be used to pattern different types of proteins with sub-50 nm resolution (see for example Fig. 4c). However, applications e.g. in proteomics, require maintaining the biological activity of the proteins connected to the structural integrity of the proteins. For fluorescent proteins the structural integrity of the protein is directly linked to the protein fluorescence. With that aim, the arrays were imaged by intensity, lifetime and spectral microscopy and spectral analysis. In order to find easily the patterns using the optical microscope, numbered gold marks were deposited by photolithography on the glass slides. The arrays were imaged by a custom-built multimodal microscope allowing wide field fluorescence imaging and scanning confocal microscopy for spectral and lifetime analysis.40 Intensity imaging was first performed to localize the arrays. Examples of AFM and fluorescence intensity images performed on the same array of EGFP proteins spots are reported in Fig. 6. The spots are clearly visible in the optical images confirming that the molecules kept their fluorescence properties after deposition. The diameter of the spots (measured as full width at half maximum FWHM) is larger in the fluorescence image (FWHM = 400nm) than in the AFM image (FWHM = 250-350 nm) due to the fact that the resolution limit of the optical method is reached.
Fig. 6 Images of an array of EGFP proteins (a) AFM image; (b) Fluorescence
Intensity image.
From the AFM images it is clear that even very small deposits with sizes well below 200 nm can be made using NADIS. The size of these deposits is thus well below the optical diffraction limit, and fluorescence from such small deposits is expected to be weak due to the limited number of fluorescent proteins within each deposit. It will only be possible to detect these very small deposits if the majority of the deposited proteins remain fluorescent, hence structurally intact, after deposition. We therefore created a pattern with shrinking spot size.
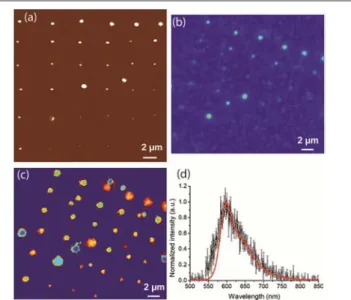
This was realized by using a particular pattern obtained when the reservoir of the NADIS tip was nearly empty after the deposition of tens of arrays. The lack of liquid leads to a decrease of the size of the spots from the 800 nm obtained at the beginning to 150 nm at the end of the reservoir liquid as evidenced in Fig. 7a.
Fig. 7 Images of an array of GFP proteins (a) AFM image; (b) Intensity
fluorescence image; (c) lifetime image. Note that optical images are tilted by about 20° with respect to the AFM image; (d) emission spectra of mStrawberry proteins immobilized on the surface (black dots) and in solution (red line).
In the fluorescence intensity image (Fig. 7b) the spots larger than about 400 nm are easily visible. Smaller spots are weakly visible whereas the smallest spots cannot be seen. For these small spots the fluorescent protein emission is too weak to be discriminated from the detected background. However, using fluorescence lifetime imaging to enhance contrast and to
discriminate between background and fluorescence results, yields fluorescence lifetime images that clearly show the smallest deposits (figure 7c). Additional spots not related to the deposits that also become clearly visible in the fluorescence lifetime picture are due to omnipresent fluorescent contaminations since the samples were not prepared under single molecule detection conditions.
Additionally, we performed spectral analysis to further assess the integrity of the deposited proteins, since a change of the fluorescence spectrum would likely reflect structural changes in the protein. Fig.7d reports the spectrum recorded on a deposited spot (black dots) and the spectrum measured in solution (red line). These two curves are similar, showing that the proteins retains the characteristic fluorescence spectrum expected, and thus most likely do not undergo any significant denaturation during the deposition process. This is consistent with the observation made in solution that glycerol does not damage fluorescent. This appears to be true even for the high glycerol concentrations obtained at the very end of the evaporation of the deposited droplets due to a faster evaporation of water. However, we were not able to record undisturbed emission spectra for all deposited fluorescent proteins. For the monomeric protein EGFP we found broadened and red shifted emission compared to the emission of EGFP in solution – although we were able to image even very small deposits of EGFP (see figure 7). This change in emission spectrum might indicate for this protein a change in structure due to the immobilisation on the surface, which could be interpreted as a loss in biological activity.
Experimental
NADIS tips fabrication and deposition procedure
NADIS tips were fabricated by milling, using a focused ion beam (FIB, dual beam Zeiss 1540XB), a nanochannel at the tip apex of commercially available tips (OMCL-RC, Olympus), following the procedure detailed in 28. This technique gives a precise control of the shape and size of tip apertures, in the 100 nm range routinely and down to a diameter of 35 nm in the best conditions. For all the results reported below the surface properties of the tip were modified by chemical functionalization of the gold layer coating the tip outer wall by dodecanethiol or fluorodecanethiol chemistry. It was shown previously that such hydrophobic tips, upon which the liquid does not spread, are optimal since the spot size is controlled by the nanochannel diameter.
The NADIS tips were loaded with the solution of desired nano-objects in glycerol (or glycerol/water mixtures) with a micropipette connected to a microinjector (Narishige) and controlled by a micromanipulator (The Micromanipulator Inc.). Droplets with a diameter of about 30 µm injected on the cantilever were used as the reservoir. The volume of the reservoir is of the order of 0,5 pL which corresponds to about 4 thousands droplets with diameter 2 µ m or 4 millions nanodroplets of diameter 100 nm. A tip loaded with a
glycerol/water mixture (60/40 v/v) can be used during two hours before complete evaporation of the reservoir, which is much larger than the time taken for arrays deposition (from a few seconds to a few minutes per array depending on its size and deposition rate). Changes in reservoir concentration due to evaporation are therefore not taken into account. In order to avoid complete evaporation of the reservoir which would lead to a clogging of the nanochannel by the dried solute, the tips were rinsed in dichloromethane just after deposition and can be re-used. Two AFM setups were used to perform the deposition: (i) A multimode PicoForce atomic force microscope (Bruker) operated in force spectroscopy mode; (ii) a Dimension 3000 (Bruker) equipped with a nanopositioning table which is used to move the sample with respect to the tip and allows, thanks to dedicated software, a deposition rate of the order of 10 spots/s.41 Deposition was performed in ambient conditions with no humidity control. This parameter which is crucial for DPN is less relevant for NADIS since the liquid is provided by the tip. However, humidity may control the evaporation rate which is, in standard conditions, of the order of a few minutes for the larger spots (micron scale) or a few seconds for droplets in the 100 nm range.37
Characterization methods
In order to facilitate the SEM imaging and the localization by AFM of the deposits whose dimensions are below the optical resolution limit, we used silicon dioxide or glass substrates with gold numbered marks patterned by photolithography. For fluorescence microscopy, additional localization marks consisting of 10 µ m droplets of fluorescent protein solutions were deposited close to the arrays using a microinjector. After deposition and evaporation of the solvent (which takes a few minutes depending on the droplet size37), the deposits were first imaged in Tapping mode AFM. In the case of nanoparticles, scanning electron microscopy was used as an additional characterization method. Fluorescent proteins were studied by fluorescence microscopy on a custom-built multiparameter fluorescence microscope capable to image intensities, emission spectra and fluorescence lifetimes based on Time Correlated Single Photon counting (TCSPC), for details see 40, 42. Light of 485 nm wavelength was used to excite all proteins, and fluorescence was detected via a 488 nm long pass filter.
Nanoobjects
The nanoparticles used were carboxylate modified polystyrene nanoparticles with diameter 25 nm, dispersed in water (2% in mass) (fluorospheres, Invitrogen). The results presented below were obtained with solutions obtained by a ten-fold dilution of the commercial solution in glycerol. The resulting concentration was 3,8.10-8 mol/L which corresponds to 1 NP/43aL. Interestingly, the volumes of solution dispensed by NADIS can be of the order of the attoliter which should allow reaching the limit when each droplet does not contain one NP. The used monomeric (EGFP, S65T and mStrawberry) and tetrameric (DSRed) fluorescent proteins were obtained as
reported previously.43, 44 The concentration of the aqueous protein stock solutions used was about 20 µ M for all proteins. These solutions were then diluted in glycerol (40/60) for NADIS deposition.
Surface functionalization
Surface functionalization was performed to optimize the interaction of the nano-objects with the surface and immobilize them for further characterization. In the case of polystyrene nanoparticles, aminopropyltriethoxysilane (APTES) was used in order to obtain a positively charged silicon dioxide surface giving a strong electrostatic interaction with the negatively charged nanoparticles. In order to improve the adhesion of proteins on the substrate we used the polyhistidine-tag engineered onto the proteins for purification purposes. The polyhistidine-tag of the proteins binds to the surface treated with Nickel(II) Nitrilotriacetic acid (Ni-NTA) following the protocol described in 45, 46. Prior to deposition the quality of the surface treatments was checked by AFM. Indeed, the identification of the nanometer scale spots requires perfectly clean substrates with no aggregates coming from the surface functionalization. This was achieved by careful cleaning of the substrates by piranha solution (a 2:1 mixture of concentrated sulfuric acid with 30% hydrogen peroxide, v/v; caution: hazard) followed by thorough rinsing in a water overflow tank and optimization of the chemical reactions.
Conclusions
In this paper, we have reported on the direct patterning of nano-objects such as nanoparticles and proteins using liquid nanodispensing. We demonstrated the ability to tune the size of spots and the amount of deposited material by changing the tip properties. The advantage of this method lies in the fact that, once a procedure is optimized to dispense a given droplet size, any soluble material, whatever its size and chemical nature, can be patterned with this resolution. In the case of nanoparticles, we demonstrated the reproducible patterning of spots containing one or a pair of individual nanoparticles, whereas for larger scales the distribution is more statistical. This unexpected result can be interpreted as an effect of solvent evaporation at the tip apex. Four different kinds of proteins were also patterned with an ultimate resolution below 50 nm. The resulting patterns were analysed by advanced fluorescence microscopy. In particular, lifetime imaging was used to image the very small patterns. Spectral analysis was also used to study the activity of the deposited proteins, which is a crucial point for applications.
The combination of high resolution patterning characteristic of scanning probe microscopy combined with the versatility brought by a direct manipulation of minute amounts of solutions makes that NADIS is an interesting technique for patterning of nano-objects and may find applications in many different areas of nanosciences.
This work was partially supported by the French ANR project Carnamags ANR-10-JCJC-1003. P.A. acknowledges PRES of University of Toulouse for a PhD grant. We acknowledge financial support of the collaboration between CEMES and MESA+ by the FP6 Network of Excellence Frontiers under contract number NMP4-CT-2004-500328 FRONTIERS NoE.
Notes and references
a Nanosciences group, CEMES-CNRS, 29 rue Jeanne Marvig, 31055 Toulouse cedex 5, France.
b University of Toulouse, 29 rue Jeanne Marvig, 31055 Toulouse cedex 5, France.
c LPCNO, INSA, 135 avenue de Rangueil, 31077 Toulouse cedex 4, France.
d
Nanobiophysics Group, MESA+ Institute for Nanotechnology, University of Twente, 7500 AE, Enschede, The Netherlands.
e Nanoscale Biophysics, FOM Institute AMOLF, Science Park 104, 1098 XG Amsterdam, The Netherlands.
References
1. C. Burda, X. B. Chen, R. Narayanan and M. A. El-Sayed, Chemical
Reviews, 2005, 105, 1025-1102.
2. K. B. Lee, S. J. Park, C. A. Mirkin, J. C. Smith and M. Mrksich,
Science, 2002, 295, 1702-1705.
3. P. Jonkheijm, D. Weinrich, H. Schroeder, C. M. Niemeyer and H. Waldmann, Angewandte Chemie-International Edition, 2008,
47, 9618-9647.
4. S. A. Ruiz and C. S. Chen, Soft Matter, 2007, 3, 168-177.
5. V. N. Truskett and M. P. C. Watts, Trends in Biotechnology, 2006,
24, 312-317.
6. J. T. Delaney, Jr., P. J. Smith and U. S. Schubert, Soft Matter, 2009,
5, 4866-4877.
7. S. Kramer, R. R. Fuierer and C. B. Gorman, Chemical Reviews, 2003,
103, 4367-4418.
8. X. Z. Zhou, F. Boey, F. W. Huo, L. Huang and H. Zhang, Small, 2011, 7, 2273-2289.
9. K. L. Christman, V. D. Enriquez-Rios and H. D. Maynard, Soft
Matter, 2006, 2, 928-939.
10. P. M. Mendes, C. L. Yeung and J. A. Preece, Nanoscale Research
Letters, 2007, 2, 373-384.
11. H. Tran, K. L. Killops and L. M. Campos, Soft Matter, 2013, 9, 6578-6586.
12. C.-C. Wu, D. N. Reinhoudt, C. Otto, V. Subramaniam and A. H. Velders, Small, 2011, 7, 982.
13. R. D. Piner, J. Zhu, F. Xu, S. H. Hong and C. A. Mirkin, Science, 1999, 283, 661-663.
14. K. Salaita, Y. Wang and C. A. Mirkin, Nature Nanotechnology, 2007,
2, 145-155.
15. D. S. Ginger, H. Zhang and C. A. Mirkin, Angewandte
Chemie-International Edition, 2004, 43, 30-45.
16. R. A. Vega, D. Maspoch, K. Salaita and C. A. Mirkin, Angewandte
Chemie-International Edition, 2005, 44, 6013-6015.
17. M. Ben Ali, T. Ondarcuhu, M. Brust and C. Joachim, Langmuir, 2002, 18, 872-876.
18. B. Basnar and I. Willner, Small, 2009, 5, 28-44.
19. D. Roy, M. Munz, P. Colombi, S. Bhattacharyya, J.-P. Salvetat, P. J. Cumpson and M.-L. Saboungi, Applied Surface Science, 2007,
254, 1394-1398.
20. W. M. Wang, R. M. Stoltenberg, S. Liu and Z. Bao, ACS Nano, 2008,
2, 2135-2142.
21. C.-C. Wu, H. Xu, C. Otto, D. N. Reinhoudt, R. G. H. Lammertink, J. Huskens, V. Subramaniam and A. H. Velders, Journal of the
American Chemical Society, 2009, 131, 7526-7527.
22. A. J. Senesi, D. I. Rozkiewicz, D. N. Reinhoudt and C. A. Mirkin,
ACS Nano, 2009, 3, 2394-2402.
23. B. Wu, A. Ho, N. Moldovan and H. D. Espinosa, Langmuir, 2007,
23, 9120-9123.
24. K.-H. Kim, R. G. Sanedrin, A. M. Ho, S. W. Lee, N. Moldovan, C. A. Mirkin and H. D. Espinosa, Advanced Materials, 2008, 20, 330-+.
25. A. Meister, M. Gabi, P. Behr, P. Studer, J. Voeroes, P. Niedermann, J. Bitterli, J. Polesel-Maris, M. Liley, H. Heinzelmann and T. Zambelli, Nano Lett., 2009, 9, 2501-2507.
26. R. R. Grueter, J. Voeroes and T. Zambelli, Nanoscale, 2013, 5, 1097-1104.
27. A. Meister, M. Liley, J. Brugger, R. Pugin and H. Heinzelmann,
Appl. Phys. Lett., 2004, 85, 6260-6262.
28. A. P. Fang, E. Dujardin and T. Ondarçuhu, Nano Lett., 2006, 6, 2368-2374.
29. L. Fabie and T. Ondarcuhu, Soft Matter, 2012, 8, 4995-5001. 30. E. Dujardin, T. Ondarçuhu and L. Fabie, in Nanoscale liquid
interfaces: wetting, patterning and force microscopy at the molecular scale, eds. T. Ondarçuhu and J. P. Aimé, Pan
Stanford Publishing, Singapore, 2013, pp. 441-491.
31. K. B. Lee, J. H. Lim and C. A. Mirkin, Journal of the American
Chemical Society, 2003, 125, 5588-5589.
32. J. H. Lim, D. S. Ginger, K. B. Lee, J. Heo, J. M. Nam and C. A. Mirkin, Angewandte Chemie-International Edition, 2003, 42, 2309-2312.
33. D. L. Wilson, R. Martin, S. Hong, M. Cronin-Golomb, C. A. Mirkin and D. L. Kaplan, Proceedings of the National Academy of
Sciences of the United States of America, 2001, 98,
13660-13664.
34. W. W. Ward and S. H. Bokman, Biochemistry, 1982, 21, 4535-4540. 35. R. Y. Tsien, Annual Review of Biochemistry, 1998, 67, 509-544. 36. K. Suhling, J. Siegel, D. Phillips, P. M. W. French, S. Leveque-Fort,
S. E. D. Webb and D. M. Davis, Biophysical Journal, 2002,
83, 3589-3595.
37. J. Arcamone, E. Dujardin, G. Rius, F. Perez-Murano and T. Ondarcuhu, Journal of Physical Chemistry B, 2007, 111, 13020-13027.
38. H. Y. Erbil, G. McHale and M. I. Newton, Langmuir, 2002, 18, 2636-2641.
39. R. G. Picknett and R. Bexon, J. Colloid Interface Sci., 1977, 61, 336-350.
40. C. Blum, Y. Cesa, M. Escalante and V. Subramaniam, Journal of the
Royal Society Interface, 2009, 6, S35-S43.
41. T. Ondarcuhu, L. Nicu, S. Cholet, C. Bergaud, S. Gerdes and C. Joachim, Rev. Sci. Instrum., 2000, 71, 2087-2093.
42. M. H. W. Stopel, J. C. Prangsma, C. Blum and V. Subramaniam, Rsc
Advances, 2013, 3, 17440-17445.
43. C. Blum, A. J. Meixner and V. Subramaniam, Chemphyschem, 2008,
9, 310-315.
44. C. Blum, A. J. Meixner and V. Subramaniam, Journal of the
American Chemical Society, 2006, 128, 8664-8670.
45. C.-C. Wu, D. N. Reinhoudt, C. Otto, A. H. Velders and V. Subramaniam, ACS Nano, 2010, 4, 1083-1091.
46. P. Maury, M. Escalante, M. Peter, D. N. Reinhoudt, V. Subramaniam and J. Huskens, Small, 2007, 3, 1584-1592.
Table of contents entry
Liquid nanodispensing is used to deposit large arrays of individual nanoparticles and spots of different kinds of proteins which are intact and functional as demonstrated by fluorescence miscroscopy.