OATAO is an open access repository that collects the work of Toulouse
researchers and makes it freely available over the web where possible
Any correspondence concerning this service should be sent
to the repository administrator:
[email protected]
This is an author’s version published in: http://oatao.univ-toulouse.fr/27631
To cite this version:
Kilymis, Dimitrios and Ispas, Simona and Hehlen, Bernard and
Peuget, Sylvain and Delaye, Jean-Marc Vibrational properties of
sodosilicate glasses from first-principles calculations. (2019)
Physical Review B, 99 (5). ISSN 2469-9950
Official URL:
Vibrational properties of sodosilicate glasses from first-principles calculations
Dimitrios Kilymis,*Simona Ispas,†and Bernard Hehlen‡
Laboratoire Charles Coulomb (L2C), Université Montpellier, CNRS, F-34095 Montpellier, France
Sylvain Peuget and Jean-Marc Delaye
CEA, DEN, DE2D SEVT LMPA, F-30207 Bagnols-sur-Cèze, France
The vibrational properties of three sodosilicate glasses have been investigated in the framework of density functional theory. The pure vibrational density of states has been calculated for all systems and the different vibrational modes have been assigned to specific atoms or structural units. It is shown that the Na content affects several vibrational features as the position and intensity of the R band or the mixing of the rocking and bending atomic motions of the Si-O-Si bridges. The calculated Raman spectra have been found to agree with experimental observations and their decomposition indicated the dominant character of the nonbridging oxygen contribution on the spectra, in particular for the high-frequency band, above 800 cm−1. The decomposition of the high-frequency Raman feature into vibrations of the depolymerized tetrahedra (i.e., Qn units) has revealed spectral shapes of the partial contributions that cannot be accounted for by simple Gaussians as frequently assumed in the treatment of experimentally obtained Raman spectra.
I. INTRODUCTION
Raman and infrared (IR) spectroscopies are well-established characterization tools of the silicate glasses and melts in both research laboratories and industries. Although the Raman and IR spectra are easy to collect, the spectral responses are complex, combining broad and overlapping peaks due to the inherent structural disorder of these materials. Consequently, the decomposition and extraction of structural information from Raman and IR data are often based on parallelisms to well-known crystalline analogs, and result in a phenomenological and mostly qualitative approach [1,2]. A good and quantitative understanding of the structural signif-icance of the features of the Raman spectra, as well as that of the two other vibrational spectra (IR and inelastic neutron scattering spectroscopies), can be achieved theoretically using atomistic calculations, in particular ab initio ones. In this context, the major aim of this study is to use atomistic sim-ulation approaches in order to improve our ability to connect measured vibrational properties of binary silicates to their structural features.
The great advantage of the atomistic modeling is that the positions of the atoms in the system under study are continuously monitored and the structure is exactly known. Therefore, correlations can be extracted between the atomic structure and the vibrational modes in order to arrive to a more quantitative interpretation of the vibrational spectra and their
*Present address: CIRIMAT, Université Toulouse 3 Paul Sabatier, CNRS, INPT, Bât. CIRIMAT, 118, route de Narbonne, Toulouse cedex 9 31062, France.
†[email protected] ‡[email protected]
dependence on the chemical composition, pressure, quench rates, etc. The vibrational modes are not directly accessible in experiments, and the calculated spectra are derived through functions describing how the modes with a given frequency are coupled to the probing radiation (photons, neutrons, etc.) [3–5].
The vibrational density of states (VDOS) can be in practice accessed either through the diagonalization of the dynamical matrix of the glass structure (in a local potential minimum), or the Fourier transform of the velocity autocorrelation function. Within a classical approach, most of the empirical potentials existing in the literature are quite reliable from the point of view of the structure but they often fail to reproduce the experimental VDOS, even for systems as simple as pure silica or germania [6,7]. Ab initio methods are much more accurate in the prediction of the vibrational properties of materials but they have been scarcely used in this scope, due to the high computational cost associated with the treatment of glass systems [4,6,8–18]. More specifically, the fact that one has to model a system which lacks symmetry makes the calculations more time consuming and finally results to systems that at best contain a few hundreds of atoms.
The calculations of the Raman spectra of a glass have in general three stages: (i) generation of a structural model; (ii) the calculation of its vibrational properties; and (iii) the calcu-lation of derivatives of the polarizability tensor with respect to atomic displacements (i.e., the Raman susceptibilities). For the latter, two frameworks can be considered, either a first-principles one [19,20] or an empirical one, called bond polarizability model [21,22]. Within the bond polarizability approximation, calculations for silica and binary sodosilicate glasses have achieved satisfying agreement with experimental data [23–26]. We note that Raman intensities can be equally computed from the dynamical autocorrelation functions of
the dielectric tensor in a molecular dynamics (MD) simula-tion [5,27] approach which can be applied to liquids as well as to anharmonic solids, but is very demanding, requiring the calculation of the dielectric tensor at each MD step.
Concerning the vibrational spectra of silicate glasses, most work carried out within an ab initio approach has focused on the simplest case of vitreous SiO2. The early work of
Sarnthein et al. elucidated the nature of the high-frequency modes [8], while more recent works further elaborated on the VDOS of silica, as well as its IR and Raman spectra [4,9,10,18]. For more complex cases, theoretical calculations and analysis of the vibrational spectra have been carried out for sodosilicates [25], borosilicates [17], aluminosili-cates [13,28], phosphosilicates [14,29,30], and magnesium silicates [16].
In this work, we report on the vibrational properties of three binary sodosilicate glasses whose structures have been prepared by combining classical and ab initio MD simula-tions. We present their VDOS and its decompositions ac-cording to types of vibrations and contributions from specific structural units. At the same time, we report results on the total and partial Raman spectra, aiming to help resolve the origins of different vibrational modes and better interpret ex-perimental results. As Raman spectroscopy probes the short-and medium-range order in glasses, this modeling approach may supply quantitative criteria for the spectral analysis.
II. SIMULATION METHODS
The selected sodosilicate glasses of this study contain 20.0%, 25.0%, and 33.3% Na2O, hereafter called NS4, NS3,
and NS2, respectively. Two samples per composition have been prepared, containing 180, 204, and 207 atoms for NS4, NS3, and NS2, respectively. In order to circumvent the costly preparation within an ab initio molecular dynamics (MD) simulation, we have generated our structural models by em-ploying a classical MD approach during the melt-and-quench cycle followed by a rather short ab initio MD run at room temperature. As it has been shown in past studies conducted using this combined approach [4,13,31–34], the use of the ab
initio approach mostly serves as a way to refine the
short-range structure, while the medium short-range remains practically unchanged. The switch from a classical to an ab initio ap-proach can have a dramatic effect on the calculated vibrational properties [6]. Similarly, Giacomazzi et al. extracted the vibra-tional properties of silica glass prepared with both methods with the results suggesting that they generally produce similar results, with some discrepancies arising due to the slightly different Si-O-Si angle distributions [4].
The initial preparation of the NS2 and NS3 glass structures, as well as that of one NS4 structure, has been performed using classical MD by employing the Guillot-Sator potential, with a cutoff set at 6 Å [35], starting from a random atomic distribu-tion in a cubic box reproducing the experimental density [36]. The systems were then heated to 4000 K and equilibrated for 20 ps using the constant volume–constant temperature (NVT) ensemble, before being quenched stepwise to 300 K with a rate of 1011K/s using NVT. Due to an inaccurate description
of the medium-range order in the case of the NS2, a third system has been prepared this time using a 1010K/s quench
rate. Two final equilibrations of 20 and 5 ps were finally performed, using the constant pressure–constant temperature (NPT) ensemble and the constant volume–constant energy (NVE) ensemble, respectively. Due to slight contractions of the glasses during the NPT phase, some of the final structures were rescaled in order to match the experimental density values, and were then reequilibrated for 5 ps using the NVE ensemble. The classical MD simulations were carried out with Berendsen thermostats and barostats, using an integration step equal to 1 fs. They were carried out using theDL_POLY4.01
software [37]. As a second structure for the NS4 composition, we have used one previously generated, similarly through combined classical and ab initio MD simulations, albeit with a different classical potential [38].
In a second step, we used the above classical structural models as input configurations for ab initio MD simulations carried out using the Vienna ab initio package (VASP) [39,40].
The electronic degrees of freedom were treated in the frame-work of density functional theory (DFT), using the general gradient approximation (GGA) and the PBEsol functional [41,42]. We started with an NVT run at room temperature for 2 ps, followed by an NVE run of same length. Com-plete computational details can be found in previous pub-lications [17]. For the second NS4 structure, the ab initio MD simulations have been performed using Car-Parrinello MD as implemented inCPMDcode (see simulation details in
Ref. [38]).
Further, in a third step, we have calculated the vibrational frequencies and eigenmodes, as well as the Raman tensors, using a DFT scheme as provided in theQUANTUM ESPRESSO
(QE) package (version 5.4) [43]. The atomic positions have been initially relaxed using the BFGS minimizer with a fixed simulation box size setting the convergence criteria for the total energy and forces at 4 × 10⁻⁸ Ry and 10−5 Ry/a.u.,
respectively. In case of a pressure higher than 1 GPa af-ter the relaxation, the box was slightly suitably rescaled, keeping the final densities within 1.5% of the experimental value. The calculations were carried out using the GGA-PBE exchange-correlation functional [41] with Troullier-Martins norm-conserving pseudopotentials [44]. The performance of the pseudopotentials was assessed by investigating the struc-ture and vibrational properties of two crystalline phyllosil-icates, the sodium metasilicate (Na2SiO3) and natrosilite
(α-Na2Si2O5). Calculations on the crystalline compounds
were carried out using a kinetic energy cutoff of 100 Ry and Monkhorst-Pack k-point grids with a 4 × 4 × 4 and 3 × 4 × 3 resolution for the metasilicate and natrosilite, respectively. For the glasses, the same kinetic energy cutoff was used and calculations were carried out at the Ŵ point. We should note at this point that, although two different exchange-correlation functionals have been used in the ab initio MD runs, the final atomic relaxation has been carried out using PBE in all cases. Therefore, we consider that the final sets of positions used for the vibrational properties are consistent. As documented by Ganster et al. [13], the ab initio runs at the later stages of the preparation of a glass model only serve as a way to refine the short-range order and do not affect the medium-range one.
The vibrational properties (eigenfrequencies and eigen-modes) were calculated using the density functional per-turbation theory method (DFPT) as implemented in QE
TABLE I. Cell size, average values of the bond lengths (Si-BO, Si-NBO, and Na-O), and angles (Si-O-Si and O-Si-O) formed by the unit-cell atoms for Na2SiO3and α-Na2Si2O5. Average percent errors for the angles and bond lengths are given in parentheses.
Na2SiO3 Expt.a α-Na2Si2O5 Expt.b
a(Å) 10.92 10.48 6.65 6.409 b(Å) 6.34 6.07 15.83 15.422 c(Å) 4.97 4.82 5.02 4.896 Si-O-Si (◦) 139.2 133.7 162.1 160.0 144.2 138.9 (4.1) (2.6) O-Si-O (◦) 103.9 103.1 108.6 109.1 110.7 110.8 107.5 107.5 116.5 116.9 112.9 113.2 107.0 107.1 106.0 105.4 108.6 108.2 113.0 113.0 (0.1) (0.0) Si-BO (Å) 1.689 1.677 1.621 1.609 1.675 1.668 1.651 1.643 1.646 1.638 (0.6) (0.6) Si-NBO (Å) 1.606 1.592 1.590 1.578 (0.9) (0.8) Na-O (Å) 2.436 2.282 2.536 2.386 2.450 2.303 2.468 2.338 2.609 2.549 2.480 2.373 2.483 2.370 2.444 2.290 2.550 2.404 2.629 2.600 (5.3) (4.8) aReference [48]. bReference [49].
code [43,45]. All spectra for the NS3 and NS4 systems presented in the Sec. III have been averaged over the two models for the corresponding composition, after broadening the discrete spectra using Gaussians with a 20 cm−1FWHM,
unless explicitly stated. In the case of NS2, the results only concern the system prepared with the slower quench rate (i.e., 1010K/s).
III. RESULTS AND DISCUSSION A. Crystalline compounds
In Na2SiO3 and α-Na2Si2O5, the fourfold-coordinated Si
atoms are connected to two and three bridging (i.e., double-coordinated) oxygens, respectively [46,47], usually called Q2
and Q3 units (we recall that Qn species are tetrahedral
en-vironments with n = 4, 3, 2, 1, 0 BOs). Unit cells containing 12 and 36 atoms for Na2SiO3and α-Na2Si2O5 were relaxed,
with the results presented in Table I. The cell constants are predicted within 5% compared to experiment [48,49]. The intratetrahedral structural parameters are more accurately predicted than the intertetrahedral ones, whereas the largest deviations from the experimental values are observed in the case of Na-O bond lengths. The overestimation of these bond lengths is probably connected to the use of GGA/PBE approximation, as already reported in the literature [50].
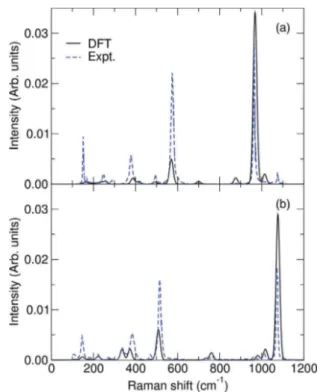
FIG. 1. Polarized Raman spectra for (a) Na2SiO3 and (b) α-Na2Si2O5. Experimental spectra are from Refs. [51,52].
The Raman spectra for the two systems are given in Fig.1. As there is a constant underestimation of the frequencies of the calculated spectra, the presented values have been multiplied by a factor of 1.04. For both crystal structures, we observe a good agreement of the band positions with respect to available experimental data [51–54], except from the weak Si-O stretching band of Na2SiO3at 1063 cm−1which is not
present in our calculations. However, the overall good descrip-tion of the spectra suggests that the chosen pseudopotentials and simulation parameters are adequate for the calculation of the spectra for the glasses.
B. Structure of the NSX glasses
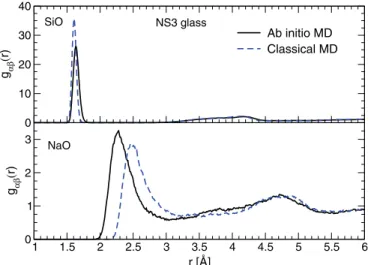
When switching from classical to ab initio MD, we have observed changes of some structural features such as the shift to smaller angles shown by the SiOSi bond angle distribution (BAD) (see Fig.2) or the shifts of the first peaks of SiO and NaO radial distribution functions (RDF) plotted in Fig.3for NS3. For the SiOSi BADs plotted in Fig.2, their average value does not strongly depend on the sodium content (see TableII), but their maximum does, as its location shifts to lower values with increasing Na content. This trend is consistent with experimental observations and is particularly apparent for the
ab initiodata [38]. For the SiO RDF, the first peak shifts to
larger values together with a broadening, which may reflect the deformation of SiO4tetrahedra bearing NBOs, known to
have shorter bond lengths with Si atoms compared to Si-BO bonds [17,32]. Concerning the Na-O RDF, Fig. 3 shows a decreasing of NaO bond lengths, with an average NaO bond length moving from 2.73 Å during the classical simulation to 2.50 Å for the ab initio trajectory. This variation improves the comparison with experimental values (see Table II), but
0 0.01 0.02 0.03 PSiOSi NS4 NS3 NS2 100 110 120 130 140 150 160 170 180 angle [o] 0 0.01 0.02 0.03 PSiOSi (a) (b) ab initio MD classical MD
FIG. 2. SiOSi BADs of the simulated NS4, NS3, and NS2 glassy samples at 300 K: (a) (Top) Extracted fromVASPab initioMD runs. (b) (Bottom) Extracted fromDL_POLYclassical MD runs.
overall it seems that, as for the crystal structures, these bond lengths are overestimated, reflecting the already mentioned trend of ab initio calculations using the GGA approximation.
In Table IIwe summarize some structural parameters of the three glass models used for the vibrational calculations (i.e., relaxed to 0 K). The amount of NBO in the structures was found to be in very close agreement to available NMR results [55–57], in all glasses, while the agreement of the
Qn species with experimental results is better for the well-polymerized NS4 glass than for NS2. Overall, one can state that the short-range structural features of our models com-pare reasonably well with experiments, but deviations exist in terms of distribution of the Qn species, and thus for the medium-range structure. This discrepancy can be attributed to the choice of the empirical potential during the initial prepa-ration of the glass models since the ab initio equilibprepa-ration at room temperature and the subsequent energy minimization produced negligible changes in the medium-range structure.
0 10 20 30 40 gαβ (r) Ab initio MD Classical MD 1 1.5 2 2.5 3 3.5 4 4.5 5 5.5 6 r [Å] 0 1 2 3 gαβ (r) SiO NaO NS3 glass
FIG. 3. Radial distribution functions for SiO and NaO pairs computed for the classical and ab initio runs, at 300 K and for NS3 glass structures.
It can be also linked to the employed high quench rate from the liquid.
It is also interesting to analyze the intertetrahedral Si-O-Si angles with respect to the Qn speciation of the two silicons. In this scope, we have averaged the corresponding values over all five glass models, wherever sufficient statistics were available, and found the largest angles being formed by
Q4-O-Q4 (144.2◦), followed by Q4-O-Q3 (143.8◦), Q4-O-Q2
(141.5◦), Q3-O-Q3 (140.1◦), and finally Q3-O-Q2 (137.3◦).
This change in the Qm-O-Qnangle could be well related with a steric effect caused by the increased amount of Na around the Qnentities when increasing the number of NBOs. We have hence calculated the average number of Na atoms around a Qn unit (i.e., the Na atoms around the four oxygens and within a sphere of radius equal to the first O-Na coordination shell), and we have found increasing values when going from Q4 to Q2, for a given composition, and when increasing the soda
content. For example, for Q3 species, we have found ≈3.8
sodiums for NS4, ≈4.4 sodiums for NS3, and finally ≈5.8 for NS2 composition. Further, by calculating the average number
TABLE II. Density, NBO percentage, and Qnspecies percentages for the NSX glasses, as well as average values of some bond lengths and Si-O-Si angle for the glass models used for vibrational calculations.
NS4 NS3 NS2
Sim. Expt. Sim. Expt. Sim. Expt.
ρ(g/cm3) 2.38 2.38a 2.40 2.43a 2.48 2.49a % NBO 21.8 23.1b 28.6 27.0b, 28.0c,28.0d 40.0 40.0b % Q1 2.2 % Q2 8.3 3.0b, 0.8e 11.8 1.0b, 2.3c2.4e, 1.4f 17.4 10.0b, 8.4f % Q3 32.3 48.0b, 50.0e 43.1 61.0b, 60.5c, 62.3e, 34.9f 58.7 79.0b, 81.0f % Q4 59.4 50.0b49.2e 45.1 38.0b37.2c35.3e 21.7 11.0b10.3f Si-O (Å) 1.627 1.617g 1.628 1.62g 1.632 1.61–1.62,h1.631i Si-BO (Å) 1.635 1.638 1.649 Si-NBO (Å) 1.574 1.581 1.587 Na-O (Å) 2.522 2.30h 2.512 2.551 2.30–2.36h Si-O-Si (◦) 143.08 142.45 143.49
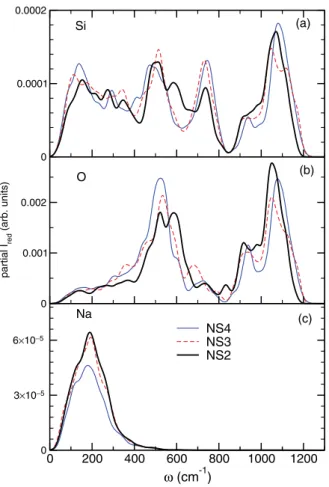
0 200 400 600 800 1000 1200 ω (cm-1) 0.0000 0.0005 0.0010 0.0015 0.0020 g( ω ) NS4 NS3 NS2 0 0.0004 gα (ω ) 0 0.0004 0.0008 gα (ω ) 0 200 400 600 800 1000 1200 ω (cm-1) 0 0.0004 0.0008 gα (ω ) Si O Na (a) (b) (c) (d)
FIG. 4. (a) Total VDOSs of the NSX glasses and partial contributions from (b) Si, (c) O, and (d) Na atoms. The total VDOSs were normalized to unity, while the partial VDOS for a given composition were normalized so that their sum gives the corresponding total VDOS.
of Na around each NBO, we have found values equal to 2.9, 3.2, and 3.4 for NS4, NS3, and NS2, respectively, similarly to previous ab initio calculations on NS4 and a sodium borosilicate glass [17,47]. Of course, this implies that more than one alkali atom is found in the vicinity of each NBO, therefore deviating from the traditional theoretical model for the structure of sodosilicates, which assumes a one-to-one correspondence.
C. Vibrational density of states
As stated in Sec. II, the dynamical matrix of each glass model was computed within the framework of DFPT, and then its diagonalization yielded the 3N eigenfrequencies ωp and their corresponding normalized 3N-component eigenvectors
e(ωp) (p = 1, 2, 3, . . . , 3N), where N is the number of atoms
in the system. The total VDOS has been then computed as
g(ω) = 1 3N − 3 3N X p=4 δ(ω − ωp). (1) The knowledge of the eigenfrequencies and eigenvectors makes possible further calculations, starting with the so-called partial VDOS corresponding to the contributions of different groups of atoms (as, for example, the species):
gα(ω) = 1 3N − 3 3N X p=4 Nα X I=1 3 X k=1 |eI,k(ωp)|2δ(ω − ωp), (2) where Nα is the number of atoms in the group labeled α and
eI,k(ωp) are the 3-components of the eigenvector e(ωp) with
the displacement of the particle I.
The total VDOSs of NS4, NS3, and NS2 glasses are shown in Fig.4alongside the partial contributions of the three species α = Si, O, Na. First, we can identify three main bands with features (position, shape, and intensity) changing when the Na content varies. The presence of three bands as well as qualitatively similar decompositions with respect to the con-tributions from the three species have been already reported in
previous theoretical studies for NS4 glass using classical and
ab initio[23,25], as well as by fully ab initio studies of more
complex silicate glasses [17,63]. For the low-frequency range below 300 cm−1, we observe an intensity increase when going
from NS4 to NS2, which is directly correlated to the intensity increase presented by the Na partial VDOSs when the Na sodium content increases [see Fig.4(d)]. We note that the Na contributions are situated only in the bottom part of the spectra below 400 cm−1, as already pointed out in previous
calcula-tions for silicates containing sodium [17,25,63]. In terms of relative intensity of the three partials, it is evident that the O contribution dominates the VDOS [see Figs. 4(b)–4(d)]. To our knowledge, the only available experimental data in order to compare the VDOS come from heat-capacity calculations and concern the lower end of the spectra [64], and show an intensity increase with increasing sodium content.
The change in the Na amount also gives rise to modifi-cations of the total VDOSs for the frequency ranges above 400 cm−1. We notice an intensity decrease with increasing
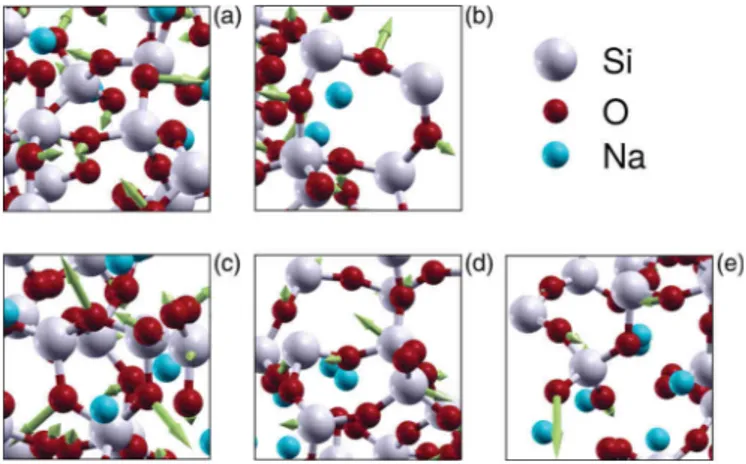
FIG. 5. Visualization of the vibrational modes at (a) 416 cm−1, (b) 481 cm−1, (c) 602 cm−1, (d) 694 cm−1, and (e) 976 cm−1for the NS4 glasses. White atoms are Si, red are O, and blue are Na. For the color version, the reader is referred to the web version of the paper.
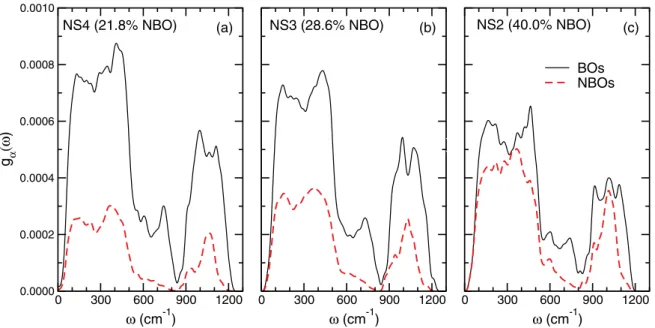
0 300 600 900 1200 ω (cm-1) 0.0000 0.0002 0.0004 0.0006 0.0008 0.0010 g α (ω ) BOs NBOs 0 300 600 900 1200 ω (cm-1) 0 300 600 900 1200 ω (cm-1) g( ω ) (a) (b) (c)
NS4 (21.8% NBO) NS3 (28.6% NBO) NS2 (40.0% NBO)
FIG. 6. Contribution to the VDOS of BO (solid lines) and NBO (dashed lines) for (a) NS4, (b) NS3, and (c) NS2.
Na concentration in the range 400–500 cm−1[see Fig.4(a)],
a feature that originates from the changes presented by both oxygen and silicon partial VDOSs [see Figs.4(b) and4(c)] and can be correlated to changes in the glass polymeriza-tion due to the modifier atoms. Further on, there is a peak pointing at ≈740 cm−1which is strongly affected by the Na
content: its intensity decreases with increasing Na amount,
alongside a slight shift to lower frequencies. Again, we can link these variations to changes shown by both Si and O partial VDOS, and especially the ones of the silicons with a decrease of the maximum intensity of 40% between NS4 and NS2 samples, as shown in Fig. 4(b). Finally, the three VDOSs are characterized by a broad band approximatively above 850 cm−1 and up to 1250 cm−1, with contributions
0.0000 0.0004 0.0008 0.0012 grock (ω ) NS4 NS3 NS2 0.0000 0.0004 0.0008 0.0012 gbend (ω ) 0 200 400 600 800 1000 1200 ω (cm-1) 0.0000 0.0004 0.0008 0.0012 gstretch (ω ) (a) (b) (c) Rocking Si Stretching O O X Si Si Si Bending Si Si O 0.2 0.4 0.6 0.8 1.0 NS4 NS3 NS2 0.2 0.4 0.6 0.8 1.0 relative contributions 0 200 400 600 800 1000 1200 ω (cm-1) 0.0 0.2 0.4 0.6 0.8 1.0 (d) (e) (f) Rocking Si Stretching O O X Si Si Si Bending Si Si O
FIG. 7. Frequency and composition dependencies of the (a) rocking, (b) bending, and (c) stretching components of BO modes in the three NSX glasses (X = 4, 3, 2). (d)–(f) Show the relative contributions of the rocking, bending, and stretching motions, respectively, with respect to the total VDOS.
from Si and O atoms which shift to lower frequencies with increasing Na content [see Figs. 4(a)–4(c)]. This band is of course reminiscent of the so-called high-frequency band in pure silica, and its softening due to the silicate network depolymerization has been previously reported in ab initio studies for other silicates [16,17,63]. The assignment of this band and the relation with the network connectivity will be discussed in details in the next subsections.
We can initially proceed to a visual inspection of the vibrational modes (videos are provided as Supplemental Ma-terial [65]). The nature of the vibrations was found to be qualitatively similar in all three glasses under study. Figure5
depicts some characteristic snapshots taken from the NS4 models and visualized usingXCRYSDEN[66]. For the low end
of the VDOS we observe mainly motions of rigid tetrahedra together with neighboring sodium atoms. Further, for increas-ing frequencies up to 350 cm−1, we first see dangling and
then stretching motions of the NBO-Na bonds. At the same time, the Si-O-Si bridges exhibit a combined rocking/bending motion [Fig.5(a)]. At higher frequencies we can also observe characteristic collective motions like the breathing modes of 4-member and 3-member silicate rings, shown in Figs.5(b)
and5(c). In the region 700–800 cm−1[see Fig.5(d)], we still
have the mixed rocking/bending motions of Si-O-Si bridges but we equally notice an increased contribution stemming from Si atoms, which corroborates the above-discussed fea-tures of the Si partial VDOS. At a lower extent, we can still identify the presence of a mixed motion on NBOs combining a stretching of the Si-NBO bond together with a motion orthogonal to the Si-NBO direction. Finally, in the high-frequency band above 850 cm−1 [see Fig.5(e)], we mostly
observe the stretchings of both Si-BO and Si-NBO bonds, as previously reported for a NS4 glass [23] within a classical approach or for magnesiosilicate glasses [16] within a DFT calculation.
After obtaining a qualitative overview of the vibrational modes of the NSX glasses, we can proceed to a more quantitative analysis. As mentioned earlier, the most intense contribution to the VDOS stems from the O atoms. In Fig.6, we present the decomposition of the O partial VDOS with respect to BOs and NBOs contributions. The results naturally show the relative decrease of the BO contribution in the entire spectrum, as the glasses become more depolymerized, and the simultaneous increase of the NBO contribution. We notice that around 700 cm−1the BO contribution remains dominant,
even in the case of the NS2 glass, and, as we will see below, the vibrational modes in this region of the spectra result from a superposition of rockings/bendings of the Si-O-Si bridgings. We have further analyzed the vibrational modes of the Si-O-Si bridges according to the decomposition of the BO motions into rocking, bending, and stretching components. For each mode, we have calculated the relative displacement of the BO with respect to its two neighboring Si atoms and projected it over three orthogonal directions [67]: the rocking direction orthogonal to the SiOSi plane, the bending direction along the bisector of the Si-O-Si angle, and finally the stretch-ing direction orthogonal to the two previous ones. The corre-sponding partial VDOS are presented in Figs.7(a)–7(c), while Figs. 7(d)–7(f) show the relative contributions of rocking, bending, and stretching motions, respectively, with respect to
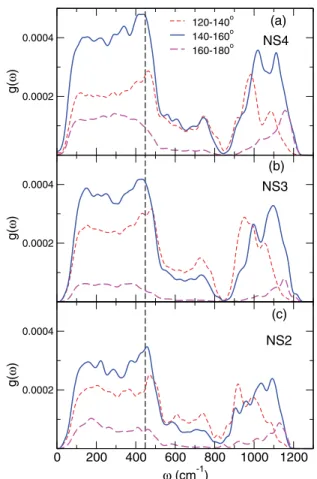
0.0002 0.0004 g( ω ) 120-140o 140-160o 160-180o 0.0002 0.0004 g( ω ) 0 200 400 600 800 1000 1200 ω (cm-1) 0.0002 0.0004 g( ω ) (a) (b) (c) NS4 NS3 NS2
FIG. 8. Decomposition of the BOs contribution with respect to their Si-BO-Si angle for (a) NS4, (b) NS3, and (c) NS2.
the total VDOS. The data plotted in Fig. 7 show a mix of rocking and bending motions in the low- and mid-frequency ranges, with the former being more intense in the region between 100–400 cm−1, whereas the latter are relatively more
pronounced between 500–800 cm−1. On the contrary, the
high-frequency band contains essentially stretching modes of BO. Regarding the effect of the glass composition, the increase of Na amount when going from NS4 to NS2 leads to an increase of the contributions from rocking and bending modes at the lower part of the VDOS (below 700 cm−1). At
the same time, their intensities for the band around 750 cm−1
decrease, and also shift to lower frequencies [the effect being more pronounced for the relative contributions, as shown in Figs. 7(d) and 7(e)]. The increase of Na content has also a limited effect on the intensity of the high-frequency band which only shifts to lower frequencies [see Fig.7(e)]. Similar decompositions of the oxygen motions have been previously carried out for pure silica described using an effective pair potential [26,67] or within an ab initio framework [10,68], as well as for the NS4 glass using a harmonic potential [23]. These studies have revealed the same strong dependence of BO motions with respect to the frequency, and a qualitative agreement with respect to the relative ratios between the three contributions.
A decomposition of the BO partial VDOS according the Si-BO-Si angle can link the vibrational properties with the ge-ometry of the glass matrix. Such a decomposition is presented in Fig. 8, where we see that the characteristics of the BO
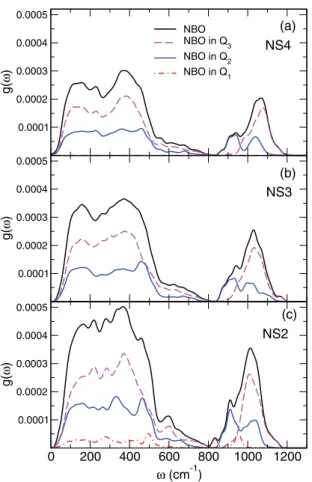
0.0001 0.0002 0.0003 0.0004 0.0005 g( ω ) NBO NBO in Q3 NBO in Q2 NBO in Q1 0.0001 0.0002 0.0003 0.0004 0.0005 g( ω ) 0 200 400 600 800 1000 1200 ω (cm-1) 0.0001 0.0002 0.0003 0.0004 0.0005 g( ω ) (a) (b) (c) NS4 NS3 NS2
FIG. 9. Contributions to the NBO partial VDOS of NBOs on Q2 and Q3species for (a) NS4, (b) NS3, and (c) NS2.
contributions clearly change with respect to their Si-BO-Si angle. The partial VDOS of BOs with angles between 140◦ and 160◦ dominates the partial VDOS of all BOs,
and then, to a lower extent, comes the contribution of BOs with angles between 120◦ and 140◦. The latter present a
slightly higher intensity only for frequencies above 600 cm−1
and below 850 cm−1. Finally, we can identify the
low-est contribution coming from BOs belonging to open Si-BO-Si angles (160◦–180◦). For these BOs, there is
al-most no mode in the frequency range between 600 and 850 cm−1. The relative intensities of these three types of
BOs hint the relative concentrations of BOs with angles inside the given ranges, with the most probable Si-O-Si angles having values between 140◦ and 160◦. A notable
effect of the Si-BO-Si angle is located around 450–500 cm−1,
where we observe an upshift of the smaller angles. The inverse effect is present in the high-frequency band, where a decrease
of the Si-O-Si angle produces a downshift of the average contribution to the VDOS. In this case, the downshift can be straightforwardly linked to stretching in Qn species since, as will be discussed in Sec.III B, smaller Si-O-Si angles are expected as the amount of NBOs on the Si atoms increases.
Finally, we have investigated the contribution from the NBOs by decomposing it with respect to the type of Qn species that they are linked to. Figure 9 shows the contri-butions to the VDOS from NBOs on Q2 and Q3 entities.
We remark that NBOs on Q2 demonstrate a significantly
higher intensity, compared to those on Q3for all three glasses.
However, the most important difference between the two cases can be identified in the high-frequency band, where in all systems we observe a bimodal contribution for NBOs on Q2
species and an overlapping peak for Q3. In the former case,
the peak centers were found to be at the same frequencies, 920 ± 10 cm−1and 1020 ± 10 cm−1, whereas the maximum
of the Q3 contribution shifts from 1060 to 1010 cm−1when
going from NS4 to NS2. We should also note that we do not comment on the contribution to the VDOS from NBOs on Q1
entities since only one exists in the NS2 system and therefore good statistics are not ensured.
D. Raman spectra
The Raman spectra have been obtained by applying uni-form electric fields and calculating the second-order deriva-tives of the electron density matrix [19]. The Raman suscepti-bility for each mode p is given by
Rp i j= √ V N X I=1 3 X k=1 ∂χi j ∂RI,k eI,k(ωp) √ MI , (3)
where V is the system volume, i, j, k = 1, 2, 3, MI the atom
Imass, while eI,k(ωp) is the 3-components vector defined in
Eq. (2). In Eq. (3), the Raman tensor ∂χi j
∂RI,k is given by ∂χi j ∂RI,k = 1 V ∂2FI,k ∂EiEj ¯ ¯ ¯ ¯ E =0 (4) with FIγthe force exerted on atom I and E the applied electric field. For the polarized Raman spectra (VV ), the intensity for each mode p is given by
IV Vp = α2p+4τ 2
p
45 , (5)
where αpand τpare the trace and anisotropy of the suscepti-bility: αp= Rp 11+ R p 22+ R p 33 3 , (6) τp2 = ¡Rp 11− R22p ¢2 +¡Rp22− R33p ¢2 +¡R33p − Rp11 ¢2 + 6£¡R12p ¢2 +¡R13p ¢2 +¡Rp23 ¢2¤ 2 . (7)
The depolarized Raman spectra (V H) have been calculated by multiplying the VV spectra by the depolarization ratio ρp
dep:
IV Hp = ρdepp IV Vp with ρdepp = 3τ
2
p 45α2
p+ 4τp2
0 300 600 900 1200 Raman shift (cm-1) 0 0.001 0.002 0.003 0.004 0.005 0.006 0.007 I red (arb. units) NS4 exp. NS4 calc. 0 300 600 900 1200 Raman shift (cm-1) NS3 exp. NS3 calc. 0 300 600 900 1200 Raman shift (cm-1) NS2 exp. NS2 calc.
VV spectra VV spectra VV spectra
0 300 600 900 1200 Raman shift (cm-1) 0 0.001 0.002 0.003 0.004 I red (Arb. units) NS4 exp. NS4 calc. 0 300 600 900 1200 Raman shift (cm-1) NS3 exp. NS3 calc. 0 300 600 900 1200 Raman shift (cm-1) NS2 exp. NS2 calc. VH spectra VH spectra VH spectra
FIG. 10. Polarized (top) and depolarized (bottom) calculated Raman intensities for the three glasses (solid lines), alongside experimental results (dashed lines) [69]. The experimental spectra are the reduced ones with respect to the measured intensities (see text for details). The calculated as well as the experimental spectra are normalized to unity.
In order to decompose the Raman spectra into partial contributions of a specific group of atoms, we have written the intensity of mode p as a sum of three terms:
IV Vp =X α
IV V,αp + IV V,p comp+ IV V,p over, (9) where only the atoms of type α are considered in Eq. (3) prior to the calculation of the partial intensities Ip
V V,α using Eqs. (5)–(7) [i.e., α = Si, O, Na or α = BO, NBO). The
second and third terms are, respectively, the contributions from the remaining atoms in the system (i.e., the ones of Si and Na if α = BO, NBO) and the overlapping (or interference) terms, due to the squared terms in Eqs. (5)–(7). As already pointed out by Umari and Pasquarello for the case of pure SiO2[68], even if the sum of the partial Raman spectra does
not recover the total spectrum, as in the case of the VDOS, it is reasonable to assume that these partial spectra give a measure of the relative ones.
The VV and V H calculated Raman spectra of the glasses under study are given in Fig.10and compared to recent ex-perimental results [69]. The calculated spectra result directly from the Gaussian broadening of the discrete intensities [see Eqs. (5) and (8)], while the experimental ones have been obtained by multiplying the experimentally measured inten-sities by ω/[n(ω) + 1], where n(ω) = 1/[exp (ω/kBT) − 1)] is the Bose factor, kBthe Boltzmann constant, and T = 300 K. In the Supplemental Material (see Fig. S1) [65], we also provide a comparison between the calculated spectra and the experimental ones, using an alternate definition for the reduced intensities. In that case, the latter have been multi-plied by 1/[ω(n(ω) + 1)], which is equivalent to dividing the calculated spectra in Fig.10by ω2.
For either VV and V H spectra, the positions of the main bands are well reproduced by the calculated spectra but there exist discrepancies in terms of band intensities. If we consider
0 0.0001 0.0002 0 0.001 0.002 partial I red (arb. units) 0 200 400 600 800 1000 1200 ω (cm-1) 0 3×10⁻⁵ 6×10⁻⁵ NS4NS3 NS2 Si O Na (a) (b) (c)
FIG. 11. Partial contributions of three constituent species: sili-cons (a), oxygens (b), and sodiums (c).
the band between 500–600 cm−1in the VV spectra, its form
and intensity is well reproduced for the highly polymerized (high silica content) NS4 composition. As it will be discussed later, this band contains the signal from Si-O-Si vibrations, i.e., the BO atoms. The calculated band is broader with respect to the experimental one and it is not narrowing with increasing
sodium content. This indicates that there are differences in the local and medium range structures present in our glass models and those in the real glasses. These differences are likely due to the small size of our glass models, which in the case of NS2 contains considerably less BOs and therefore poorer statistics compared to NS4. Further, the discrepancies for the high-frequency band (900–1200 cm−1), corresponding to the
response from the Qnspecies, are due to the fact that observed
Qndistributions are not exactly reproduced in our models. For the V H spectra, we see a broad band below 600 cm−1(see
Fig. S1 in Supplemental Material [65]), which was assigned to two types of alkali motion [69], one at ≈175 cm−1 and
the second one at ≈350 cm−1. In spite of the small size of
our models, we can identify in the calculated V H spectra the presence of small peak at ≈350 cm−1showing an increasing
intensity with increasing sodium content.
As for the pure VDOS, we have initially decomposed the
V V spectra with respect to the contributions of the three
species Si, O, and Na, and present the results in Fig.11. The partial contributions stemming from the O atoms are by far the most significant, as it was already noticed for pure silica [68], as well as in the partial VDOS of our three sodosilicates (see Fig.4). This trend is far more substantial in the polarized Ra-man spectra. Consequently, there is strong similarity between the form of the oxygen contributions plotted in Fig.11(b)and the total VV Raman spectra shown in Fig.10. With increasing sodium content, it is the oxygen contribution exhibiting the most noticeable changes, namely, a shift to the right of the band between 400–700 cm−1and a small shift to the left of
the high-frequency band.
Due to the prominent contribution of oxygen vibrations to the Raman spectra, we have further considered three decompositions: according to their species (BO or NBO), the bond angle of the Si-O-Si bridgings, and the contribution of the NBOs to the high-frequency band. The decomposition according to the contributions from BOs and NBOs is given in Fig. 12. We initially point out the strong contribution of the NBOs to the high-frequency, or Qn, band. This happens
0 300 600 900 1200 ω (cm-1) 0.0000 0.0005 0.0010 0.0015 0.0020 0.0025 0.0030 partial I red (arb. units) BOs NBOs 0 300 600 900 1200 ω (cm-1) 0 300 600 900 1200 ω (cm-1) g( ω ) (a) (b) (c)
NS4 (21.8% NBO) NS3 (28.6% NBO) NS2 (40.0% NBO)
in spite of their smaller concentration with respect to the BOs in any of the three compositions, suggesting that they are the most Raman active in this band. The intensity of these modes largely dominates the one of the oxygens in Si-O-Si bridges, that one finds in the pure silica glass. The vibrations of NBOs then define the shape and intensity of this Raman band, and we expect that they are predominantly of stretching type [23]. For the rest of the spectra (below 800 cm−1), the
NBOs present a distinct signal whose intensity increases with increasing sodium content, and surpasses the one of BOs in the case of NS2.
As for BOs, they present a significant band between 400– 600 cm−1, particularly for low sodium content. Taking into
account the decomposition of the pure VDOS with respect to rocking, bending, and stretching motions of the Si-O-Si bridges (see Fig. 7), the Raman BO vibrations could be assigned either to rocking or bending motions, or both. However, for pure SiO2, Umari and Pasquarello [68] have
shown that the VV spectrum below 900 cm−1is dominated
by bending motions, while the rocking contribution is almost suppressed, in spite of their large weight in the pure VDOS. This conclusion likely holds also for sodosilicate composi-tions. It is supported by the fact that the relative contribu-tions of the rocking, bending, and stretching vibracontribu-tions [see Figs. 7(d)–7(f)] do not seem to show a strong dependence on sodium content, on one side, while their frequency depen-dence also presents a close resemblance to the one reported for
a-SiO2(see Ref. [68]). Finally, if we consider the contribution
of the BOs to the Qn band, our calculations show that the presence of sodium leads to the suppression of the double-peak feature, well known for pure SiO2glass.
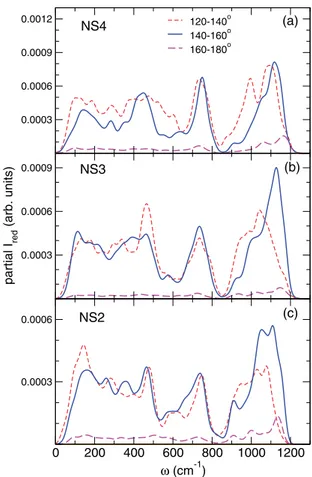
The analysis of the polarized Raman spectra according to the Si-O-Si angle can be considered, to a certain ex-tent, as a further decomposition of the bridging oxygen contribution with respect to its local environment. As for the pure VDOS, we have considered three angular ranges, (120◦–140◦, 140◦–160◦, and 160◦–180◦, respectively) and
the resulting partial contributions are given in Fig. 13. In the low- and mid-frequency bands (below 850 cm−1) we
observe that the partial contribution of the small angles, 120◦–140◦, has almost the same weight as the one of larger
angles, between 140◦ and 160◦, and this despite their
per-centage is smaller than the one of larger angles. These quite similar contributions to the Raman spectra may arise from the variation of the Raman coupling factor which linearly decreases with increasing Si-O-Si angle (see Fig. S2 in Supplemental Material [65] as well as Refs. [4,70]). For the high-frequency band, these two main contributions show a stronger overlap with respect to the ones found in the pure VDOS. The contribution of BOs with angles between 140◦–160◦is rather asymmetric and seems to become stronger
with increasing Na content for the highest frequencies, with respect to the one of BOs with angles smaller than 140◦.
Finally, we note that the contribution of the very large an-gles, above 160◦, is almost negligible below 850 cm−1, and
seems to slightly increase with increasing frequency in the Qn band.
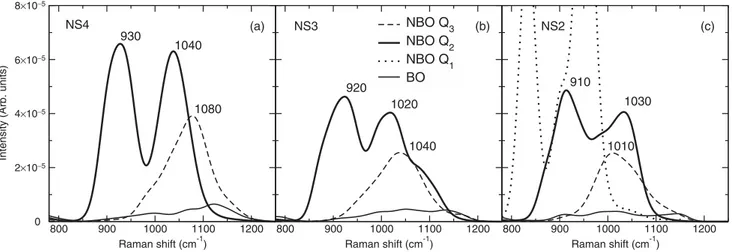
An investigation of the per-atom NBO contributions in the high-frequency band, given in Fig. 14, shows that the
Qncontributions are significantly overlapping. Regarding the
0.0003 0.0006 0.0009 0.0012 120-140o 140-160o 160-180o 0.0003 0.0006 0.0009 partial I red (arb. units) 0 200 400 600 800 1000 1200 ω (cm-1) 0.0003 0.0006 (a) (b) (c) NS4 NS3 NS2
FIG. 13. Contributions to the polarized Raman spectra of the BO atoms taking into account the value of the Si-O-Si bond angle for (a) NS4, (b) NS3, and (c) NS2.
NBOs on Q1 species, the poor statistics caused by the single
case observed in the NS2 sample makes us refrain from further comments. In the case of NBOs on Q2species, we observe a
well-defined doublet structure with maxima around 920 and 1030 cm−1, whose position does not seem to be strongly
affected by composition. The most probable reason for the ap-pearance of the doublet is the presence of neighboring effects from different Qn species linked to Q2 ones. However, our
analysis with respect to the populations of Qn neighbors did not reveal a clear correlation. As for the NBOs on Q3species,
they exhibit a unimodal distribution whose maximum shifts from 1080 cm−1in NS4 to 1030 cm−1in NS2. The particular
form of the NBO contributions for Q2and Q3species has been
first pointed out by Zotov et al. for NS4 [23] and is found to be in remarkable agreement to the more recent experimental works by Malfait et al. for sodosilicates [59] and Woelffel
et al.for soda-lime silicates [71]. The Q4species gives rise to
a very broad band ranging from 900 to 1200 cm−1, underneath
the Q2, Q3 contributions. The strong overlaps between the
different Qnentities, as well as the form of the individual con-tributions, indicate that the quite common decomposition of experimental data with Gaussian peaks should be considered cautiously.
E. Comparison of the NS2 samples
It could be argued that the bimodal distribution of the Q2
800 900 1000 1100 1200 Raman shift (cm-1)
0
Intensity (Arb. units)
800 900 1000 1100 1200 Raman shift (cm-1) 800 900 1000 1100 1200 Raman shift (cm-1) NBO Q3 NBO Q2 NBO Q1 BO (a) (b) (c) 930 1040 1080 920 1020 1040 910 1030 1010 NS4 NS3 NS2 8×10⁻⁵ 6×10⁻⁵ 4×10⁻⁵ 2×10⁻⁵
FIG. 14. Per-atom contribution to the Raman spectra of NBOs on different Qnspecies for (a) NS4, (b) NS3, and (c) NS2. The per-atom contribution of BOs is also given for comparison. The maxima of the contributions for Q2and Q3species are noted on the plots.
low total number of these units which lead to poor statistics. In order to clarify this point, we present in Fig. 15the total polarized Raman spectra for the two NS2 systems prepared with a quench rate of 1011 K/s (henceforth named model I
and model II), alongside the one with 1010 K/s which has
already been discussed. Models I and II have very similar percentages of Q2 and Q3 species, 26.1% Q2 and 28.3% Q3
for model I, 24.4% Q2 and 31.1% Q3 for model II, which
reflects to an almost identical structure of the Qnband. On the contrary, the NS2 glass prepared with the 1010 K/s quench
rate has a considerably lower amount of Q2 entities, hence,
the lower signal around 950 cm−1. Furthermore, the partial
contributions from NBOs on Q2 (inset of Fig.15) exhibit a
clearly bimodal distribution for all three systems, suggesting that the statistics are satisfactory. Small differences in the form of the distribution and the positions of the maxima are expected to derive from slightly different local environments around the Q2units. The comparison between the three NS2
models also corroborates the relatively high cross section from the Q2species since a decrease of approximately 8% in their
0 200 400 600 800 1000 1200 Raman shift (cm-1) 0.000 0.001 0.002 0.003 0.004 0.005
Intensity (Arb. units)
1011 K/s (I) 1011 K/s (II) 1010 K/s
800 900 1000 1100 1200
Q2 Q3
FIG. 15. Polarized Raman spectra of the three NS2 samples obtained with different quench rates. Inset: total contribution from NBOs on Q2and Q3species for the three models.
population leads to an almost 50% intensity decrease of the 950 cm−1peak.
Additionally, the similar forms and positions of the differ-ent contributions for all three models indicate that the accurate prediction of the form of the Qnband is principally a question of obtaining the correct distributions of the Qn species in the computational models and that the approximations within the DFT calculations are of lesser overall importance. Further refinement of the glass preparation protocols would open the way for a systematic modeling of the Raman spectra for sili-cate glasses and a rigorous interpretation of experimental data.
IV. CONCLUSION
We have presented in this work the investigation of the vibrational spectra VDOS and Raman for three sodosilicate glasses. The visualization of the vibrational modes has been used to make an initial analysis in order to show that the experimentally predicted modes are reproduced in the calcu-lations. The per-species decomposition of the VDOS revealed the relatively high contribution from O atoms in the whole frequency range, and the contribution of the Na atoms at low frequencies, typically below 400 cm−1. The mode analysis of
the Si-O-Si bridges has shown that the vibrations up to 800 cm−1 are of rocking and bending type, whereas above that
frequency they are essentially stretchings. The average con-tributions of the bridgings to the VDOS seems to be affected by the angle formed by the three atoms, with a slight upshift around 500 cm−1and a downshift at the high-frequency band
as the angle becomes smaller. Concerning the high-frequency band, the results reveal important overlaps between NBO contributions in Q2 and Q3 species, as well as with those of
the BOs.
The Raman spectra reproduce well the experimental band positions, whereas the calculated intensities show some devi-ations. We have shown that this is due to the limited system size and the prediction of the Qn species distribution by the classical potential which was used to quench the glasses from the melt. The calculation of the Raman response by Si-O-Si bridges has shown that large angles have a particularly flat contribution to the lower and middle parts of the spectra while,
similarly to the VDOS, and that relatively small angles exhibit an upshift around 500 cm−1. The calculation of the BO and
NBO partials to the Raman spectra clearly shows that the form of the Qnband is defined by the latter. The further analysis of the NBOs in terms of their local environment shows a bimodal contribution with well-defined maxima for those connected to
Q2 and a highly overlapping Q3 peak. The fact that the BO
partial is also overlapping and spans the entire width of the
Qnband indicates that one has to be particularly prudent when
deconvoluting experimental spectra with the use of simple functions.
ACKNOWLEDGMENTS
D.K. would like to thank CEA for the financial sup-port. This work was granted access to the HPC resources of TGCC/CINES/IDRIS under the allocation x2016097572 attributed by GENCI (Grand Equipement National de Calcul Intensif).
[1] D. R. Neuville, D. de Ligny, and G. S. Henderson,Rev. Mineral. Geochem. 78,509(2014).
[2] A. Yadav and P. Singh,RSC Adv. 5,67583(2015).
[3] S. N. Taraskin and S. R. Elliott, Phys. Rev. B 55, 117
(1997).
[4] L. Giacomazzi, P. Umari, and A. Pasquarello,Phys. Rev. B 79,
064202(2009).
[5] M. Thomas, M. Brehm, R. Fligg, P. Vöhringer, and B. Kirchner,
Phys. Chem. Chem. Phys. 15,6608(2013).
[6] M. Benoit and W. Kob,Europhys. Lett. 60,269(2002). [7] L. Huang and J. Kieffer, Molecular Dynamics Simulations of
Disordered Materials(Springer, Berlin, 2015), pp. 87–112. [8] J. Sarnthein, A. Pasquarello, and R. Car, Science 275, 1925
(1997).
[9] A. Pasquarello and R. Car,Phys. Rev. Lett. 80,5145(1998). [10] A. Pasquarello, J. Sarnthein, and R. Car,Phys. Rev. B 57,14133
(1998).
[11] L. Giacomazzi, P. Umari, and A. Pasquarello,Phys. Rev. B 74,
155208(2006).
[12] L. Giacomazzi and A. Pasquarello,J. Phys.: Condens. Matter
19,415112(2007).
[13] P. Ganster, M. Benoit, J.-M. Delaye, and W. Kob,Mol. Simul.
33,1093(2007).
[14] A. Tilocca,Phys. Rev. B 76,224202(2007).
[15] F. Pietrucci, S. Caravati, and M. Bernasconi,Phys. Rev. B 78,
064203(2008).
[16] G. Spiekermann, M. Steele-MacInnis, P. M. Kowalski, C. Schmidt, and S. Jahn,Chem. Geol. 346,22(2013).
[17] L. Pedesseau, S. Ispas, and W. Kob,Phys. Rev. B 91,134201
(2015);91,134202(2015).
[18] B. Bhattarai and D. A. Drabold,J. Non-Cryst. Solids 439,6
(2016).
[19] M. Lazzeri and F. Mauri,Phys. Rev. Lett. 90,036401(2003). [20] P. Umari and A. Pasquarello, Diam. Relat. Mater. 14, 1255
(2005).
[21] M. W. Wolkenstein, C. R. Acad. Sci. URSS 30, 791 (1941). [22] R. Alben, D. Weaire, J. E. Smith, Jr., and M. H. Brodsky,Phys.
Rev. B 11,2271(1975).
[23] N. Zotov, I. Ebbsjö, D. Timpel, and H. Keppler,Phys. Rev. B
60,6383(1999).
[24] A. Rahmani, M. Benoit, and C. Benoit,Phys. Rev. B 68,184202
(2003).
[25] S. Ispas, N. Zotov, S. De Wispelaere, and W. Kob,J. Non-Cryst. Solids 351,1144(2005).
[26] N. S. Shcheblanov, B. Mantisi, P. Umari, and A. Tanguy,
J. Non-Cryst. Solids 428,6(2015).
[27] A. Putrino and M. Parrinello, Phys. Rev. Lett. 88, 176401
(2002).
[28] F. Bouyer, G. Geneste, S. Ispas, W. Kob, and P. Ganster,J. Solid State Chem. 183,2786(2010).
[29] A. Tilocca and N. H. de Leeuw, J. Mater. Chem. 16, 1950
(2006).
[30] M. Corno and A. Pedone,Chem. Phys. Lett. 476,218(2009). [31] M. Benoit, S. Ispas, P. Jund, and R. Jullien,Eur. Phys. J. B 13,
631(2000).
[32] S. Ispas, M. Benoit, P. Jund, and R. Jullien,Phys. Rev. B 64,
214206(2001).
[33] D. Donadio, M. Bernasconi, and F. Tassone,Phys. Rev. B 70,
214205(2004).
[34] S. Ispas, T. Charpentier, F. Mauri, and D. R. Neuville, Solid State Sci. 12,183(2010).
[35] B. Guillot and N. Sator,Geochim. Cosmochim. Acta 71,4538
(2007).
[36] N. P. Bansal and R. H. Doremus, Handbook of Glass Properties (Academic, New York, 1986).
[37] I. Todorov, W. Smith, K. Trachenko, and M. T. Dove,J. Mater. Chem. 16,1911(2006).
[38] B. Hehlen, D. R. Neuville, D. Kilymis, and S. Ispas,J. Non-Cryst. Solids 469,39(2017).
[39] G. Kresse and J. Furthmüller,Phys. Rev. B 54,11169(1996). [40] G. Kresse and J. Furthmüller, Comput. Mater. Sci. 6, 15
(1996).
[41] J. P. Perdew, K. Burke, and M. Ernzerhof,Phys. Rev. Lett. 77,
3865(1996).
[42] J. P. Perdew, A. Ruzsinszky, G. I. Csonka, O. A. Vydrov, G. E. Scuseria, L. A. Constantin, X. Zhou, and K. Burke,Phys. Rev. Lett. 100,136406(2008).
[43] P. Giannozzi, S. Baroni, N. Bonini, M. Calandra, R. Car, C. Cavazzoni, D. Ceresoli, G. L. Chiarotti, M. Cococcioni, I. Dabo, A. Dal Corso, S. de Gironcoli, S. Fabris, G. Fratesi, R. Gebauer, U. Gerstmann, C. Gougoussis, A. Kokalj, M. Lazzeri, L. Martin-Samos et al.,J. Phys.: Condens. Matter 21,395502
(2009).
[44] N. Troullier and J. L. Martins,Phys. Rev. B 43,1993(1991). [45] S. Baroni, S. De Gironcoli, A. Dal Corso, and P. Giannozzi,
Rev. Mod. Phys. 73,515(2001).
[46] T. M. Clark, P. J. Grandinetti, P. Florian, and J. F. Stebbins,
J. Phys. Chem. B 105,12257(2001).
[47] T. Charpentier, S. Ispas, M. Profeta, F. Mauri, and C. Pickard,
J. Phys. Chem. B 108,4147(2004).
[48] W. S. McDonald and D. W. J. Cruickshank,Acta Crystallogr.
[49] A. K. Pant and D. W. J. Cruickshank,Acta Crystallogr., Sect. B
24,13(1968).
[50] Y. Ishii, M. Salanne, T. Charpentier, K. Shiraki, K. Kasahara, and N. Ohtori,J. Phys. Chem. C 120,24370(2016).
[51] P. Richet, B. O. Mysen, and D. Andrault,Phys. Chem. Miner.
23,157(1996).
[52] J. You, G. Jiang, and K. Xu, J. Non-Cryst. Solids 282, 125
(2001).
[53] S. Brawer and W. B. White,J. Chem. Phys. 63,2421(1975). [54] M. Kato, T. Shigeno, T. Kimura, and K. Kuroda,Chem. Mater.
16,3224(2004).
[55] H. Maekawa, T. Maekawa, K. Kawamura, and T. Yokokawa,
J. Non-Cryst. Solids 127,53(1991).
[56] F. Angeli, O. Villain, S. Schuller, S. Ispas, and T. Charpentier,
Geochim. Cosmochim. Acta 75,2453(2011).
[57] S. K. Lee, Y. Fei, G. D. Cody, and B. O. Mysen,Geophys. Res. Lett. 30,1845(2003).
[58] L. Olivier, X. Yuan, A. N. Cormack, and C. Jäger,J. Non-Cryst. Solids 293,53(2001).
[59] W. J. Malfait, V. P. Zakaznova-Herzog, and W. E. Halter,Am. Mineral. 93,1505(2008).
[60] G. S. Henderson,J. Non-Cryst. Solids 183,43(1995).
[61] G. N. Greaves, A. Fontaine, P. Lagarde, D. Raoux, and S. J. Gurman,Nature (London) 293,611(1981).
[62] M. Misawa, D. L. Price, and K. Suzuki,J. Non-Cryst. Solids 37,
85(1980).
[63] A. Tilocca and N. H. de Leeuw,J. Phys. Chem. B 110,25810
(2006).
[64] N. F. Richet,Physica B: Condens. Matter 404,3799(2009). [65] See Supplemental Material athttp://link.aps.org/supplemental/
10.1103/PhysRevB.99.054209, containing some videos corre-sponding to atomic vibrations at selected frequencies.
[66] A. Kokalj,Comput. Mater. Sci. 28,155(2003).
[67] S. N. Taraskin and S. R. Elliott, Phys. Rev. B 56, 8605
(1997).
[68] P. Umari and A. Pasquarello, J. Phys.: Condens. Matter 15,
S1547(2003).
[69] B. Hehlen and D. R. Neuville,J. Phys. Chem. B 119, 4093
(2015).
[70] P. Umari, X. Gonze, and A. Pasquarello,Phys. Rev. Lett. 90,
027401(2003).
[71] W. Woelffel, C. Claireaux, M. J. Toplis, E. Burov, É. Barthel, A. Shukla, J. Biscaras, M.-H. Chopinet, and E. Gouillart,J. Non-Cryst. Solids 428,121(2015).
![FIG. 10. Polarized (top) and depolarized (bottom) calculated Raman intensities for the three glasses (solid lines), alongside experimental results (dashed lines) [ 69 ]](https://thumb-eu.123doks.com/thumbv2/123doknet/2970038.82474/10.892.157.746.125.776/polarized-depolarized-calculated-intensities-glasses-alongside-experimental-results.webp)