25 © 2002 British Society of Animal Science
Prediction of carcass lean content by real-time ultrasound in Pietrain
and negative stress Pietrain
I. A. K. Youssao†, V.
Verleyen and P. L. Leroy
University of Liege, Faculty of Veterinary Medicine, Biostatistics and Animal Selection, 20 Bd de Colonster, B 43, 4000 Liege, Belgium
† E-mail: iyoussao@student.ulg.ac.be
Abstract
Real-time ultrasound data of backfat thickness, longissimus muscle depth and longissimus area were carried out on 335 pigs (164 gilts and 171 barrows) using the Pie Medical Scanner 200 equipped with an ASP-18 probe and 3·5 MHz to predict carcass lean content in positive stress Pietrain (TT) and negative stress Pietrain (CC or CT). They were given food ad libitum and slaughtered at an average age of 213 days and an average weight of 101 kg. The day before slaughter, longitudinal and transverse images were taken at the last rib. After slaughter, the lean meat content was estimated by a CGM (capteur gras-maigre) equipped with an 8-mm diameter Sydel probe. The carcass lean proportion was higher in homozygote TT than homozygote CC and heterozygote CT individuals (P < 0·05). Gilts had more lean meat than barrows (P < 0·05). The correlation between the lean meat proportion and ultrasound backfat thickness (UBFT) or ultrasound longissimus muscle depth (ULMD) respectively was moderate. The prediction of lean meat proportion using UBFT, ULMD and ULMA gave an R2 which varied from
0·35 to 0·79. Real-time ultrasound is a tool that could potentially be used to predict the composition of pig carcasses before slaughter particularly if measurements can be taken with a higher degree of accuracy than at present.
Keywords:Pietrain, halothane, ultrasound, longissimus, backfat, lean content.
Introduction
In European Union countries (EU), the market value of pig carcasses depends on the harvest weight and lean meat content of the carcass. The lean meat proportion of pork carcasses is thus classified according to harmonized European Union standards (SEUROP). Every country in the European Union has adapted its regulation to the EU reference method for grading pig carcasses. Classification of pork carcasses in The Netherlands is based on lean meat proportion, obtained with an optical probe (Hennessy Grading Probe II: HGP) and a visual assessment of conformation type (Hulsegge et al., 1999). In Belgium, the federal regulation defines the classification of the carcasses according to carcass lean meat content estimated by the CGM (capteur gras-maigre, i.e. fat lean meter) or Giraldo Choirometer (PG200), (Ministère des Classes Moyennes et de l’Agriculture, 1999). The carcass lean content is calculated from backfat thickness and
longissimus muscle depth between the third and fourth last ribs, and these measurements are then converted into an estimate value of lean meat content by the respective equipment (Ministère des Classes Moyennes et de l'Agriculture, 1999). The correlation between backfat thickness, longissimus muscle depth and longissimus muscle area measured on carcasses, and those corresponding to live animal measurements done by real-time ultrasound, are high with good repeatability (McLaren et al., 1991; Fischer, 1997; Szabo et al., 1999). Ultrasonic techniques therefore offer the possibility of predicting carcass composition when animals are scanned in vivo (Sather et al., 1996 ; Szabo et al., 1999; Hulsegge et al., 1999).
The aim of this study was to evaluate the carcass lean meat content in Pietrain and halothane-resistant Pietrain, and to determine the relationship between ultrasound measurements in vivo and carcass
26 Youssao, Verleyen and Leroy
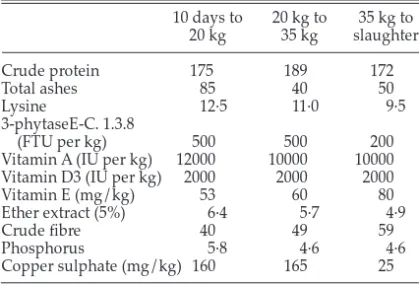
Table 1 Diet composition (g/kg unless otherwise stated)
10 days to 20 kg to 35 kg to 20 kg 35 kg slaughter Crude protein 175 189 172 Total ashes 85 40 50 Lysine 12·5 11·0 9·5 3-phytaseE-C. 1.3.8 (FTU per kg) 500 500 200
Vitamin A (IU per kg) 12000 10000 10000
Vitamin D3 (IU per kg) 2000 2000 2000
Vitamin E (mg/kg) 53 60 80
Ether extract (5%) 6·4 5·7 4·9
Crude fibre 40 49 59
Phosphorus 5·8 4·6 4·6
Copper sulphate (mg/kg) 160 165 25
measurements in order to predict carcass lean content.
Material and methods
Data
Negative stress Pietrain (halothane resistant) was created at the experimental station of the Veterinary Faculty of the University of Liege (Belgium) by introgression of the C allele of Large White stress resistance into the Pietrain genome (Hanset et al., 1995a, b and c). The reconstitution of the Pietrain genome was carried out from 1989 to 1995, starting with an F1 Pietrain-Large White crossing, while preserving the C allele of stress resistance (Leroy and Verleyen, 1999a). Since 1999, the resulting crosses between heterozygous halothane negative individuals (CT) gave three genotypes: homozygote negative stress Pietrain (CC), heterozygote negative stress Pietrain (CT) and the traditional positive stress Pietrain (TT) (Leroy and Verleyen., 1999a, b and c). The halothane sensitivity genotype was determined by the ryanodine test according to Fujii et al. (1991) and Grobet et al. (1992). Backcrosses (BC) were carried out with traditional Pietrain in order to recover the totality of the ‘over genes’ present. With each generation, the CT heterozygote females were crossed with Pietrain boars (TT). The reconstitution level of the Pietrain genome passed successively by stages 3/4 (BC1), 7/8 (BC2), 15/16 (BC3) and 31/32 (BC4). The Pietrain genome was progressively reconstituted and this form of Pietrain is currently named negative stress Pietrain (halothane resistant). Today, the stage 255/256 (BC7) Pietrain has been reached and the quasitotality of the animals is stress resistant (Leroy and Verleyen, 1999a and b).
Data from 335 pigs (164 gilts and 171 barrows) were recorded from 1998 to 2000 at the experimental station of the Faculty of Veterinary Medicine at the University of Liege (Belgium). These pigs were born from 56 sows and 28 boars and came from back-crosses 63/64 (BC5), 127/128 (BC6) and 255/256 (BC7), and BC7 ✕ BC7 crossing. Piglets were weaned at 26 days, corresponding to the time of castration for males. Finishing began at an average age of 85 days. Pigs were kept in groups of 10 according to age and given food ad libitum. The diet composition for starting and finishing is given in Table 1. The pigs were slaughtered at an average age of 213 days at an average weight of 101 kg. The day before slaughter, backfat thickness (BFT), longissimus muscle depth (LMD) and longissimus muscle area (LMA) were measured on each animal using the Pie Medical Scanner 200 (PieMedical Equipment BV, Maastricht, The Netherlands) equipped with an animal science probe (ASP-18) and with a frequency of 3·5 MHz. Ultrasound images for measurements were taken
6 cm from the dorsal mid line at the last ribs. This site was selected for its ease in localization by palpation in order to minimize variation in the scan site location. To obtain good acoustical contact, and to avoid the presence of air bubbles between the probe and skin surface, the site was cleaned and vegetable oil (soya) was used. Each animal was scanned for two types of images : (i) longitudinal images were taken parallel to the dorsal midline for ultrasound backfat thickness (UBFT) and ultrasound longissimus muscle depth (ULMD) measurements and (ii) transverse images were taken perpendicular to the mid line for measurements of longissimus muscle area (ULMA). First, 292 pigs were scanned four times (two longitudinal images and two transverse images) and 43 pigs were scanned two times (one longitudinal image and one transverse image). A cross-sectional image of ULMA was obtained using an ultrasound stand-off guide mounted on a linear probe, conforming to the curvature of the pig's back. Pigs were immobilized in a scanning corridor to standardize the image collection procedure. The features of acceptable images include the following qualities: clear visible backfat layers, longissimus muscle layer and ribs, with no sign of uneven coupling or poor transducer contact; longissimus muscle area taken from the cross-section clearly visible, well delimited with minimal artefacts. The selected images were transferred to a personal computer and recorded according to animal identification number. Measurements of UBFT, ULMD and ULMA were made using image analysis software from Pie Medical: Open Data Transfer (ODT) and Eview (Echo Image Viewer), version 1 (Pie Medical Equipment BV, Maastricht, the Netherlands).
Prior to being transported to Detry S.A. slaughterhouse, the animals were not given food for 24 hours. After slaughter the lean meat content was estimated on the hot carcass by a CGM (capteur
gras-Table 2 Means, standard deviations, minima and maxima of growth and carcass traits by halothane genotype†
Homozygote negative stress (CC) Heterozygote negative stress (CT) Homozygote positive stress (TT)
Mean s.d. Minima Maxima Mean s.d. Minima Maxima Mean s.d. Minima Maxima
Live weight (kg) Birth 1·90 0·59 0·80 3·32 1·97 0·57 0·76 3·50 1·92 0·56 0·78 3·58 Weaning 27·7 4·37 23 33 28 6·34 16 40 27·2 6·34 16 40 Slaughter 103·8 10·76 75 137 103·5 12·42 66 147 103·2 12·76 67 134 Age (day) Weaning 26·05 3·2 16 34 26·18 2·92 17 36 26·16 2·98 18 34 Slaughter 210·1 15·02 190 260 213·2 14·50 188 261 214·8 18·70 187 259 Ultrasound UBFT (mm) 21·2 4·11 13·9 31·2 20·9 3·92 11·4 33·6 19·3 4·25 10·7 31·4 ULMD (mm) 52·4 4·62 42·1 64·1 52·5 5·26 39·5 68·4 53·74 6·88 36·8 69·1 ULMA (cm2) 53·4 4·87 38·5 64 54·2 6·64 33·1 75·1 55·2 6·26 34·2 66·3 Carcass Length (cm) 80·9 8·15 61 89 80·5 10·2 65 90 79·5 6·8 62 85 CWT (kg) 86·1 8·97 62 113·8 85·82 10·32 55 122 85·5 10·67 55·6 111·6 LEAN 0·641 0·041 0·528 0·698 0·641 0·038 0·534 0·717 0·666 0·0356 0·584 0·729
† UBFT: ultrasound backfat thickness; ULMD: ultrasound longissimus muscle depth; ULMA: ultrasound longissimus muscle area; CWT: hot carcass weight; LEAN: carcass lean content proportion.
maigre) equipped with an 8-mm diameter Sydel probe with an infra-red photo-emitting diode and two photo-receivers. The carcasses were penetrated by the probe in the left side of the carcass: first between the second and third last ribs (measuring point of reference) and then, between the third and fourth last ribs (official measuring point), horizontally and perpendicularly at 6 cm from the plane of cutting (de Smet et al., 1997; Ministère des Classes Moyennes et de l'Agriculture, 1999). The lean meat content was calculated according to the Ministère des Classes Moyennes et de l'Agriculture (1999):
Y = 59·902386 – 1·060750X1 + 2·229324X2 where, Y = carcass lean meat proportion estimate; X1= backfat thickness (including the skin, mm) measured at 6 cm lateral of the carcass mid line between the third and fourth last ribs; X2 = longissimus muscle depth (mm), measured at the same time and place as X1.
The measured values were converted into an estimate value of carcass lean content by the same means.
Statistical analysis
The following factors of variation were recorded: halothane genotype (homozygote negative stress (CC), heterozygote negative stress (CT) and homozygote positive stress (TT)) and sex (gilts and barrows). The fixed linear model was adjusted to the carcass lean content data.
Yijkl = µ + Ti + Sj + eijk
Yijkl carcass lean meat content of the kth pig, halothane genotype i, and sex j; µ = overall mean; Ti = fixed effect of halothane genotype i; Sj = fixed effect of sex j; eijk = residual errors.
The interaction between these different factors of variation was not significant and was ignored in the final model. The data were analysed according to general linear model procedure (GLM) of Statistical Analysis Systems Institute (SAS, 1989), then, the least-squares means were estimated and compared by the Student test. The proportion of variation explained by the model and each of the non-genetic factors was calculated according to Searle (1971), by using the difference of the part of variation R2 (reduction of the sum of the squares following the presence or the absence of the factor). The correlation between ultrasound measurements in the live animal and those of the carcass were obtained by PROC CORR of SAS (1989). Regression analyses were carried out using the PROC REG procedures of SAS (1989) and the stepwise model selection option. The choice of equations was made using the C(p) statistic as described by Mallows (1973) with the equation giving C(p) value closest to the number of parameters in the model being reported.
Results
Means, standard deviations, minima and maxima of the main traits by halothane genotype are shown in Table 2. The overall means of UBFT were 21·2, 20·9
28 Youssao, Verleyen and Leroy
Table 3 Analysis of variance, least-squares means and standard errors of carcass lean proportion by halothane genotype and sex
Carcass lean proportion
Sources of variation No.† Mean s.e.
Genotype *** CC 37 0·6369a 0·0058 CT 151 0·6424a 0·0031 TT 95 0·6668b 0·0042 Sex *** Gilt 157 0·6651a 0·0034 Barrow 161 0·6323b 0·0036
a,b Means in the same column without the same letter differ
significantly (P < 0·05).
† Genotype and sex of some pigs not recorded.
Table 4 Correlation between live weight, carcass weight, carcass lean proportion and ultrasound measurements for (a) halothane homozygote negative stress (CC), (b) halothane heterozygote negative stress (CT) and (c) halothane homozygote positive stress (TT)
Variables† CWT LWT UBFT ULMD ULMA
(a) LEAN 0·014 0·015 –0·694*** 0·356* 0·210 CWT 0·999*** 0·266 0·189 0·535*** LWT 0·266 0·187 0·539*** UBFT –0·225 –0·002 ULMD 0·467** (b) LEAN –0·140 –0·144 –0·481*** 0·325*** 0·221* CWT 0·999*** 0·529*** 0·338*** 0·566*** LWT 0·533*** 0·338*** 0·594*** UBFT 0·078 0·352*** ULMD 0·650*** (c) LEAN –0·235 ** –0·236** –0·482*** 0·408*** 0·288** CWT 0·999*** 0·456*** 0·314** 0·597*** LWT 0·455*** 0·310** 0·592*** UBFT 0·054 0·311** ULMD 0·703***
† BFT: ultrasound backfat thickness; ULMD: ultrasound longissimus muscle depth; ULMA: ultrasound longissimus muscle area; LWT: live weight at slaughter; CWT: hot carcass weight; LEAN: carcass lean proportion.
and 19·3 mm respectively for CC, CT and TT, respectively. The corresponding longissimus muscle depth (52·4, 52·5 and 53·7) increased with the presence and number of T alleles. Average carcass weight was 86·1 kg for CC, 85·8 kg for CT and 85·5 kg for TT. The carcass lean meat proportion (LEAN) was 0·641 for CC and CT and 0·666 for the TT genotype. Results of the analysis of variance, least-squares means and standard errors for LEAN according to halothane genotype and sex are listed in Table 3.
The halothane genotype effect on LEAN was highly significant (P < 0·001) and explained proportionately 0·09 of the total variation (R2). LEAN was higher in homozygote TT than homozygote CC and heterozygote CT (P < 0·05). The difference between CC and CT was not significant. LEAN increased with the number of T alleles. Sex had a highly significant effect (P < 0·001) on LEAN and explained a larger part (0·1693) of the total variation than halothane genotype. Gilts had leaner carcass than barrows (P < 0·05).
Simple linear correlations between ultrasound measurements, carcass weight, live weight and carcass lean proportions are given by halothane genotype in Table 4. For homozygote negative stress (Table 4a), the LEAN was positively correlated with ULMD (r = 0·36) and ULMA (r = 0·21) although the latter was not significant. A negative correlation was observed between LEAN and UBFT (r = –0·69). The correlation between LEAN and carcass weight (CWT) or live weight (LWT) was positive and close to zero. On the other hand, it was negative, but not significantly so, for halothane negative (CT) pigs (Table 4b) and negative (P < 0·01) for halothane positive (TT) pigs (Table 4c). The correlation between
LEAN and UBFT was negative (r = –0·48) in CT and TT genotypes. Regardless of the halothane genotype, CWT and LWT were highly correlated with ULMA. The correlation between LEAN and ULMA was weaker than those obtained between LEAN and UBFT or ULMD for each halothane genotype. Thus, UBFT and ULMD measurements would be preferable as predictors of carcass lean proportion. Table 5 presents stepwise multiple regression equations used to predict carcass lean content from ultrasound live animal measurements for overall data and according to halothane genotype for each sex. UBFT and ULMD constituted the best variables to predict carcass lean for the majority of the equations. As shown in Table 4, the correlations between LEAN and ULMA were weak when ULMA was added to each equation in Table 5, the coefficient of determination did not vary but the residual standard deviation and the C(p) were high. The R2 values of the regression equations to predict LEAN varied from 0·35 to 0·79 according to the halothane genotype. Equations with the highest precision seemed to be those predicting carcass lean in the homozygote negative stress (CC) genotype, where gilts were more closely predicted than barrows.
Discussion
Halothane genotype effect
Studies of negative stress (CC) Pietrain pigs were initiated by Hanset et al. (1995a, b and c). They reported a halothane genotype effect (P < 0·001) on the proportion of lean cut in Pietrain ✕ Large White F2 was 0·632, 0·6340 and 0·655 respectively for halothane negative (CC), halothane negative (CT) and halothane positive (TT) pigs. In the course of reconstruction of the Pietrain genome by repeated back-crossing and while maintaining heterozygosity at the Hal locus in breeding females, they reported that the proportion of lean cuts of halothane carriers (CT) was significantly higher than in non-carriers (P < 0·001) from BC1 to BC4. Moreover, proportion of the lean cuts for gilts was greater than for barrows. The results of the present study confirm those of Hanset et al. (1995a, b and c), Leroy and Verleyen (1999a, b, and c) and Leroy et al. (2001) and indicate the same variation (P < 0·001) between TT, CT and CC genotypes from BC5 to BC7. The results from this study also agree with those of Larzul et al. (1997) who observed that the proportion of carcass lean increased from CC to CT and from CT to TT genotypes, although the former was not significant in our study. Their values for gilts were greater than their values for barrows. The higher carcass lean content values, resulting from the presence of the T allele, has been repeatedly found in TT and CT pigs (Wittmann et al., 1993; O'Brien et al., 1994). In Simpson and Webb (1989) both the halothane positive and the halothane carriers had more lean in their carcasses than the halothane negative, and this was best expressed when pigs were offered food ad libitum. When given a restricted diet, the halothane negative pigs showed a superiority over the halothane positive pigs in the proportion of ham and high-priced cuts (total of the rib back, rump back and ham joints) which contradicted expectation. Regarding SKG II parameters, halothane carrier pigs
have been characterized as having a higher lean content as compared with halothane negative pigs (P < 0·05) with the lean content significantly different between all three genotype groups (de Smet et al., 1992) in Belgian Landrace and Pietrain ✕ Belgian Landrace crosses. Their results are in contrast with those of de Smet et al. (1996), who observed no difference between CC and CT for carcass lean content in the same breed. This may be explained by the fact that lean content was determined solely from fat thickness. For this trait, it appears that CT pigs are not very different from CC pigs (Pommier et al., 1992; Rempel et al., 1995). Thus, backfat thickness is usually not accurate enough to reveal the leaner carcasses of CT pigs when compared with CC pigs. In a study of halothane genotype effect on pork production, Sather et al. (1991b) observed no significant difference between carcass lean of heterozygous (CT) and homozygous pigs (CC). However, barrows had proportionately 0·012 less predicted lean yield than gilts (P < 0·001). According to Leach et al. (1996), yield of trimmed, boneless cuts (ham, loin, tenderloin, picnic shoulder and Boston butt) was higher for carriers; the increase was attributed to higher ham and shoulder yields. Sather et al. (1991b) showed a lower bone content in carrier carcasses. However, the difference between halothane genotypes in carcass composition depends on live weight. Sather et al. (1991a) showed that in the wholesale cut (ham, loin and shoulder) the lean content of carrier (CT) and negative (CC) pigs was similar but lower than reactors (TT) at lighter weights (80 kg live weight), whereas at heavier weights (up to 130 kg live weight) the composition of carriers (CT) was similar to reactors (TT) and both genotypes had higher lean content than negative (CC) pigs. At lighter weights, the halothane gene locus appears to have a recessive genetic effect on dissectible lean, since CT genotyped pigs were more similar to CC pigs than to TT pigs. At heavier Table 5 Regression equations for predicting carcass lean content proportion by ultrasound measurements†
Sex No. Intercept UBFT ULMD ULMA R2 Residual s.d. C(p)
Overall data 284 65·48 –0·5 0·18 0·53 2·37 3 CC Gilts 24 67·19 –0·57 0·18 0·79 2·04 3 halothane genotype Barrows 13 64·96 –0·27 0·12 0·36 2·07 3 CT Gilts 71 64·96 –0·27 0·12 0·35 2·17 3 halothane genotype Barrows 81 64·95 –0·27 0·12 0·36 2·21 3 TT Gilts 49 63·48 –0·33 0·19 0·49 2·06 3·17 halothane genotype Barrows 46 59·76 –0·34 0·23 0·47 1·95 2·21
30 Youssao, Verleyen and Leroy
weights, the halothane gene locus appears to behave as if it was dominant, since the TT and CT pigs were similar in lean content. According to Sather et al. (1991a), the transition between these two gene models occurs at carcass weights of over 85 kg. Thus, an apparent increase in the dominance of the halothane gene with increasing carcass weight could be explained by the genotype ✕ weight interaction.
Correlation between live and carcass measurements Results from this study show that lean proportion had a moderate correlation with UBFT, and ULMD. Regardless of the halothane genotype for stress, the correlation between carcass lean proportion and UBFT or ULMD were higher than those between carcass lean and ULMA. Thus, ULMA would not be the best parameter for carcass lean prediction compared with UBFT and ULMD. These results are similar to the findings of Smith et al. (1992), who reported a correlation of 0·25 between ultrasound longissimus muscle area and percentage of lean cuts, whereas the correlation between ultrasound last rib backfat and percentage of lean cuts was –0·51. Gresham et al. (1992) reported that the correlation between ultrasound last rib backfat and proportion of total cuts (trimmed ham, loin, shoulder and belly) was –0·48 and the correlation between ultrasound last rib backfat and proportion of lean pork (trimmed ham, loin and shoulder) was –0·38. In the same way, they obtained correlations between ultrasonic muscle depth and proportion of total cuts of 0·19 and between ultrasonic muscle depth and proportion of lean cuts of –0·31. These correlations are lower than the values observed between lean proportion (LEAN) and UBFT and between LEAN and ULMD from the present study. The difference observed with the trial results of Gresham et al. (1992) could be dependent on ultrasound technology or on genetic and compositional variation for animals used in each trial. Carcass lean proportion was slightly correlated with longissimus muscle depth (0·41) and with longissimus muscle area (0·47) in the study of Cisneros et al. (1996). According to Courchaine et al. (1996), correlations between lean cuts and longissimus area varied from –0·28 to 0·15.
Gresham et al. (1992) reported significant correlation coefficients between live weight and longissimus muscle depth (0·41) and between hot carcass weight and longissimus muscle depth (0·47) in commercial market pigs typical of the US population 10 years ago. In the same way, the correlation between carcass harvest weight and longissimus depth was 0·36 (Cisneros et al., 1996). Those values are higher than those of this study. In contrast, according to Cisneros et al. (1996), the correlation between carcass weight
and longissimus muscle area in the latter study (0·43) was lower than we found.
Prediction of carcass lean proportion
In the present experiment, carcass lean content proportion was predicted from UBFT and ULMD (or ULMA) with R2 values varying from 0·35 to 0·79 according to the halothane genotype and the sex considered. UBFT and ULMD constituted the best variables to predict carcass lean for the majority of the equations. Muscle depth is generally a part of the prediction equations and not loin muscle area in this trial because the correlation between carcass lean and ULMD was higher than that of carcass lean and ULMA. This difference could be due to the linear increase of LEAN with ULMD, whereas, ULMA increased linearly with live weight during growth to slaughter weight (cf. correlation between live weight and ULMA and correlation between LEAN and ULMD for each genotype in Table 4a, b and c). In this study, a high accuracy (R2 = 0·79) was observed for gilts versus a low accuracy for barrows with the CC halothane genotype. This difference could be related to the number of observations by sex class in CC genotype. Gresham et al. (1992) reported stepwise multiple regression equations for predicting proportion of lean cuts and percentage of boneless lean cuts from ultrasonic measurements with coefficients of determination R2 of 0·42 and 0·51 respectively and with residual standard errors of 3·06 and 1·51 respectively. Elsewhere, estimation of commercial lean yield from carcass fat thickness and muscle depth measurements made by the Hennessy Grading Probe (HGP) and Tokyo Keiki LS-1000 had R2 values (residual s.d.) of 0·58 (1·72) and 0·65 (1·52) ; adding muscle area to LS-1000 measurements did not further improve R2 values (Sather et al., 1996). Alliston et al. (1982) evaluated two early designs of ultrasound scanning equipment and concluded that including longissimus muscle area measurements with live weight and P2 backfat thickness at the last rib did not improve the precision of estimating carcass lean content. On the other hand, the findings of Molenaar et al. (cited by Cisneros et al. (1996)) indicated that the accuracy of proportion of lean cuts predicted from real-time ultrasonic scans was significantly improved by including longissimus muscle measurements (depth or area) together with backfat thickness in prediction equations. This was in agreement with the results of the present study. Gresham et al. (1994) suggested that a single longitudinal scan taken at the 10th rib was accurate for predicting carcass composition but did not include scans at other positions. Equations based on ultrasound scans have been shown to explain more variation of the dependent variables than those based on direct carcass measurements taken at the
(1996) reported that halothane genotype biases were larger from carcass measures for models predicting proportions as opposed to weights of carcass lean cuts and fat-free lean. The equations overestimated the carcass value of negative pigs and underestimated the value of the carcass from carrier pigs. Generally, the R2 for equations predicting carcass lean cut weight were much higher than those predicting carcass lean proportion, irrespective of the method and (or) the site of measurement. According to Leach et al. (1996), the weight of trimmed, boneless cuts, and fat-free lean increased linearly with slaughter weight; however, the changes in proportion cut yields and fat-free lean contents with slaughter weight were generally negative. These results are confirmed in this study: the correlations between carcass lean proportion and live weight or carcass weight were nearly zero for CC and negative in CT and TT pigs. Similar findings in other swine breeds have been reported by others (Gresham et al., 1992 and 1994).
Conclusion
In this study, carcass lean proportion was greater in homozygote TT than homozygote CC, with heterozygote CT intermediate. Moreover, the proportion in gilts was greater than in barrows. The correlation between carcass lean content and ultrasound measurements was moderate to high. Therefore, it would be possible to predict carcass lean content in pigs in vivo. Better precision will require greater accuracy of measurements from image analysis software. Results of this study will allow the selection for carcass lean content of finishing or breeding negative stress Pietrain pigs. However, if carcass lean content and intramuscular fat were selected together, the score of negative stress Pietrain meat would be improved.
Acknowledgements
The authors thank C. Michaux, J.-L. Hornick, F. Farnir, J. Détilleux, S. Berghmans, E. Davis and CGRI (Commissariat Général aux Relations Internationales de la Communauté Wallonnie Bruxelles) for their contribution.
References
Alliston, J. C., Kempster, A. J., Owen, M. G. and Ellis, M. 1982. An evaluation of three ultrasonic machines for predicting the body composition of live pigs of the same breed, sex and live weight. Animal Production 35: 165-169. Courchaine, J. K., Azain, M. J., Jones, R. D. and Glaze, T. M. 1996. Use of real-time ultrasound in the early finishing phase to predict carcass composition at harvest. http:// www.ads.uga.edu/annrpt/1996/96_255.htm
pigs. Journal of Animal Science 74: 2566-2576.
Fisher, A. V. 1997. A review of the technique of estimating the composition of livestock using the velocity of ultrasound. Computer and Electronics in Agriculture 17: 217-231.
Fujii, J., Otsu, K., Zorzato, F., De Leon, S., Khanna, V. K., Weiler, J. E., O'Brien, P. J. and MacLennan, D. H. 1991. Identification of a mutation in porcine ryanodine receptor associated with malignant hyperthermia. Science 253: 448-451.
Gresham, J. D., McPeake, S. R., Bernard, J. K. and
Henderson, H. H. 1992. Commercial adaptation of
ultrasonography to predict pork carcass composition from live animal and carcass measurements. Journal of Animal Science 70: 631-639.
Gresham, J. D., McPeake, S. R., Bernard, J. K., Riemann, M. J., Wyatt, R. W. and Henderson, H. H. 1994. Prediction of live and carcass characteristics of market hogs by use of a single longitudinal ultrasonic scan. Journal of Animal Science 72: 1404.
Grobet, L., Hanset, R. and Dasnois, C. 1992. Réponse au test à l’halothane et génotype au locus RYR1 du récepteur à la ryanodine chez des porcs croisés Piétrain. Annales de Médecine Vétérinaire 136: 249-257.
Hanset, R., Dasnois, C., Scalais, S., Michaux, C. and Grobet, L. 1995a. Génotype au locus de sensibilité à l'halothane et caractères de croissance et de carcasse dans une F2 Piétrain ✕ Large White. Genetics, Selection, Evolution 27: 63-76.
Hanset, R., Dasnois, C., Scalais, S., Michaux, C. and Grobet, L. 1995b. Effet de l'introgression dans le génome Piétrain de l'allèle normal au locus de sensibilité à l'halothane. Genetics, Selection, Evolution 27: 77-88.
Hanset, R., Scalais, S. and Grobet, L. 1995c. Du Piétrain classique au Piétrain résistant à l'halothane ou Piétrain Réhal. Annales de Médecine Vétérinaire 139: 23-35.
Hulsegge, B., Mateman, G., Merkus, G. S. M. and Walstra, P. 1999. Choice of probing site for classification of live pigs using ultrasonic measurements. Animal Science 68: 641-645. Larzul, C., Le Roy, P., Guéblez, A., Talmant, A., Gogué, J., Sellier, P. and Monin, G. 1997. Effet of halothane genotype (nn, Nn, NN) on growth, carcass and meat quality traits of pigs harvested at 95 kg or 125 kg live weight. Journal of Animal Breeding and Genetics 114: 309-320.
Leach, L. M., Ellis, M., Sutton, D. S., McKeith, F. K. and Wilson, E. R. 1996. The growth performance, carcass characteristic, and meat quality of halothane carrier and negative pigs. Journal of Animal Science 74: 934-943. Leroy, P. L., Beduin, J.-M., Verleyen, V., Lebailly, P. and Berti, F. 2001. Les attentes des consommateurs, des nouveaux critères de sélection porcine. Carrefour des productions animales, Gembloux, 24 January 2001, pp. 74-83. Leroy, P. L. and Verleyen, V. 1999a. Le porc Piétrain résistant au stress (ReHal) dans la filière porcine. In Quatrième carrefour des productions animales: les démarches de
32 Youssao, Verleyen and Leroy
qualité en production de viandes, Gembloux, 27 January, pp. 39-40.
Leroy, P. L. and Verleyen, V. 1999b. The new stress negative Piétrain line developed at the Faculty of Veterinary Medicine of the University of Liège. AIVETs meeting, Brugge, Belgium, pp. 27-31.
Leroy, P. L. and Verleyen, V. 1999c. Performances of the Piétrain ReHal, the new stress negative Piétrain line. In Quality of meat and fat in pigs affected by genetics and nutrition, EAAP publication no. 100, Zürich, 22-26 August 1999, pp. 161-164
McLaren, D. G., Novakofski, J., Parrett, D. F., Lo, L. L., Singh, S.D., Neuman, K. R. and McKeith, F. K. 1991. A study of operator effects on ultrasonic measures of fat depth and longissimus muscle area in cattle, sheep and pigs. Journal of Animal Science 69: 54-66.
Mallows, C. L. 1973. Some comments on C(p). Technometrics 15: 661.
Ministère des Classes Moyennes et de l’Agriculture. 1999. Arrêté ministériel relatif au classement des carcasses de porcs. Moniteur belge. http://www.just.fgov.be/cgi/ article_bod
O’Brien, P. J., Ball, R. O. and McLennan, D. H. 1994. Effect of heterozygosity for the mutation causing porcine stress syndome on carcass quality and live performance characteristics. Proceedings of the 13th international pig veterinary science congress, 26-30 June 1994, Bankok, Thailand, p. 481.
Pommier, S. A., Houde, A., Rousseau, F. and Savoie, Y. 1992. The effect of malignant hyperthermia genotye as determined by a restriction endonuclease assay on carcass characteristics of commercial crossbred pigs. Canadian Journal of Animal Science 72: 973-976.
Rempel, W. E., Lu, Ming Yu, Mickelson, J. R. and Louis, C. F. 1995. The effect of skeletal muscle ryanodine receptor genotype on pig performance and carcass quality traits. Animal Science 60: 249-257.
Sather, A. P., Bailey, D. R. C. and Jones, S.D. M. 1996. Real-time ultrasound image analysis for the estimation of carcass yield and pork quality. Canadian Journal of Animal Science 76: 55-62.
Sather, A. P., Jones, S. D. M. and Tong, A. K. W. 1991a. Halothane genotype by weight interactions on lean yield from pork carcasses. Canadian Journal of Animal Science 71: 633-643.
Sather, A. P., Murray, A. C., Zawadski, S. M. and Johnson, P. 1991b. The effect of halothane gene on pork production
and meat quality of pigs reared under commercial conditions. Canadian Journal of Animal Science 71: 959-967. Searle, R. 1971. Linear models. John Wiley and Sons Inc., New York.
Simpson, S. P. and Webb, A. J. 1989. Growth and carcass performance of British Landrace pigs heterozygous at the halothane locus. Animal Production 49: 503-509.
Smet, S. de, Pauwels, H., Eeckhout, W., Demeyer, D. I., Vervaeke, I., Bie, S. de, Voorde, G. van de and Casteels, M. 1992. Relationships between halothane sensitivity, carcass quality and meat quality in Belgian harvest pigs. In Pork quality, genetic and metabolic factors (ed. E. Puolanne, D. I. Demeyer, M. Ruusunen and S. Ellis), pp. 259-270. CAB International, Wallingford.
Smet, S. M. de, Casteel, M., Voorde, G. van der and Oeckel, G. van. 1997. Approval of two methods of grading for pig carcasses in Belgium. Proceedings of the 48th annual meeting of the European Association for Animal Production, 25-28 August 1997, Vienna, p. 388.
Smet, S. M. de, Pauwels, H., Bie, S. de, Demeyer, D. I., Callewier, J. and Eeckhout, W. 1996. Effect of halothane genotype, breed, feed withdrawal, and lairage on pork quality of Belgian harvest pigs. Journal of Animal Science 74: 1854-1863.
Smith, B. S., Jones, W. R., Hough, J. D., Huffman, D. L., Mikel, W. B. and Mulvaney, D. R. 1992. Prediction of carcass characteristics by real-time ultrasound in barrow and gilts slaughtered at three weights. Journal of Animal Science, 70: 2304-2308.
Statistical Analysis Systems Institute. 1989. SAS/STAT user’s guide, version 6, fourth edition. SAS Institute Inc., Cary, NC.
Szabo, C., Babinszky, L., Verstegen, M. W. A., Vangen, O., Jansmann, A. J. M. and Kanis, E. 1999. The application of digital imaging techniques in the in vivo estimation of the body composition of pigs: review. Livestock Production Science 60: 1-11.
Terry, C. A., Savell, J. W., Recio, H. A. and Cross, H. R. 1989. Using ultrasound technology to predict pork carcass. Journal of Animal Science 67: 1279.
Wittmann, W., Peschke, W., Littmann, E., Behringer, J., Birkenmaier, S., Dovc, P. and Förester, M. 1993. Mast-und Schlachtleistungen von DL-Kastraten in Abhängigkeit von MHS-Genotyp. Züchtungskunde 65: 197-205.