Published in: Electronic and Atomic Collision: Abstract of Contributed Papers (1979), pp. 352-353 Status: Postprint (Author’s version)
DISSOCIATIVE IONIZATION BY LOW ENERGY ELECTRON
IMPACT.
ION ENERGY DISTRIBUTION OF N
2+FROM N
2ANDO
2+FROM O
2.
R. LOCHT, J. MOMIGNY
Institut de Chimie, Université de Liège, Sart-Tilman par Liège I- Belgium
The formation of N2+ ions by electron and ion impact has been investigated by several groups (1-1). The lowest threshold for the appearance energy is measured at around 61 eV (1, 2) and 54 eV (3). The N2+ ion energy distribution has been examined as a function of the electron energy and the angle between ion and electron beam (1-3). No thermal peak has been observed. The present contribution will report preliminary results on N2+ from N2 and O
2+
from O2.
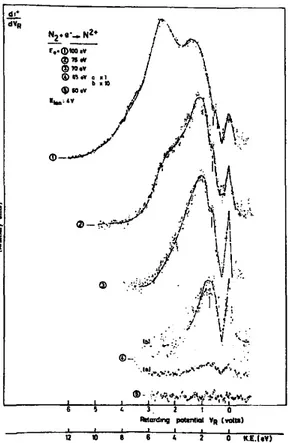
The experimental set-up is described elsewhere (5). Ion energy distributions are measured by recording the first differentiated retarding potential curve. Fig. 1 shows the N2+ /N2 kinetic energy distributions obtained
for electron energies from 60-100 eV. Peak maxima are measured at (1.2 ± 0.1) eV, (3.0 ± 0.1) eV, (5.1 ± 0.1) eV and a shoulder around 7 eV, in agreement with CROWE (2). Furthermore, in the present work, a thermal peak of low intensity is present at all electron energies down to 65 eV.
A second feature in this experiment is that no N2+ ion current is detected at 60 eV (see fig. 1).The signals at 60 eV and 65 eV are obtained both in the same experimental conditions. This result un-ambiguously shows that the appearance energy of the N2+ ions lies below 65 eV and higher than 60 eVelectron energy. These measurements agree with those of VAN BRUNT (1) and CROWE (2) and disagree drastically with the value of 54 eV determined by DELEANU (3).
Published in: Electronic and Atomic Collision: Abstract of Contributed Papers (1979), pp. 352-353 Status: Postprint (Author’s version)
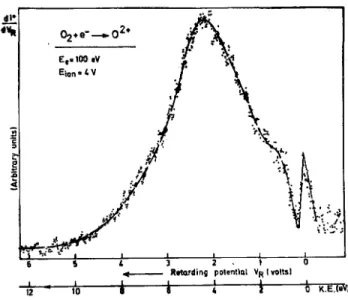
FIG. 2 - Ion energy distribution of 02+/02 for 100 eV electrons.
For the first time the O2+ from O2 ion energy distribution is examined. A distribution obtained for 100
eV electrons is shown in Fig. 2. Beneath the peak maxima at 4.4 eV and 1.6 eV ion energy a thermal peak is observed. Further experiments on both N2+/N2 and O2+/O2 are in progress for the determination of the
appearance energy of each observed process. References
(1) L.J. KIEFFER, R.J. VAN BRUNT, J. Chem. Phys. 46 (1967) 2728. (2) A. CROWE, J.W. McCONKEY, J. Phys. B.8 (1975) 1765.
(3) L. DELEANU, J.A.D. STOCKDALE, J. Chem. Phys. 63 (1975) 3898. (4) A.K. EDWARDS, R.M. WOOD, M.F. STEUER, Phys. Rev. A.15 (1977) 48. (5) R. LOCHT, J. SCHOPMAN, Int. J. Mass. Spectr. Ion Phys. 15 (1974) 361.