ASSESSING THE CONTRIBUTION OF CHEMICAL ENHANCEMENT TO C02 EXCHANGEACROSS THE AIR-WATER INTERFACE IN EUTROPHIC LAKES
OF QUEBEC
DISSERTATION PRESENTED
AS PARTIAL REQUIREMENT OF THE MASTER OF BIOLOGY
BY JIHYEONKIM
ESTIMER L'INFLUENCE DU TAUX D'ACCÉLÉRATION CHIMIQUE SUR LES ÉCHANGES DE C02 À L'INTERFACE AIR-EAU DANS LES
LACS EUTROPHIQUES DU QUÉBEC
MÉMOIRE PRÉSENTÉ
COMME EXIGENGE PARTIELLE DE LA MAÎTRISE EN BIOLOGIE
PAR JIHYEONKIM
UNIVERSITÉ DU QUÉBEC À MONTRÉAL Service des bibliothèques
Avertissement
La diffusion de ce mémoire se fait dans le respect des droits de son auteur, qui a signé le formulaire Autorisation de reproduire et de diffuser un travail de recherche de cycles supérieurs (SDU-522 – Rév.07-2011). Cette autorisation stipule que «conformément à l’article 11 du Règlement no 8 des études de cycles supérieurs, [l’auteur] concède à l’Université du Québec à Montréal une licence non exclusive d’utilisation et de publication de la totalité ou d’une partie importante de [son] travail de recherche pour des fins pédagogiques et non commerciales. Plus précisément, [l’auteur] autorise l’Université du Québec à Montréal à reproduire, diffuser, prêter, distribuer ou vendre des copies de [son] travail de recherche à des fins non commerciales sur quelque support que ce soit, y compris l’Internet. Cette licence et cette autorisation n’entraînent pas une renonciation de [la] part [de l’auteur] à [ses] droits moraux ni à [ses] droits de propriété intellectuelle. Sauf entente contraire, [l’auteur] conserve la liberté de diffuser et de commercialiser ou non ce travail dont [il] possède un exemplaire.»
I would like to express my sincere gratitude to my supervisor, Yves Prairie, for giving me the opportunity to experience all these wonderful works and studies. Thanks to his kindness and intelligence, and the moment that I discuss any topic in science with him is the best time. Also, the past two years in his group would be the best years of my life. Thanks to Paul del Giorgio for all his comments and suggestions. From the two great professors, and from excellent colleagues in the entire group, I have learned their positive energy, sincere attitude to research, effective collaboration as well as scientific knowledge. Lastly, I would like to thank my mother for her valuable support and encouragement, and also thank my father watching me in heaven for bis love.
LISTE DES FIGURES ... vi
RÉSUMÉ GÉNÉRAL ... vii
GENERAL SUMMARY ... viii
INTRODUCTION ... 1
0.1 Problem statement ... 3
0.2 Review of current scientific studies ... 5
0.2.1 Gas exchange at the air-water interface ... 5
0.2.2 Lake eutrophication and C02 flux ... 9
0.2.3 Chemical enhancement of C02 ... 12
0.3 Objectives and hypothesis ... 19
CHAPITRE I ASSESSING THE CONTRIBUTION OF CHEMICAL ENHANCEMENT TO C02 EXCHANGE ACROSS THE AIR-WATER INTERFACE IN EUTROPHIC LAKES OF QUEBEC ... 22
1.1 Abstract ... 23
1.2 Introduction ... 25
1.3 Materials and methods ... 29
1.3.1 Study area and sampling periods ... 29
1.3.2 Sample collection and Processing ... 31
1.3.3 Statistical analyses ... 34
1.4 Results ... 35
1.4.1 Chemical and physical characteristics of sampled lakes ... 35
1.4.3 Relationship between kGOo derived from two different gases ... 39
1.4.4 Discrepancies between observed
a
and H&Ba ...
411.5 Discussion ... 44
1.6 Conclusion ... 53
1. 7 Acknowledgments ... 54
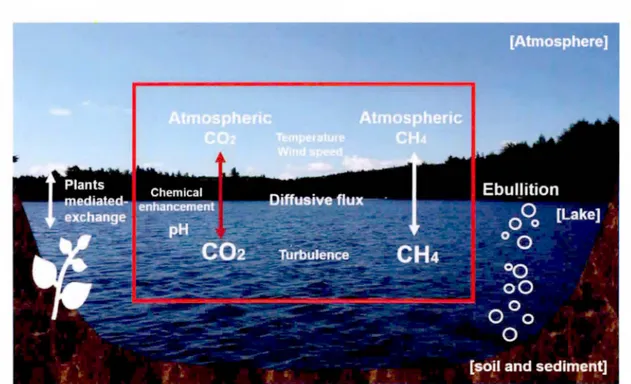
Figure Page 0.1 Main pathways that mediate C02 and CH4 flux with the atmosphere in lake
system ... 26
0.2 Surface water pC02 dynamics in lake systems ... 29
0.3 Relationship between theoretical chemical enhancement factor (a) estimated from H&B model and pH for typical temperature ... 34
0.4 Relationship between theoretical chemical enhancement factor (a) estimated from H&B model and unenhanced gas exchange velocity (k'co2) for typical pH and temperatures ... 35
0.5 Empirically observed a from chamber measurements and predicted a from H&B model ... 36
1.1 Map of sampled lakes ... 48
1.2 Chemical and physical conditions of sampled lakes ... 55
1.3 pH and observed a associated with C02 out-gassing and in-gassing ... 56
1.4 The relationship between the gas exchange velocity (k6oo) estimated from carbon dioxide (y axis) and methane (x axis) ... 58
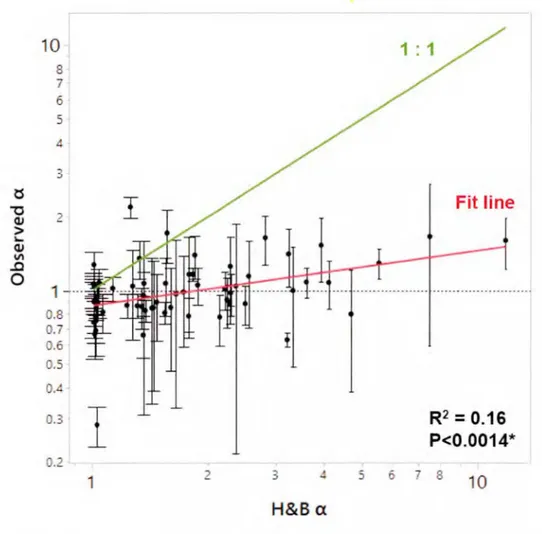
1.5 The relationship between empirically observed chemical enhancement (observed a, y axis) and that estimated from the Hoover and Berkshire model (H&B a, x axis) ... 60
1.6 The relationship between the chemical enhancement factors (a) and surface water pH ... 61
1. 7 Two different gas exchange models; a) Stagnant boundary layer model and b) Surface renewal model ... 64
1.8 Little evidence of microbubble-effect on k6oO-CH4 ... 66
1.9 The significant relationship between the total alkalinity of our sampled lakes and the differences between observed a and H&B a ... 68
Contrairement aux gaz non réactifs comme le méthane (CH4) et l'oxyde nitreux (N20), les flux diffusifs de dioxyde de carbone (C02) à travers l'interface air-eau sont influencés par la réaction chimique du C02 avec les ions hydroxyles (OH·), surtout à pH élevé. Dans les lacs eutrophes où le pH est relativement élevé, l'accélération chimique est considérée comme un facteur de contrôle potentiellement influant sur les flux de C02. À date, plusieurs études utilisent le modèle de Hoover et Berkshire (1969) (H&B) pour estimer les taux d'accélération chimique (a) afin d'obtenir des estimés précis de flux de C02. Cependant, le modèle a rarement été testé dans des conditions réelles sur le terrain. Pour aborder cette question, nous avons quantifié la contribution de l'accélération chimique aux flux de C02 entre l'air et l'eau en comparant des mesures de vitesses d'échange gazeux du C02 (k600.co2) et du CH4 (k6oo-CH4) dans 21 lacs du Québec durant l'été 2015 et 2016. De plus, nous avons examiné les divergences entre les taux de a mesurés versus prédits basé sur les calculs de H&B pour vérifier l'applicabilité de ce modèle. Dans la majorité des lacs, il n'y avait pas de différence systématique entre le k600.co2 et le k60o-CH4 ( en moyenne 2.1 and 2.2 m d·1 respectivement), ce qui suggère que l'accélération chimique du C02 ne contribue pas significativement aux flux air-eau de C02 pour une large gamme de valeurs de k6oo. De plus, les valeurs de a observées étaient considérablement plus faibles que celles prédites par H&B (jusqu'à 7.4 fois plus faibles), ce qui indique que le modèle de H&B peut surestimer considérablement l'accélération chimique du C02, particulièrement dans les lacs aux eaux hautement alcalines. Des raisons possibles de cette différence entre les valeurs de a mesurées versus prédites sont : 1) des prémisses erronées dans le modèle de H&B, 2) une accélération de la vitesse d'échange gazeux du gaz de référence (le CH4), et 3) une divergence entre les conditions expérimentales dans lesquelles le modèle H&B a été développé et les conditions sur le terrain. Nos résultats suggèrent aussi que les échanges gazeux sont potentiellement mieux décrits par un mécanisme de renouvellement de surface plutôt que par une couche limite stagnante. On s'attend à ce que ces résultats améliorent l'estimation des échanges gazeux dans les systèmes eutrophes, et ailles des conséquences importantes sur les budgets de carbone régionaux. Mots clés : Échanges gazeux air-eau, Dioxyde de carbone, Accélération chimique, Lacs eutrophes, Vitesse d'échange gazeux, hydratation.
In contrast with chemically non-reactive gases such as methane (CH4) and nitrous oxide (N20), diffusive carbon dioxide (C02) exchange across the air-water interface can be enhanced by chemical reactions of C02 with hydroxyl ions (OH-), especially at high pH. In eutrophie lakes where pH is relatively high, chemical enhancement is believed to be an important factor in driving C02 fluxes. So far, in many studies, the theoretical model of Hoover and Berkshire (1969) (H&B) was widely used to estimate chemical enhancement rates (a) for accurate estimates of C02 flux. However, there is very few tests of the model in field conditions. To address this issue, we quantified the actual contributions of chemical enhancement to air-water C02 fluxes by comparing measured gas exchange velocities derived from C02 (k600-co2) and from CH4 (k60o-CH4) in 21 lakes of Quebec during the summer of2015 and 2016. In addition, we examined any discrepancies that might exist between the observed a and that predicted from the H&B calculation to verify the general applicability of the model. In most lakes, there was no systematic difference between k600.c02 and kGOo-CH4 (on average 2.1 and 2.2 m d-1, respectively), suggesting that chemical enhancement of C02 is not a significant contributor to air-water C02 flux over a wide range of kGoo values. In addition, observed
a. were considerably lower than H&B a (up to 7.4 times), indicating that the H&B model can overestimate chemical enhancement of C02, particularly in high alkalinity waters. Likely reasons for the discrepancy between observed and calculated values of
a.
are: 1) some inappropriate assumptions of the H&B mode 1, 2) enhanced gas ex change velocities of reference gas (CH4), and 3) divergence between the experimental conditions in which the H&B model has been developed and actual field conditions. Our results also suggest that gas exchange may be more appropriately described as a surface renewal mechanism rather than a stagnant boundary layer. We expect these results can improve the estimation of gas exchange in eutrophie systems, and have important consequences for the assessment of regional carbon budgets.Key words: Air-water gas exchange, Carbon dioxide, Chemical enhancement, Eutrophie lakes, Gas exchange velocity, hydration.
Quantifying accurate greenhouse gas (GHG) fluxes between the Earth's surface and the atmosphere bas been considered essential for planning for a sustainable future under global climate changes. Although inland waters occupy a small fraction (about 3%) of the Earth's surface (Downing et al., 2006), their contributions to the GHG fluxes, especially to important biogenic gases such as carbon dioxide (Battin et al., 2009; J. J. Cole et al., 2007) and methane (Bastviken et al., 2011; Rasilo et al., 2014), are comparable to those of terrestrial and ocean ecosystems. Current studies estimate that a significant amounts of carbon (1.4 to 2.1 Pg C y·1) is released to the atmosphere through gas exchange, and a part of the atmospheric carbon pool (0.1 to 0.3 Pg C y·1) is photosynthetically fixed in inland waters (Raymond et al., 2013; Regnier et al., 2013; Tranvik et al., 2009). These numbers are in the same order of magnitude of carbon sinks in terrestrial and ocean ecosystems (1.8 to 3.1 Pg C y·1 and 2.3 to 2.6 Pg C y·1, respectively) (Le Quéré et al., 2016; Regnier et al., 2013), and therefore inland waters are increasingly assumed to be critical components of carbon exchange with the atmosphere.
Diffusive gas exchange at the air-water interface occurs in all aquatic systems from small streams to the pelagic ocean (Maclntyre et al., 1995). Thus, a precise knowledge of gas exchange processes, which are regulated by physical, chemical and biological factors (DL Bade, 2009; Smith, 1985), is necessary for properly assessing carbon budgets at either regional or global scales (Donelan & Wanninkhof, 2002; Y. T. Prairie, 2008). In the case of important biogenic gases such as C02 and CH4, chemical considerations of gas exchange are closely linked to gas concentration gradients across the air-water interface, which are in part controlled by solubility of the gases and
biological processes that produce or consume them (D L Bade, 2009; Smith, 1985). Also, physical aspects of gas exchange are dependent upon bath near-surface turbulence in water (Jonathan J. Cole & Caraco, 1998; Vachon et al., 2010) and molecular diffusion of the gases (Donelan & Wanninkhof, 2002; Jaime et al., 1987), and the rates of gas exchange driven by these physical processes can be expressed as the gas exchange velocity (k) from Fick's law of diffusion. While gas concentration gradients can be easily obtained from precise measurements of actual gas partial pressures on either side of the air-water interface (Cole and Prairie, 2009), assessing physical processes is more complex, and k is relatively difficult to measure. So far, several mechanistic theories are available to describe the physical gas exchange processes. The two most common theories are the boundary layer model (Lewis & Whitman, 1924) and the surface renewal mode] (Danckwerts, 1951). Although these two ultimately yield the same mathematical formulation (Eq. 1 ), their basic assumptions are quite different. For the boundary layer model, it is assumed that the interfaces at the water surfaces consist of thin boundary layers (sub-millimeter in thickness) through which molecular diffusion takes place (Figure 1.7a). On the other band, the surface renewal model describes the surface water as being influenced by turbulent eddies that bring water from undemeath, and hence this water interface layers are periodically renewed (Figure 1.7b). Based on these theories, most approaches to estimating k use empirical relationships with physical parameters such as wind speed (JonathanJ. Cole & Caraco, 1998), wind and ecosystem size (Vachon & Prairie, 2013), and buoyancy flux models (Maclntyre et al., 2010; Tedford et al., 2014), which influence turbulence near the air-water interface.
0.1 Problem statement
The majority of global lakes are supersaturated in dissolved C02 and CH4, as a result of high respiration rates and significant extemal inputs of organic carbon from adjacent terrestrial ecosystems along with soil and groundwater, resulting in effiux of these gases to the atmosphere (Ask et al., 2012; Bastviken et al., 2011; Jonathan J. Cole et al., 1994; Duarte & Prairie, 2005; Sobek et al., 2005). In these cases, the empirical parameters for estimating k that are mentioned above have been shown to work reasonably well and are often sufficient to provide accurate estimates. However, in eutrophie lakes, although the raie of lake metabolism in lake C02 dynamics can vary widely (Bagard & Giorgio, 2016), C02 undersaturation is prevalent especially during the summer growing season due to primary production subsidized by nutrient enrichments (Balmer & Downing, 2011; Del Giorgio et al., 1999). Consequent C02 uptake by phytoplankton results in high pH values, and these lakes often absorb atmospheric C02 (Balmer & Downing, 2011; Pacheco et al., 2014). In these cases, physical regulation of non-reactive gases such as CH4 remains unchanged and the parameters for estimating k can be also used to obtain the rates of flux. On the other hand, more complex physical and chemical processes are responsible for C02 regulation. Under high-pH conditions, diffusive C02 exchange can be enhanced by chemical reactions of C02 with hydroxyl ions (Emerson, 1975; Hoover & Berkshire, 1969). Since Bo/in ( 1960) first described chemical enhancement of C02, several experimental and theoretical model studies (Emerson, 1975; Hoover & Berkshire, 1969; Kuss & Schneider, 2004; Smith, 1985) have been performed to confirm the magnitude of chemical enhancement (expressed as a chemical enhancement factor, a). However, most measurements of chemically enhanced diffusion were conducted with tank experiments in laboratories, and only a few measurements came from actual field
samplings. So far, in many studies of gas exchange,
a.
has been calculated mostly using the theoretical model described by Hoover and Berkshire ( 1969) nearly half a century ago. It is because their model only requires the input of wind speed, temperature and pH of surface water and hence is easily applicable. However, several field studies showed poor agreement between the observed a and the model predictions ( e.g. Wanninkhof and Knox, 1996; Bade and Cole, 2006). This implies the tank experiments are probably a poor approximation of what is happening in real lake systems. Furthermore, none ofthem statistically demonstrated the discrepancies, and the actual chemical enhancement rates are still poorly tested.0.2 Review of the current scientific knowledge
0.2.1 Gas exchange at the air-water interface
In lake systems, pathways that mediate gas flux with the atmosphere involve diffusive gas exchange at the air-water interface, bubble ebullition from lake sediment, and transport through aquatic plants (Figure 0.1) (Bastviken et al., 2004; Maclntyre et al., 1995). The main pathway of C02 exchange differs from that of CH4 because of their different solubility in water (mole fraction solubility of7.07 x 10-5, 2.81 x 10⁻⁵ at 20 °C, respectively). While molecular diffusion is the main mode of C02 exchange with the atmosphere, bubbles of methane are easily formed in the water colurnn (Delsontro et al., 2010; Walter et al., 2007), and recent studies have shown the potential importance ofmicrobubble-mediated gas exchange in CH4 flux (McGinnis et al., 2015; Y. T. Prairie & del Giorgio, 2013). However, significant amounts of CH4 that reaches upper layer of the water column is emitted through molecular diffusion to the atmosphere (Bastviken et al., 2011; Rasilo et al., 2014; Raymond et al., 2013), and therefore, diffusive gas exchange bas been generally considered as a key pathway of carbon flux at the air-water interface. Diffusive flux ofC02 and CH4 can be adequately described from a Fickian diffusive process as follows:
Flux= kx X Kh(pXwater - PXair)
where x is the particular gas, k is the gas exchange velocity, Kh is the Henry's coefficient for correcting temperature and salinity of water, and PXwater and PXair
are the gas partial pressure in the water surface and air, respectively. Each gas species can have different diffusion coefficients depending on water temperature, and it can ultimately influence k. Thus, for empirical comparison of different gases, k can be normalized to a k6oo, which is the Schmidt number of C02 at 20 °C in freshwater (Jahne
et al., 1987; Wanninkhof, 1992). The k of a particular gas, x (kr) at a Schmidt number of 600 (k6oo) can be described as follows:
Where Scx is the Schmidt number of a particular gas, x, at a given temperature, and 11
is the dimensionless Schmidt exponent to represent the water surface condition. In lakes system, 11 can be determined depending on wind speed (11
=
2/3 for smooth surface conditions when a normalized-wind speed at a reference height of 10 m, U 10, is less than 3.7 mis, or 11=
1/2 for rough surface conditions when U10 is more than 3.7 mis) (Jahne et al., 1987).On average, the recent global atmospheric C02 is estimated at 402 ppm and that CH4 is 1.8 ppm (Dlugokencky and Tans, 2016). While these values are relatively constant, the dissolved concentrations of the gases in water surface can vary dramatically depending on Jake types such as the depth or area of lakes, and trophic status (Balmer & Downing, 2011; Duarte & Prairie, 2005; Juutinen et al., 2009). The range of lake pC02 was between 17 and 65,250 µatm (mean 1,287 µatm) in the global data set of Sobek et al. (2005). Also, surface water pCH4 varied from 6 to 3,612 µatm (mean 191 µatm) in the large sumrner-data set of Rasilo et al. (2014). Consequently, water pC02 and pCH4 regulate the magnitude of flux of the gases, together with gas exchange velocity.
In lake systems, k can be directly calculated using several techniques including inert gas tracers such as sulfur hexafluoride (SF6) (Jonathan J. Cole & Caraco, 1998), eddy covariance (Baldocchi, 2003 ), or floating chambers (Vachon et al., 2010). In addition, k can be determined from a reliable relationship with near-surface turbulence. As measurement techniques continue to be developed, turbulence can be directly obtained with modem instruments such as Acoustic doppler velocimeters (ADV) (Vachon et al., 2010). If such measurements cannot be performed, k can be also
estimated from other physical characteristics that correlate with turbulence. For example, recent studies have presented several empirical models to estimate k with parameters related to turbulence such as wind speed (Jonathan J. Cole & Caraco, 1998; Crusius & Wanninkhof, 2003; Vachon et al., 2010), wind shear and convection (Read et al., 2012), wind and ecosystem size (Vachon & Prairie, 2013), and wind shear and cooling (J. J. Heiskanen et al., 2014). However, under low wind conditions, factors other than wind can also regulate k. For example, k can be affected by buoyancy flux under low wind conditions overnight (Maclntyre et al., 2010). Also, during long periods of low wind in Amazonian lakes, enhanced k resulting from latent heat and sensible heat was reported by Polsenaere et al. (2013).
Figure 0.1. Main pathways that mediate C02 and CH4 flux with the atmosphere in lake system
ln lake systems, pathways that mediate gas flux with the atmosphere involve diffusive gas exchange at the air-water interface, bubble ebullition from lake sediment and transport through aquatic pl ants.
0.2.2 Lake eutrophication and C02 flux
Photosy11t/zesis and e/evate,l pH - Dissolved inorganic carbon (DIC) system in lakes consists of aqueous C02 (dissolved free C02 and the carbonic acid, H2C03), the bicarbonate ion (HCOJ°) and the carbonate ion (Coi-), which are all in approximate equilibrium. The relative proportions of each component can be an important regulator of water pH (J J Cole & Prairie, 2009). For example, aqueous C02 is present in large quantities at a pH less than 6.3, HC03- is the predominant species between pH 6.3 to 10.3, and the relative proportion of
coi-
is large at a pH more than 10.3 (Stumm and Morgan, 1996). In lakes, biological processes such as photosynthesis and respiration by phytoplankton can be related to the extensive range of the water pH by consuming or supplying C02 as follows:Above pH 6.3 where bicarbonate is the dominant species, HCOJ° is also available for photosynthesis, and the reaction becomes as follows:
The conversion of aqueous C02 to particulate organic matter by photosynthesis can raise water pH, and thus eutrophie systems where extreme photosynthesis exists can be often higher in pH (Darren L. Bade & Cole, 2006; Talling, 2010).
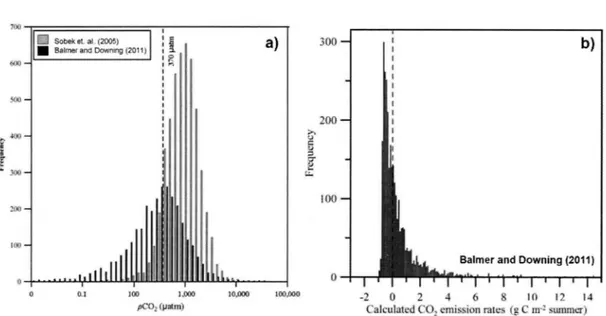
E11trop/zicatio11 a11d C02 ÏlljlllX - As eutrophication increases, inland waters in temperate region tend to have less pC02 because of nutrient (phosphoras and nitrogen) driven high primary productivity (Balmer & Downing, 2011; Crawford et al., 2016; Grasset et al., 2016). Thus, the eutrophie systems can emit less C02, and often become net sinks for C02 (Pacheco et al., 2014). Balmer and Downing (2011) showed that pC02 values in a large number of eutrophie lakes were significantly lower than those from global data set of Sobek et al. (2005), which were taken in oligotrophic to mesotrophic lakes (Figure 0.2a). Also, they obtained negative C02 emission rates in
most of their sampling sites during the summer, indicating the possibility that eutrophie lakes often actas net atmospheric C02 sinks (Figure 0.2b).
700 6()0 j()I) ~ JOO f
l
J-00 '.!00 100 ~ 0 1 ~ Sobeket al (2005) :, lî• sauner a,><1 Downing (2011 ) !.
1 p. ,,., 1 1 1 1 1 1 1 1 1 0.1 100 1.000 pC01(µatm) a) 10.000 100.000 JOO b) 200 100
Balmer and Downing (2011)
0
-2 0 2 4 6 8 10 12 14
Calmlated CO~ cmission raie (g C m·l summcr)
Figure 0.2 Surface water pC02 dynamics in Jake systems
Results of Balmer and Downing (2011 ). ( a) Frequeney distribution of estimated pC02 values. The pC02 values of dark grey (n = 3,049) were collected in agrieulturally eutrophie lakes by Balmer and Downing (2011), and that oflight grey (n = 4,902) were taken from the world lakes dataset of Sobek et al. (2005). (b) Caleulated carbon emission rate in the eutrophie lakes (n=l 31) during summer. The dashed line represents atmospheric equilibrium, and the median is -0.1 indicating net atmospheric C02 uptake.
0.2.3 Chemical enhancement of C02
C02 hytlration ami enhancetl gasjlux-Diffusive gas exchange ofC02 is different from that of other low-soluble gases because of its chemical characteristics. When C02 dissolves in water, it undergoes hydration through two chemical reactions as follows:
The reaction of C02 with water to form H2C03, which is a weak acid that dissociates immediately into bicarbonate, is prominent for pH ~ 8 and does not significantly increase C02 diffusion in natural waters. However, the ionic reaction of C02 with hydroxyl ion to form HCOJ° is believed to enhance C02 diffusion into the water surface layer several times (DL Bade, 2009; Bolin, 1960). The rate of chemical enhancement (termed chemical enhancement factor) increases with increasing pH and temperature, and is inversely related to the surface turbulence (Maclntyre et al., 1995; Stumm and Morgan, l 996). Several experimental and theoretical model studies (Darren L. Bade & Cole, 2006; Emerson, 1975; Hoover & Berkshire, 1969; Kuss & Schneider, 2004; Smith, 1985; Wanninkhof & Knox, 1996) have been conducted to quantify chemical enhancement of C02 at either a seawater surface and a freshwater surface. Because of low pH (normal range 7.7 to 8.2) (Taylor & Fenchel, 2011) and strong turbulence of seawater, chemical enhancement of C02 is negligible over the ocean (Smith, 1985; Emerson, 1995; Wanninkhof and Knox, 1996) except in equatorial regions where surface water temperature is high under low wind speed (U10 ~ 3m s-1) (Boulin and Etcheto, 1995). However, inland waters have a wide variation in water chemistry, and pH of eutrophie lakes can reach up to 11 (Balmer & Downing, 2011; Jeppesen et al., 1998). Particularly, during extreme photosynthesis, surface water often become undersaturated in C02, and pH can be relatively elevated. Thus, the influx rates of atmospheric C02 are more likely to be intensified by chemical enhancement (Smith,1985; Emerson, 1995; Kuss and Schneider, 2004; Bade and Cole, 2006).
However, presently used models for estimating k from other physical pararneters (e.g. Cole and Caraco, 1998; Read et al., 2012; Vachon and Prairie, 2013; Heiskanen et al., 2014) don't account for chemically enhanced transfer. Consequently, k of reactive gases should be necessarily corrected with a theoretical chemical enhancement factor especially at high-pH conditions. For example, chemical enhancement factor can be added into the C02 flux equation (Alshboul & Lorke, 2015; Wanninkhof & Knox, 1996) as follows:
Flux= a X kco2 X Kh(pC02water - pC02air)
where ais the theoretical chemical enhancement factor,
Khis
the Henry's constant, and pC02 water and pC02 air are the partial pressures of C02 in water and air, respectively. In this formula, kco2 is the gas exchange velocity of C02 estimated from the models of k or calculated from k6oo, which is derived from a flux measurement of a non-reactive gas such as CH4, N20, and Rn (Jahne et al., 1987; Wanninkhof, 1992).Calcu/ation of Hoover and Berkshire- So far, in many studies, the theoretical
mode! of Hoover and Berkshire (1969) bas been often used to estimate the chemical enhancement factor (a) because of its simplicity. The calculation of Hoover and Berkshire can be described as follows (Hoover & Berkshire, 1969; Wanninkhof & Knox, 1996):
T
Expected a
=
T T[ (T - 1)
+ {
tanh [ (~ )o.sz] /(~ )o.sz }]
where T is defined as follows:[H+]2 T
=
l+
K1K2+
Ki[H+]Where [H+] is the hydrogen ion activity; [H+]
=
10-pH , K1 and K2 are the dissociation constants for the reactions between C02 and HCQ3-, and HCOf andcoi-,
respectively (Dickson & Millero, 1987). The r is a combination of reaction rate and is described as:
where
n
andn
are the hydration rate constants for C02 reacting with H20 and OH·, respectively (K. S. Johnson, 1982). The [OH-] is the hydroxyl ion activity and described as:- Kw
[OH ]
=
[H+]where Kw is the dissociation constant for water determined by the temperature. Also, D is the molecular diffusion coefficient for C02 (Jaime et al., 1987) and Z is the boundary layer thickness; Z = Dlkco2 and the kco2 is described as:
(2.07
+
0.215 x [wind speed (m/s)]l.7}kco2
=
3600In this calculations, Hoover and Berkshire utilized the Lewis and Whitman stagnant boundary layer model ( 1924 ). For the stagnant boundary layer mode 1, it is assumed that the water surfaces consist of the boundary layers where C02 molecular diffusion takes place. The C02 concentration is in non-equilibrium within the boundary layer while the concentration of C02 and carbon species are in thermodynamic equilibrium in the turbulent water body. They also assurned that the pH inside the boundary layer would be roughly same as that of the turbulent water body, resulting from fast movement of hydrogen ion and the acid buffering capacity in water. The mode} predictions of a can lead to a raised gas exchange by up to several-fold depending on pH and temperature in the range oflake waters under low turbulence conditions (Figure 0.3). For example,
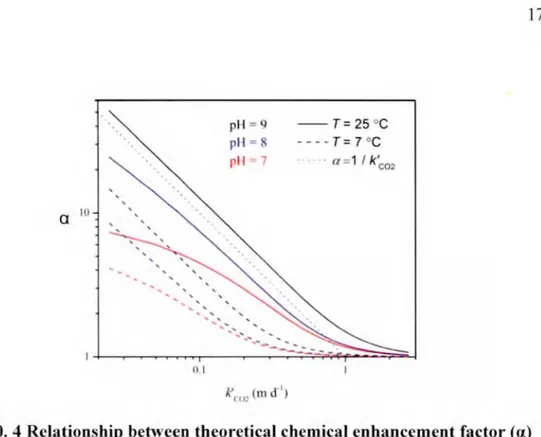
Alshboul and Lorke (2015) obtained a up to fourteen ( on average, four) using the theoretical model of Hoover and Berkshire (Figure 0.4). It led to enhanced C02 exchange up to fourteenfold beyond what would be expected from wind speed model of Cmsius and Wa1111i11khof(2003).
Discrepa11cies betwee11 theoretical ami observed a - In addition to
theoretically calculated a, it can be directly obtained by comparing the gas exchange velocity of a reactive gas (k6oO-enh) and that of a non-reactive gas (k600-11011) as follows:
Il
=
k600-enh / k600-nonFor example, a of C02 can be determined from the ratio of k6oo derived from C02 flux measurements (k600-c02) and that of CH4 (k6oo-CH4) or N20 (k600-N20) (Wanninkhof & Knox, 1996), which is non-reactive gas and have similar diffusion coefficient (1.91 x 10⁻⁵, 1.84 x 10⁻⁵, and 2.57 x 10⁻⁵ cm2/s at 25°C, respectively) (Jahne et al., 1987). Severa} experimental studies were performed to estimate a from the ratio of k using the floating chamber approach in lakes, and to compare them with theoretical a estimated from the model of Hoover and Berkshire. In the study of Wanninkhof and Knox (1996), k600-co2 was much higher than k6oO-CH4 and k6oO-N20 indicating enhanced C02 exchanges in four alkaline lakes where salinity was more than 5.2 g L-1 and pH ranged from 8.6 to 9 .8. In these cases, the observed a was larger than the theoretical prediction. On the other hand, for their freshwater experiments in Sterling Lake (salinity was O g
e
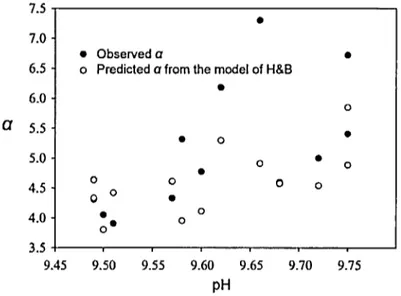
1 and pH was 5) and in the laboratory tank, k600-co2 was similar to k6oo-mo showing negligible chemical enhancement. In these cases, there were no discrepancies between the observed a and the theoretical a. However, it should be noted that the experimental tank was filled with acidified freshwater, and statistical analysis could not be applied due to lack of replication. Bade and Cole (2006) also investigated chemical enhancement of C02 in Peter Lake where increasing nutrient led to a decrease in total DIC and an increase in pH. During the summer, pH of the lake surface exceeded 9.5, and k600-co2 were higher than that of k6oO-CH4 (3.5- to 7.5-fold) indicating significant contributions of chemical enhancement to C02 influxes. In most of their cases, the observed a was larger than the theoretical prediction (Figure 0.5).a
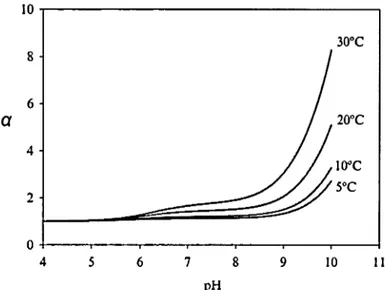
30°c 2D°C ID°C 5°C 0 -1----.----,..--...---.---~-~---1 4 5 6 7 8 9 10 11 pHFigure O. 3 Relationship between theoretical chemical enhancement factor (a) estimated from H&B model and pH for typical temperature
Result of Bade and Cole (2006). Relationship between theoretical chemical enhancement factor ( a) from the Hoover and Berkshire model (1969) and pH for typical temperature in Iakes under low turbulence condition (k6oo = 0.43 m d-1). The predicted chemical enhancement rates are a function oftemperature and pH.
Q IO ' ' ' ' . ' ' () 1 ' ' ' pH = 9 - -T = 25 °C pl 1 = - - - -T = 7 °C pl 1 7 a =1 / k'c02 k'w: (m d '
Figure O. 4 Relationship between theoretical chemical eohancemeot factor (a) estimated from H&B model and unenhaoced gas exchaoge velocity (k'co2) for
typical pH and temperatures
Result of Al. hboul and Lorke (2015). Relationship betwe n th oretica l chemical enhancem nt factor (a.) from the Hoo er and Berkshire mode! (1969) and unenhanced ga exchange velocity (k · 02) for three different pH and two different temp rature in re ervoir . The unenhanced gas exchange veloci t (k c02) wa estimated from k6nn, which is calculated from wind speed mode! of rusius and Wanninkho/(2003). When pH i 8 and 9. a tends to become conver ely related to k ' 02 (dotted line).
7.5
•
7.0
• Observed a
•
6.5 o Predicted a from the model of H&B
•
6.0 0a
5.5•
0•
5.0 0•
•
0 0 0 0 0 4.5 0 0•
4.0•
o• 0 0 3.5 9.45 9.50 9.55 9.60 9.65 9.70 9.75 pHFigure O. 5 Empirically observed a from chamber measurements and predicted
a from H&B model
Result of
Bade and Cole
(2006). Empirically observeda
from chamber measurements and predicted a from the model of Hoover and Berkshire (1969) related to pH at low turbulence conditions (on average k6oo-cm=
0.44 m d-1).0.3 Objectives and hypothesis
The main goal of this thesis is ta improve current understanding of C02 chemical enhancement, and better integrate them in air-water C02 flux estimates in eutrophie systems. Ta address this goal, the specific objectives are as follows:
First, we quantify the actual contributions of chemical enhancement to C02 fluxes between the air and water. Using a floating chamber approach, we investigate diffusive gas exchange of C02 and that of CH4, which does not react with hydroxyl ions in water. Tuen, chemical enhancement rates are obtained from the ratio of gas exchange velocities derived from C02 and CH4 fluxes. Field sampling is conducted in 23 lakes of Quebec ta estimate chemical enhancement rates under different trophic status, temperature, wind, and pH regimes, which influence chemical reaction of C02. Second, we examine any discrepancies that might exist between the observed
a in the field and that predicted from the calculation of Hoover and Berkshire ( 1969) ta verify the general applicability of the model, which is often used for C02 chemical enhancement estimates. We expect that eutrophie lakes among the sampling lakes are relatively undersaturated in C02 resulting in invasion of C02 into the lakes. As pH is elevated, gas exchange velocities of C02 are larger than those of CH4 showing significant contributions of chemical enhancement. Empirical evidence that the rate of C02 influx especially in calm conditions is much faster than that of C02 efflux was found from the laboratory of Prairie (Y. Prairie, 2015) and Kankaala (J. Heiskanen, 2015). Also, from previous experimental results of Wa1111i11khof a11d Knox ( 1996) and
Bade a11d Cole (2006), we expect discrepancies between the observed a and that predicted from the theoretical model especially under low-wind conditions (U10 < 3 m s·1). This phenomenon indicates that we can underestimate or overestimate the actual chemical enhancement and hence obtain incomplete C02 flux estimates.
Likely reasons for the discrepancies that might exist between calculated and observed values of a would be as follows:
First, some assumptions in the development of the chemical enhancement model of Hoover and Berkshire may be inappropriate. H&B utilized the stagnant boundary layer model (Lewis & Whitman, 1924). For the stagnant boundary layer model, it is assumed that the C02 concentration is in non-equilibrium within the layer while the concentration of C02 and carbon species are in thermodynamic equilibrium in the turbulent water body. However, H&B assumed that the pH inside the boundary layer would be constant and roughly same as that of turbulent water body. Contrary to their assumption, if boundary layer is non-existent or the pH of the boundary layer is different that of the turbulent water body resulting from atmospheric C02 absorption or C02 release to the atmosphere, the actual chemical enhancement that is driven by pH can be different than what we expect from the H&B theory. Therefore, in this study, we also explore the implications of using the surface renewal model (Danckwerts, 1951) as well as the thin boundary layer model to estimate the extent of chemical enhancement.
Second, enhanced gas exchange velocities of reference gas (k6oo-CH4) can decrease the observed a values. Recent studies have shown the potential influence of microbubble-mediated CH4 fluxes (Y. T. Prairie & del Giorgio, 2013; Rosentreter et al., 2016). Microbubble is a non-Fickian diffusive process, and the presence of a microbubble flux can increase the mass transport rates of CH4. It can lead to partially decrease observed chemical enhancement. However, from the previous studies, microbubbles are generated at the water surface by precipitation, wind induced breaking waves, or CH4 supersaturation (B.D. Johnson & Cooke, 1981; Y. T. Prairie & del Giorgio, 2013; Uchida et al., 2016). There is little to believe that it is pH driven. Therefore, we estimate contributions of microbubbles by comparing observed k6oo.CH4 and that estimated from the models using wind speed (Jonathan J. Cole & Caraco, 1998) and wind-Iake system size (Vachon & Prairie, 2013). If the observed k6oO-Œ4 is
higher than what we expect from the physical parameters, we can assume existence of microbubbles and estimate that contributions to higher k6oO-CH4.
We use the conclusions from these efforts to develop methods for improving the estimation of gas exchange in eutrophie systems.
ASSESSING THE CONTRIBUTION OF CHEMICAL ENHANCEMENT TO C02 EXCHANGE ACROSS THE AIR-WATER INTERFACE IN EUTROPHIC LAKES
OF QUEBEC
Jihyeon Kim and Yves T. Prairie
Département des Sciences Biologiques, Université du Québec à Montréal, Montréal, Canada
1.1 ABSTRACT
A detailed knowledge of gas exchange processes across the air-water interface oflakes is necessary for properly assessing carbon budgets at regional and global scales. In contrast with chemically non-reactive gases such as methane (CH4), nitrous oxide (N20) and radon (Rn), diffusive carbon dioxide (C02) exchange across the air-water interface can be enhanced by chemical reactions of C02 with hydroxyl ions (OH·), especially at high pH. In eutrophie Iakes where pH is relatively high, chemical enhancement is believed to be an important factor in driving C02 fluxes. So far, in many studies, the theoretical model of Hoover and Berkshire (1969) (H&B) were widely used to estimate chemical enhancement rates (a) for accurate estirnates of C02 flux. Although the H&B model was developed based on tank experiments nearly half a century ago, only few field-based measurements were provided to test their theory and the actual extent of chemical enhancement is still poorly tested. To address this issue, first, we quantified the actual contributions of chemical enhancement to air-water C02 fluxes by comparing measured gas exchange velocities derived from C02 (k6()o. c02) and from CH4 (k6()o-CH4) in 21 lakes of Quebec during the summer of 2015 and 2016. Second, we examined any discrepancies that might exist between the observed
a and that predicted from the H&B calculation to verify the general applicability of the model. In addition, we revisited several assumptions of the H&B model and explored implications of using different gas ex change mechanisms. In most lakes, there was no systematic difference between k600-c02 and k600-CH4 ( on average 2.1 and 2.2 m d"1, respectively), suggesting that chemical enhancement of C02 is not a significant contributor to air-water C02 flux over a wide range ofk6oo values. In addition, observed u were considerably Iower than H&B u (up to 7.4 times), indicating that the H&B model can overestimate chemical enhancement of C02, particularly in high alkalinity waters. Likely reasons for the discrepancy between observed and calculated values of u are: 1) some inappropriate assumptions of the H&B model, 2) enhanced gas exchange
velocities of reference gas (CH4), and 3) divergence between the experimental conditions in which the H&B model has been developed and actual field conditions. Our results also suggest that gas exchange may be more appropriately described as a surface renewal mechanism rather than a stagnant boundary layer. We expect these results can improve the estimation of gas exchange in eutrophie systems, and have important consequences for the assessment of regional carbon budgets.
Key words: Air-water gas exchange, Carbon dioxide, Chemical enhancement, Eutrophie lakes, Gas exchange velocity, hydration.
1.2 INTRODUCTION
Quantifying accurate greenhouse gas (GHG) fluxes between the Earth's surface and the atmosphere bas been considered essential for planning for a sustainable future under global climate changes. Lakes are now well known sites of GHG emissions to the atmosphere, especially important biogenic gases such as C02 and CH4, and one of the primary pathways is through diffusive emission (Bastviken et al., 2011; J. J. Cole et al., 2007; Holgerson & Raymond, 2016; Rasilo et al., 2014; Raymond et al., 2013). Diffusive gas exchange is regulated by physical, chemical and biological factors, and the dependency on these factors can be adequately described using the Fick's first law of diffusion as follows:
Flux= kx X Kh(PXwater - PXaïr) Eq.l
where x is the particular gas, k is the gas exchange velocity, Kh is the Henry's coefficient for correcting temperature and salinity of water, and PXwater and PXair
are the gas partial pressure in the water surface and air, respectively. Chemical considerations of gas exchange are closely linked to gas concentration gradients across the air-water interface, which are in part controlled by solubility of the gases and biological processes that produce or consume them (D L Bade, 2009; Smith, 1985). Also, physical aspects of gas exchange are dependent upon both near-surface turbulence in water (Jonathan J. Cole & Caraco, 1998; Vachon et al., 2010) and molecular diffusion of the gases (Donelan & Wanninkhof, 2002; Jahne et al., 1987), and the rates of gas exchange driven by these physical processes can be expressed as the gas exchange velocity (k). While gas concentration gradients can be easily obtained from precise measurements of actual gas partial pressures on either side of the air-water interface (Cole and Prairie, 2009), assessing physical processes is more complex, and k is relatively difficult to measure. So far, several mechanistic theories are available to
describe the physical gas exchange processes. The two most common theories are the boundary layer model (Lewis & Whitman, 1924) and the surface renewal model (Danckwerts, 1951 ). Although these two ultimately yield the same mathematical formulation (Eq. 1 ), their basic assumptions are quite different. For the boundary layer model, it is assumed that the interfaces at the water surfaces consist of thin boundary layers (sub-millimeter in thickness) through which molecular diffusion takes place (Figure 1.7a). On the other band, the surface renewal model describes the surface water as being influenced by turbulent eddies that bring water from undemeath, and hence this water interface layers are periodically renewed (Figure 1.7b). Based on these theories, most approaches to estimating k use empirical relationships with physical parameters such as wind speed (Jonathan J. Cole & Caraco, 1998), wind and ecosystem size (Vachon & Prairie, 2013), and buoyancy flux models (Maclntyre et al., 2010; Tedford et al., 2014), which influence turbulence near the air-water interface.
In eutrophie lakes, although the role oflake metabolism in lake C02 dynamics can vary widely (Bogard & Giorgio, 2016), C02 undersaturation is prevalent especially during the summer due to extreme primary production subsidized by nutrient enrichments (Balmer & Downing, 2011; Del Giorgio et al., 1999). Consequent C02 depletion in surface water results in high pH values, and in these cases, more complex physical and chemical processes are responsible for the air-water C02 flux regulation than other gases such as CH4, N20, and Rn. Under high-pH conditions, instead of just diffusing, C02 can react directly with hydroxyl ions (OH·) within the water-side surface boundary layer (Bolin, 1960).
C02
+
OH- H HC03- Eq. 2This chemical reaction increases the C02 gradient between the air and water, and then the absolu te value of C02 flux is believed to be enhanced beyond the flux derived from diffusion process (Emerson, 1975; Hoover & Berkshire, 1969). Therefore, at high pH,
the air-water C02 flux can be described with the rate of chemical enhancement (expressed as a chemical enhancement factor, a) as follows:
Flux= kc02 X a X Kh(pC02water - pC02air) Eq. 3
where kc02 is the gas exchange velocity of C02, Kh is the Henry's coefficient for correcting temperature and salinity of water, and pC02water and pC02air are the gas partial pressure of C02 in the water surface and air, respectively. Since Bo/in (1960) first described chemical enhancement of C02, several experimental and theoretical model studies (e.g., Hoover and Berkshire 1969; Quinn and Otto 1971; Smith 1985; Keller 1994; Emerson 1995) have been performed to estimate a. So far, in many studies, the model of Hoover and Berkshire (H&B, 1969) has been widely used to calculate a
because it only requires the input ofboundary layer thickness, temperature, and pH of surface water and hence is easily applicable. Since the chemical reaction time is assumed to be proportional to the residence time of C02 molecules in the boundary layer, the magnitude of theoretical chemical enhancement is determined by the boundary layer thickness. Also, the pH and temperature of surface water, all of which adjust the equilibrium of three carbon species (C02, HCQ3-, and
coi-),
are determinants of a in their model. In diverse systems such as saline lakes (Duarte et al., 2008), hardwater lakes (Finlay et al., 2015; Wiik et al., 2018), and eutrophie reservoirs (Alshboul & Lorke, 2015), the theoretical a of H&B Ied to increases of C02 gas exchange by up to fourteenfold. However, although this model was developed based on tank experiments nearly half a century ago, only few field-based data were provided to test their theory and even showed poor agreement between observed a and the model predictions (Darren L. Bade & Cole, 2006; Wanninkhof & Knox, 1996). Furthermore, none of them statistically demonstrated the discrepancies, and the actual extent of chemical enhancement is still poorly tested. To address this issue, first, we quantified the actual contribution of chemical enhancement to the air-water C02 flux by taking field-based measurements in a suit of diverse lakes. a was empirically observed from the ratio between the gas exchange velocities estimated from the flux measurements oftwo different gases. One is C02 subject to chemical enhancement, and the other is CH4 not subject to that. Within the same floating chamber, the fluxes of two gases were measured simultaneously. Second, we examined any discrepancies that might exist between the observed a and the predicted a from the theoretical calculation of Hoover and Berkshire ( 1969) to verify the general applicability of the mode!. In addition, we revisited several assumptions of the H&B mode! and explored implications of using different gas exchange mechanisms.
1.3 MATERIALS AND METHODS
1.3 .1 Study area and sampling periods
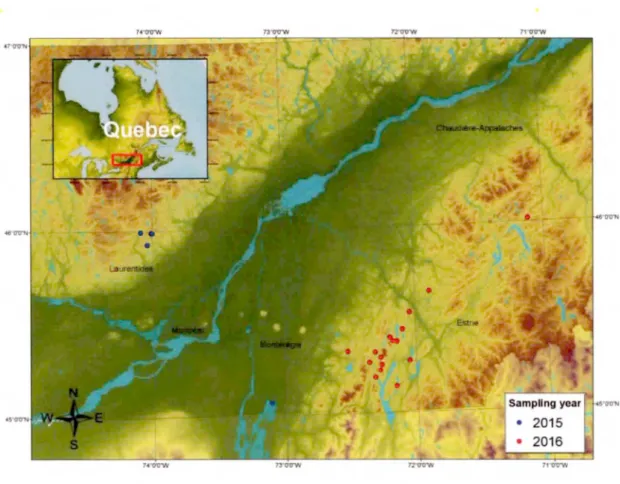
Samples weretaken in a total of21 lakes (area range 0.05 to 1269 km2).Among
them, 16 lakes in Eastern Townships region (-100 km east of Montreal) of Quebec were sampled in 2016. The other 5 lakes were sampled in Laurentide region (-50 km north of Montreal) and Lake Champlain in 2015 by Tonya Delsontro (Université du Québec à Montréal) (Figure 1.1 ). The lakes were selected to cover a wide range of chemical and physical conditions (i.e. pH, water temperature, wind speed, surface water pC02, and trophic gradients) based on the data of Galvez-Cloutier and Sanchez (2007) who worked on trophic status evaluation for 154 lakes in Quebec, and on the data of Prairie et al. (2002) who collected physical and chemical characteristics in lakes of the Eastern Townships region, in order to test the general applicability of the Hoover and Berkshire model (1969) in lake systems. Samplings were carried out in daytime during the summer to satisfy the conditions of low surface water pC02 and high pH in sampled lakes. Also, to remove any effect of precipitation on the gas exchange oftwo gases, all measurements were performed without rain.
Figure 1. 1 Map of sampled lakes
Map of temperate region of Quebec, showing the di stribution of the sampled lakes. The red solid circ les represent the locations of the sampled lakes in 20 16 (n
=
16), and the blue solid circles are those of20 15 (n=
5).1.3.2 Sample collection and Processing
The way we approached the problem is to compare the gas exchange velocities estimated from two different gases within the same measurement deployment. One is C02, subject to chemical enhancement, and the other is the gas, not subject to chemical enhancement, in our case, CH4. The empirical estimates of chemical enhancement rate (a) are, therefore, derived from the ratio between the gas exchange velocities (k6oo) of two gases, as follows:
Observed a = k600-eo2 I k6oO-CH4
To obtain the gas ex change velocities of two different gases, the air-water fluxes and surface water concentration of the gases were directly measured in each site. The fluxes of the two gases measured simultaneously, using a floating-chamber (volume: 15.48 L; area: 0.09 m2; water penetration: 6 cm) technique. The chamber was connected to the gas analyzer (LGR Ultraportable 915-0011) in an air-tight recirculating loop, and the partial pressure of C02 and CH4 (pC02 and p CH4, respectively) were simultaneously recorded every second for 5 minutes. The gas accumulation rate inside the chamber was computed by linear regression to estimate the gas flux for each sampling occasion. More than 95% of the chamber measurements for both gases had linear increases or decreases with R2
>
0.96, representing little evidence of bubble existence during the chamber measurements and little bias derived from the different measurement methods between two gases. In many studies, pC02 and pCH4 of surface water are commonly measured based on the headspace equilibration technique (K. M. Johnson et al., 1990). However, in cases of pC02 undersaturated systems with respect to the headspace gases (i.e. atmosphere), the physical shaking technique for making C02 equilibrium can cause negative pC02. It is because C02 molecules in the headspace can become hydrated with the sample water to form HCOJ°, and therefore, it can modify the equilibrium between C02 and HCOJ°. pC02 is one of critical component to calculateConsequently, in our study lakes, the usual headspace method is insufficient to precisely estimate the original water pC02. To selve this issue, we took into account the displacement of C02 in HC03- by incorporating the alkalinity of the sample water in the pC02 calculation. Tuen, gas exchange velocity (k) ofboth C02 and CH4 were as follows:
Flux of x
kx
=
---Kh X (pXwater - PXair)
Where x is a particular gas, Flux is the gas flux between the air-water interface (mmol nf2
a1),
Kh is the Henry's coefficient for correcting temperature and salinity of water for each gas, and PX water and PX air are the gas partial pressure (ppm) of each gas inwater surface and air, respectively. Then, the calculated kc02 and kcH4 were normalized with the Schmidt number of 600 to k600.co2 and k6oo-CH4, respectively.
Where
Scx
is the Schmidt number of a particular gas, x, at a given temperature, and 11 can be determined depending on wind speed. In lake systems, 11=
2/3 for wind speed <3.7 mis, or 11=
1/2 for higher wind speed than 3.7 mis (Jahne et al., 1987). Thefloating-chamber (FC) techniques are regularly and easily used to measure gas fluxes, but the empirical data of Matthews et al. (2003) and Vachon et al. (2010) indicated that chamber deployment could enhance the true flux by perturbing the air-water interface inside the chamber especially in calm and low turbulence condition. To correct chamber-induced overestimation, both k600.co2 and k6oO-CH4 were divided by the overestimation ratio of Vachon et al. (2010) and Prairie and del Giorgio (2013). However, it should be noted that the chamber-induced bias is possibly canceled when a is estimated from the ratio of k6oo since any perturbation affecting estimates of k600-co2 should also affect k6oO-CH4 in the same chamber.
. . . 54.30
+
10.491 log10 êwOverestimatwn ratw =
66_76+
15_0Bl log10 êwwhere êw is the turbulent kinetic energy (TKE) dissipation rate (m2 s-3) for lake systems, and the base-10 logarithm of êw can be expressed as log10 êw
=
-5.272+
0.114U10 from the empirical data to use the different effect of wind instead of TKE
dissipation rate (Y. T. Prairie & del Giorgio, 2013).
In addition, a was theoretically calculated based on the model of Hoover and Berkshire as follows (Hoover & Berkshire, 1969; Wanninkhof & Knox, 1996):
Expected
a
= [ { [
(T-1)+ tanh Cv)o.sz /Cv)o.sz rT T ] rT }] Eq.4where T is defined as follows:
Eq. 5
Where [H+] is the hydrogen ion activity; [H+]
=
10-pH , K1 and K2 are the dissociation constants for the reactions between C02 and HCOJ-, and HCOf and Co}-, respectively (Dickson & Millero, 1987). The r is a combination of reaction rate and described as:where
n
and r2 are the hydration rate constants for C02 reacting with H20 and OH-,respectively (K. S. Johnson, 1982). The [OH-] is the hydroxyl ion activity and described as:
where Kw is the dissociation constant for water determined by the temperature. Also,
D is the molecular diffusion coefficient for C02 (Jahne et al., 1987) and Z is the boundary layer thickness; Z = Dlkco2 and the kco2 is described as:
k _ {2.07+0.215x [wind speed (m/s)Jl.7)
C02 - 3600 Eq. 8
Since the chemical reaction time is assumed to be proportional to the residence time of C02 molecules in the boundary layer, the magnitude of theoretical chemical enhancement is determined by the boundary layer thickness. In this study, two empirical model (Jonathan J. Cole & Caraco, 1998; Vachon & Prairie, 2013) were used to estimate the boundary layer thickness. The pH and temperature of surface water, ail of which are considered as important regulators for chemical enhancement, were measured on each sampling site while the gas exchange velocities were obtained. The pH was measured using a portable pH meter (Metrohm Ltd, pH meter 913) fixed on a polystyrene board, so that the sensor probe would be consistently placed under 1 cm of water surface in order to minimize error in the pH measurements derived from causal effects from different depth.
1.3.3 Statistical analyses
Ali statistical analyses were performed using JMP software version 12.0 (SAS Institute, Inc.). Variables with non-normal distribution were log transformed to attain assumptions of normality. Linear regression and Pearson's correlations were used to describe the relationships between k600-co2 and k6oO-CH4, and H&B a and the observed
a. A paired t-test was applied to test for differences between H&B a and the observed a. We also assessed the differences in pH and observed a among the C02 in-gassing and out-gassing sites using nonparametric analyses of variances (Wilcoxon test).
1.4 RESULTS
1.4.1 Chemical and physical characteristics of sampled lakes
The 21 different lakes covered a broad range of pH, wind speeds, and water temperatures, all of which are considered as important determinants for estimates of chemical enhancement in the H&B model. Across the sampled lakes, pH ranged from 6.5 to 9.3 (mean = 7.9, median = 8.2, and interquartile range= 7.0 to 8.4; Figure 1.2a), wind speed (U10) ranged from 0.1 to 7.7 m s·1 (mean = 2.8, median = 2.7, and interquartile range= 1.4 to 3.3 m s·1; Figure 1.2b), and water temperature ranged from 19.4 to 28.8 °C (mean = 23.2, median = 23.1, and interquartile range= 20.5 to 25.3 °C; Figure 1.2c). Total phosphorus values of the lakes were also variable, ranging from 3 to 179 µg L·1 (mean = 29, median = 14, and interquartile range= 9 to 20 µg L·1; Figure 1.2d), showing a wide range of trop hic status from oligotrophic to hypereutrophic lakes. Total phosphorus was significantly correlated with surface water pH (R2 = 0.32, p = 0.0004).
1.4.2 C02 undersaturation and CH4 supersaturation
We obtained 60 measurements pairs ofC02 and CH4 fluxes and corresponding partial pressures from the sampled lakes over two summer field campaigns. Surface water pC02 ranged from 66 to 2132 ppm (mean = 632, median = 273, and interquartile range= 175 to 967 ppm; Figure 1.2e), with the air-water C02 fluxes ranging from -189 to 226 mmol m2 d·1 (mean = 4, median = -8, and interquartile range= -22 to 30 mmol m2 d·1; Figure l .2f). Surface water pC02 was significantly correlated with surface water pH (R2 = 0.84, p < 0.0001). 58% of surface water samples were undersaturated in C02 relative to the atmosphere (which was assumed to be around 402 ppm), and these lakes,
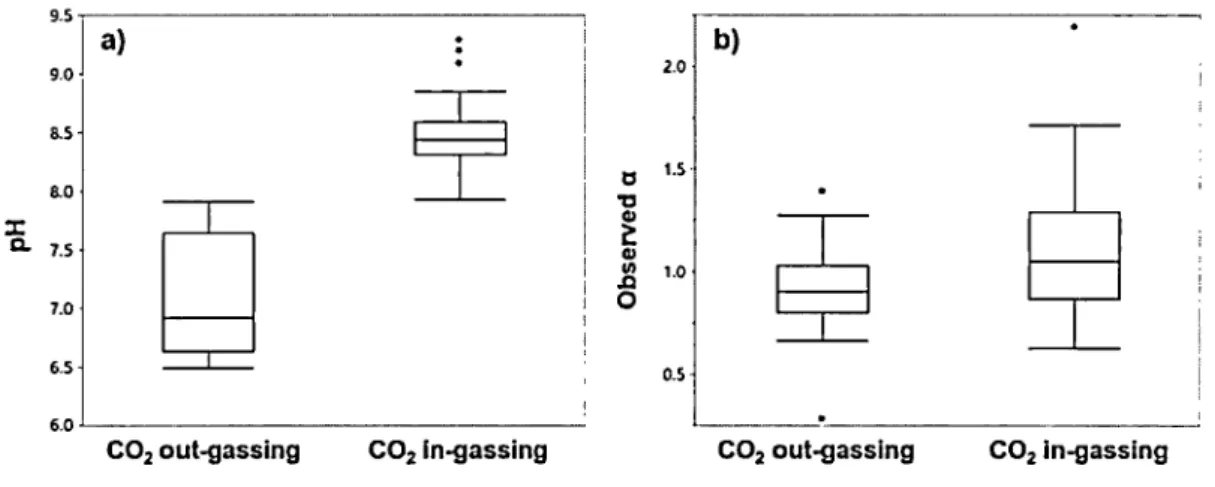
therefore, acted as net sinks of atmospheric C02. Unsurprisingly, the pH values of C02 in-gassing sites were significantly greater than those of C02 out-gassing sites (Wilcoxon test, p < 0.0001; Figure 1.3a). In contrast, all of our sampled lakes were highly supersaturated in CH4 relative to the atmosphere (which was assumed to be around 1.9 ppm), and the degree of supersaturation averaged 304-fold (ranged from 21 to 1939-fold).
9.5 a) 8.5 ~ - - L - - ~ Frequet1cy (n=60) 200
l
.'...J 150J
d) Frequency (n=34) 8 7 6 ,-.._ 5 'en b)s
4 ~ - -~ 0 ::5' 3 -2 0 Frequenc (n=60) 2000 \ [ 1500j
s
00 0 o. 1000 402 -e) Atmospheric0
pC02 0 - - - ' Frequen y (n=60) 28 ~ 26 - - ~~
(,l di 24 ~ ---' o. E ~ di 22 t--.--~~
c) 20 ---.---' 250 200 -b 150 c, 6 100 Frequency n=60) f) 0 8 50 - - ~ 8f
~ 0 - - ~-~- - ---c:: -50 ,--,--~6'
-100 ü -150 -200 Frequenc_ (n=60)Figure 1. 2 Cbemical and pbysical conditions of sampled lakes
Figure 1.2 illu trates the data di stribution of chemical and physical conditions of sampled lakes; a) surface water pH, b) wind speed (norrnalized to a reference height of 10 m, U10), c) surface water temperature, d) Total pho phorus, e) Surface water pC02 (the dashed line represents the average values of atmospheric pC02), and f) C0 2 flux acros the air-water interface_ On the right part of the e graphs, diamonds represent mean values, red lines are for median, and square boxes are fo r interquartile range of each pararneter.
9.5
j
a) b) 9.0 2.0~
8.5"
1.S' 8.0 'Cl :i:: QI~
C: Q. 7.5 QI Ill 1.0 .c 7.0 0 6.5 0.5 6.0 ---.
C02 out-gassing C02 in-gassing C02 out-gasslng C02 ln-gassing
Figure 1. 3 pH and observed a associated with C02 out-gassing and in-gassing
a) The pH values of C02 in-gassing sites were significantly greater than those of C02 out-gassing sites (Wilcoxon test, p < 0.0001 ), and b) The empirically observed
a
values of C02 in-gassing sites were slightly higher than those of C02 out-gassing sites (Wilcoxon test, p=
0.0201 ). However, the observeda
values of C02 in-gassing sites were not significantly different from 1.0 (One sample t-test, p > 0.0529).1.4.3 Relationship between k60C> derived from two different gases
In the combined dataset, k60o values derived from C02 (k:600.c02) and CH4 (k6oo-CH4) measurements varied from 0.2 to 14.9 m d-1 (mean = 2.1, median = 1.1, and
interquartile range= 0.6 to 1.9 m d-1) and from 0.2 to 17.2 m d-1 (mean = 2.2, median = 1.0, and interquartile range= 0.6 to 1. 7 m d-1), respectively. Exceptionally high values of kGOo of both gases (more than 10 m d-1) were obtained only from the large L. Champlain (1269 km2) at high wind conditions (U 10 > 3.7 m s·1). In all other sampled
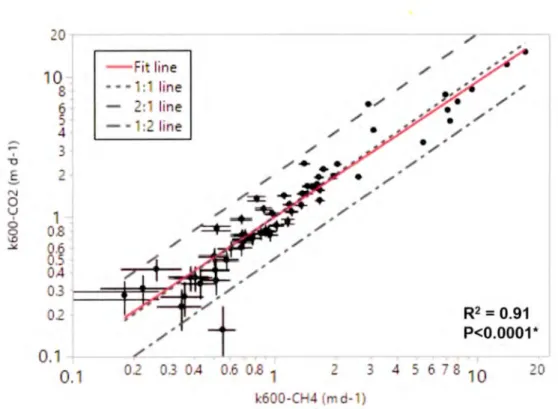
lakes k600-co2 and kwo-CH4 were less than 4.1 and 4.2 m d·1 (average 1.9 and 1.8 m d-1, respectively). k600.co2 and k600-c114 values were, as expected, very tightly correlated with each other (Figure 1.4; R2 = 0.91, p < 0.0001) and there was no evidence of systematic bias in the estimation of k6oo from the two different gases (slope and intercept are not significantly different from 1 and 0, respectively) and the discrepancies between the two were largely the result of measurement uncertainty (Figure 1.4). This suggests that high k6oo values for C02 were indicative of highly turbulent conditions and not chemical enhancement (Figure 1.4).
0 u ' 8 0 10 8 6 4 3 1 .8 0.6
o.
OA 3 0 0.1 0.1 / line line line line / / / / / / / / e / / / / / / O. 03 OA .6 .8 l 3 4 600-C 4 ( d- ) / / / -/ R2 = 0.91 P<0.0001 * 6 8 10 0Figure 1. 4 The relationship between the gas exchange velocity (k60o) estimated
from carbon dioxide (y axis) and methane (x axis)
Red line represents regression fit, dotted line is the 1 to 1 line, dashed line is the 2 to 1 line, and dashed-dotted line is the 1 :2 line. The error bars represent the standard deviation of k using the Taylor's expansion fo r the standard deviation of a ratio. Figure 1.4 illustrates k 600-co2 and k 6oO-CH4 were very tightly correlated with each other (R2
=
0.9 1, p < 0.0001).1.4.4 Discrepancies between observed a. and H&B a.
While the a. values estimated from the H&B model varied between 1.0 and 11.7 (mean = 2.1, median = 1.5, and interquartile range= 1.0 to 2.3), those empirically observed by comparing k6oo derived from two different gases only ranged from 0.3 to 2.2 (mean = 1.0, median
=
1.0, and interquartile range = 0.8 to 1.1 ). The observed a.values of C02 in-gassing sites were slightly higher than those of C02 out-gassing sites (Wilcoxon test, p = 0.0201; Figure 1.3b), in agreement with the previous study of Emerson ( 1995) and Keller (1994 ). It is because the pH of C02 out-gassing waters is much Jower than that of C02 in-gassing waters (Figure 1.3a), and the back-reaction of HCQ3- to C02 (dehydration of C02) is Jess efficient than the reaction of C02 to from HCQ3- (hydration of C02) (Keller, 1994). However, the observed a. values ofC02 in-gassing sites were uniformly low (mean = 1.1, median = 1.0, and interquartile range= 0.9 to 1.3) and not significantly different from 1.0 (One sample t-test, p > 0.0529), indicating Jittle to no chemical enhancement across the sampJed Jakes. Although we found a significant relationship between observed a. and H&B a. (Figure 1.5; R2 = 0.16, p < 0.0014), the observed a. was considerably lower than H&B a. in more than 88% of the cases (paired t-test, p < 0.0001 ). Expressed as a ratio (H&B a. : observed a.), the difference ranged from 0.6 to 7.4-fold (mean = 2.1, median = 1.7, and interquartile range= 1.3 to 2.3-fold). The observed a. values Jess than 1 were largely the result of measurement uncertainty (mean = 1.0, median = 1.0, and interquartile range
=
0.8 to1.1 ). Figure 1.6 implies that H&B a, as expected, increased with increasing surface water pH. However, observed a. values were independent of the pH, and especially at higher pH (from 8.3 to 9.3) where chemical enhancement should be most prevalent, the observed a values were consistently close to 1, showing negJigibJe chemical enhancement. Within the high pH range, the H&B model overestimated actual chemical enhancement rates by 1.3 to 7.4-fold (mean = 2.8, median = 2.3, and interquartiJe range= 1. 7 to 3.6-foJd).
10 8 7 6 5 3 ts
I
Fit line "O Q) 2 > '-Q) V\ ..0 0 1 - ··· 0.8 0.7 0.6 0. 5o.
0.3I
R2=0.16 P<0.0014* 0.2 1 2 3 t 5 6 8 10 H&BaFigure l. 5 The relationship between empirically observed chemical
enhancement (observed a, y axis) and that estimated from the Hoover and
Berkshire model (H&B a, x axis)
Red line represents regression fit, and dash d line represents 1 to 1 line. Obser ed a and H&B a were very correlated with each other (R2
=
0.16, p < 0.0014). Figure 1.5il lu trate the obser ed a was con id rably Jower than that H&B a in more than 88% of the ca e (paired t-test, p < 0.0001 ).
U10 (m s·1) 12
o.
18 - 1.86 1.86 - 3.19 3.19 - 7.76 1 1 - H&Ba 10 • Observed a 9 8 7a
6 5 4 3 2•
----·---..
--~ ·~-· • ... 0 6.5 7.0 7.5 8.0 8.5 9.0 9.5 6.5 7.0 7.5 8.0 8.5 9.0 9.5 6.5 7.0 7.5 8.0 8.5 9.0 9.5 pHFigure 1. 6 The relationship between the chemical enhancement factor (a) and
surface water pH
Blue line repre ent the hemical enhancement factor e timated from H&B mod 1, and dot represent those empirically observed from chamber measurements. Wbile H&B a increa ed with increasing surface water pH, ob erved a values were close to 1 (dashed li.ne), e en at higher pH (from 8.3 to 9.3) where chemical enhancement houJd be hi gher.