HAL Id: hal-01158149
https://hal.inria.fr/hal-01158149
Submitted on 1 Jun 2015
HAL is a multi-disciplinary open access
archive for the deposit and dissemination of
sci-entific research documents, whether they are
pub-lished or not. The documents may come from
teaching and research institutions in France or
abroad, or from public or private research centers.
L’archive ouverte pluridisciplinaire HAL, est
destinée au dépôt et à la diffusion de documents
scientifiques de niveau recherche, publiés ou non,
émanant des établissements d’enseignement et de
recherche français ou étrangers, des laboratoires
publics ou privés.
Distributed under a Creative Commons Attribution - NonCommercial| 4.0 International
License
From Views to Tags Distribution in Youtube
Stéphane Delbruel, François Taïani
To cite this version:
Stéphane Delbruel, François Taïani. From Views to Tags Distribution in Youtube. Middleware’14,
Dec 2014, Bordeaux, France. �10.1145/2678508.2678519�. �hal-01158149�
From Views to Tags Distribution in Youtube
Stéphane Delbruel
Université de Rennes 1, IRISA
[email protected]
François Taïani
Université de Rennes 1, IRISA - ESIR
[email protected]
ABSTRACT
Better understanding the geographic distribution of user generated content (UGC) can help design better distributed implementations of UGC systems. Although tags play a crit-ical role in many social media, their role in the geographcrit-ical distribution of UGC content has been little investigated. In this poster, we present some early work analyzing how the tags attached to a video relate to the geographic distribu-tion of a video’s views in a Youtube dataset, and hint at how such knowledge might be used to improve current UGC services.
General Terms
Measurement, Algorithm, Design
1.
INTRODUCTION
Streaming has grown to become one of the largest source of worldwide Internet traffic, with reports of video content accounting for up to 60% of an ISP’s load during peak pe-riods [5]. A large proportion of this traffic is caused by User Generated Content (UGC) services such as Youtube, Dailymotion, or Vimeo: in 2013 for instance, Youtube ac-counted for 18.69% of overall network traffic in North Amer-ica, 28.73% in Europe, and up to 31.22% in Asia [1]. Storing, processing, and delivering this amount of data poses a con-stant engineering challenge to both UGC service providers and ISPs. One of the main difficulties lies in the sheer num-ber of submitted videos these systems must process, most of which need to be served to niche audiences, in limited geographic areas [6, 2, 7]. Predicting where which video will be viewed is therefore particularly interesting for these sys-tems. Although some earlier works exist on this question, none have—to the best of our knowledge—considered how this problem could be addressed using the tags attached to videos. Tags capture elements of a video’s semantic, and therefore provide a particularly promising starting point to analyze how videos with related content may be viewed and distributed geographically.
Figure 1: Popularity map of Justin Bieber - Baby ft. Ludacris
In this poster, we present some early results on the rela-tionship between the tags of a video and where this video is viewed, hinting that tags maybe be used as predictive markers of a video’s viewing pattern. These results point at interesting research avenues on how UGC systems could be better distributed and improved.
2.
THE DATASET
We use a YouTube dataset collected in our research group in March 2011 [6]. The seed of the dataset are the 10 most popular videos in 25 different countries, obtained through Youtube’s public API. The dataset was then completed us-ing a breadth-first snowball samplus-ing of the graph of related videos, as reported by Youtube. For each crawled video, the dataset contains, among others, the video’s id, its title, its total number of views, a vector of integers representing the video’s popularity by country (the popularity vector for short, more on this below), and a set of descriptive tags pro-vided by the user who uploaded the video [4, 3].
The popularity vector of each video (noted pop(v)) cor-responds to the world map which was provided at the time by Youtube to indicate in which country a video was most popular. Fig. 1, for instance, shows the world map of the video with the most views in our dataset (Justin Bieber -Baby ft. Ludacris). Such maps used Google’s Map Chart service1, making it possible to extract for each country an integer—from 0 to 61—representing the video’s popularity in this country.
The original dataset contains 1,063,844 unique videos, but not all videos have a complete set of metadata. For the analysis presented here, we filter out all videos containing
1https://developers.google.com/chart/image/docs/
no tags (6,736 videos), or with an incorrect or empty pop-ularity vector. This filtering step results in a dataset with 691,349 videos, associated with 705,415 unique tags, totaling 173,288,616,473 views.
3.
TOWARDS TAGS’ GEODISTRIBUTIONS
The exact meaning of the popularity vector pop(v) is un-fortunately not documented by Youtube. This vector is how-ever unlikely to capture the proportion of a video’s views originating from individual countries. The maximum value by country is caped at 61, and is more likely to represent a trend in the country. In the video Justin Bieber - Baby ft. Ludacris for instance (Fig. 1), the USA and Singapore have the same value of 61, although this highly popular video can-not plausibly have been viewed as many times in the USA (pop. 318.5M) as in Singapore (pop. 5.4M).
To interpret pop(v), we take cue from Google Trends2,
one of the analytics services provided by Youtube’s parent company Google, and we consider pop(v)[c] to represent the intensity of video v in country c, i.e. a number proportional to the share of this video’s views in this country’s Youtube traffic:
pop(v)[c] = views(v)[c]
ytube[c] × K(v) (1) where views(v)[c] is the number of views of v in country c, ytube[c] is the total number of Youtube views in country c, and K(v) is a normalization factor, dependent of each video, to scale values in the range [0 − 61]. Neither ytube[c] nor K(v) are available to us. To estimate both, we use the distri-bution of Youtube traffic provided by Alexa Internet Inc.3, an authoritative source of Internet traffic, to approximate the distribution of Youtube views per country:
ytube[c] = pyt[c] × Tyt'pbyt[c] × Tyt (2) where pyt[c] is the proportion of Youtube views in country c
at the time our dataset was collected, Tytis the total number
of Youtube views at the same time, andpbyt[c] is the Youtube
traffic estimated by Alexa for country c. Using the total number of views per video (given by our dataset), and the above approximation, we can eliminate K(v) from (1), and reconstruct an approximation of views(v) from pop(v) and b
pyt.
To analyze the distribution of tags, we then derive for each unique tag t the number of views associated with t in country c (noted views(t)[c]), i.e. the aggregated number of views in country c of the videos containing t as tag.
views(t)[c] = X
v∈videos(t)
views(v)[c] (3)
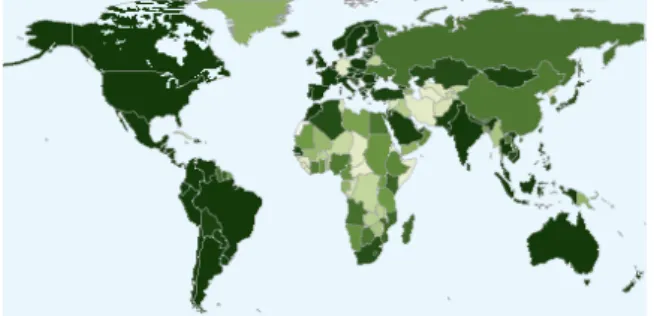
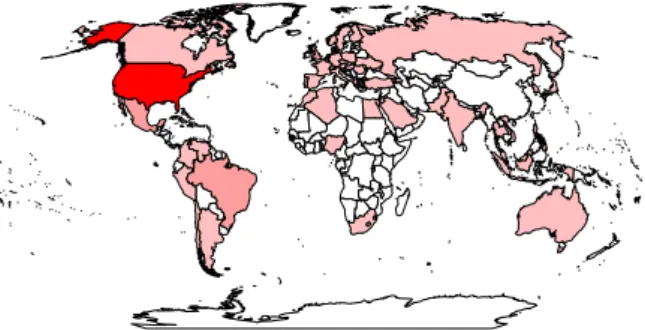
A manual analysis of views(t) reveals that some tags are mainly viewed in particular countries, as the tag favela in Fig. 3, while others are more uniformly distributed, as the tag pop (Fig. 2), the second most viewed tag in our dataset. This observation leads us to conjecture that the geographic distribution of a video’s views might be strongly related to that of its associated tags. In turn, this conjecture suggests that tags might help implement a form of proactive geo-graphic caching, i.e. predicting where a video will be con-sumed, based on the geographic study of its embodied tags, an avenue we plan to investigate in our future research.
2http://www.google.com/trends/ 3
http://www.alexa.com/
Figure 2: The tag ’pop’ tends to follow the world distribution of Youtube users.
Figure 3: Videos associated with the tag ’favela’ are mostly viewed in Brazil
4.
REFERENCES
[1] Global internet phenomena report: 2h 2013. Technical report, Sandvine Incorporated, 2013.
[2] A. Brodersen, S. Scellato, and M. Wattenhofer. YouTube around the world: Geographic popularity of videos. In WWW’12.
[3] G. Geisler and S. Burns. Tagging video: conventions and strategies of the youtube community. In 7th ACM/IEEE-CS joint Conf. on Digital Libraries, 2007. [4] S. Greenaway, M. Thelwall, and Y. Ding. Tagging
youtube - a classification of tagging practice on youtube. In 12th Int. Conf. on Scientometrics and Informetrics, 2009.
[5] F. Guillemin, B. Kauffmann, S. Moteau, and A. Simonian. Experimental analysis of caching efficiency for youtube traffic in an isp network. In Int. Teletraffic Congress, 2013.
[6] K. Huguenin, A.-M. Kermarrec, K. Kloudas, and F. Ta¨ıani. Content and geographical locality in user-generated content sharing systems. In NOSSDAV’12. ACM.
[7] S. Scellato, C. Mascolo, M. Musolesi, and J. Crowcroft. Track globally, deliver locally: Improving content delivery networks by tracking geographic social cascades. In WWW’11.