HAL Id: hal-00111383
https://hal.archives-ouvertes.fr/hal-00111383
Submitted on 19 Mar 2021
HAL is a multi-disciplinary open access
archive for the deposit and dissemination of
sci-entific research documents, whether they are
pub-lished or not. The documents may come from
teaching and research institutions in France or
abroad, or from public or private research centers.
L’archive ouverte pluridisciplinaire HAL, est
destinée au dépôt et à la diffusion de documents
scientifiques de niveau recherche, publiés ou non,
émanant des établissements d’enseignement et de
recherche français ou étrangers, des laboratoires
publics ou privés.
Thermomechanical properties of polycarbonate under
dynamic loading
V. Lerch, G. Gary, P. Hervé
To cite this version:
V. Lerch, G. Gary, P. Hervé. Thermomechanical properties of polycarbonate under dynamic loading.
Journal de Physique IV Proceedings, EDP Sciences, 2003, 110, pp.159-164. �10.1051/jp4:20020687�.
�hal-00111383�
Thermomechanical properties of polycarbonate under dynamic
loading
V. Lerch,
G. Gary1 and
P. Herve
Laboratoire d'Energetique et d'Economie en Energie, Universite Paris X,
1
chemin Desvallieres,92410
Vif/e-d'Avray, France1 Laboratoire de Mecanique des So/ides, Ecole Po/ytechnique, route de Saclay,
91128
Palaiseau, FranceAbstract - In the present study, dynamic compression tests have been performed on polycarbonate (PC) specimen for strain rates in the range of 500 to 2ooos·1 and on aluminum for a strain rate around 130os·1 using a Split Hopkinson Pressure Bar (SHPB). Temperature measurement has been carried out using a fast response infrared optical pyrometer which is able to measure the surface temperature rise of a specimen during the tests. The temperature data shows that the mechanical work is not completely converted into heat. It implies the existence of a stored energy within the material and possibly a subsequent delay for the conversion of mechanical work into heat.
Introduction
Plastic deformations generate work which is converted into heat. The subsequent temperature rise can induce a modification of the properties of material and more often a thermal softening. The equation of heat conduction [l] which relates the mechanical state (strain and stress) to temperature is given by:
apCPV''T-pCpt
=-/Jo-
·tP +kETatr(t• )/
(1
-
2v)(1)
where the "dots" indicate the differentiation with respect to time,
a
is the thermal diffusivity, p is the density, CE is the heat capacity, /3 is defined below, a is the stress,t
P is theplastic strain rate, K is the coefficient of thermal expansion,
E
is Young's modulus,T0
is theinitial or ambient temperature, t• is the elastic strain rate and v is Poisson's ratio. The first
term on the right represents heating due to irreversible plastic deformation and the second term represents heating due to the reversible thermoelastic effect. If elasticity is neglected and adiabatic conditions prevail, then the heat equation takes a more simple form and the conversion rate of plastic work into heat is given by :
/3=
pet
(2)(J"$P
The phenomena of mechanical dissipation of energy in metals have been known for a very long time. Taylor and Quinney [2] showed that approximately 90% of plastic work was transformed instantaneously into heat, the remainder being stored in the microstructure of the
1. Experimental procedure 1.1. Measuring mechanical properties
The technique we use allows the measurement of the conversion rate under adiabatic conditions [1] when there are no thermal exchanges between the specimen and the surrounding devices. It is then possible to investigate the effects of some parameters among those governing the loading, like the strain rate.
1.1.1. SHPB apparatu.s
The split Hopkinson pressure bar shown in
figure
1 is a well-established technique for high strain rate testing [4]-[5].Tlllle(µs)
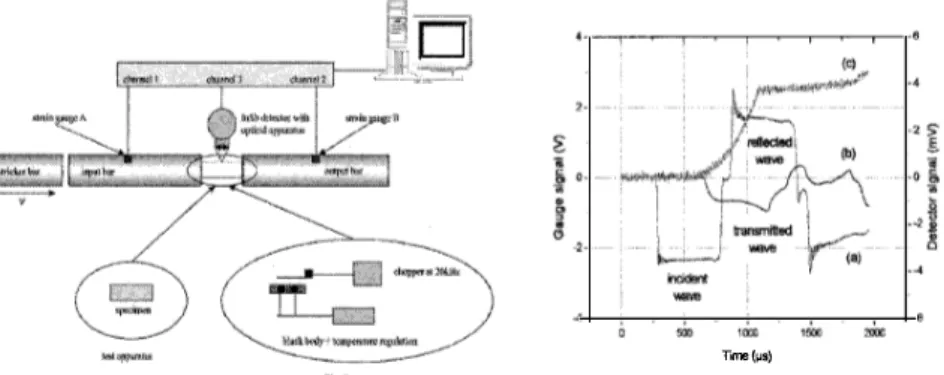
figure 1 : Scheme of the split Hopkinson bar with
optical pyrometer
figure 2 : Raw data for a test on polycarbonate
(a) incident and reflected waves, (b) transmitted wave and (c) temperature signal as
functions of time
The SHPB allows to measure the forces and the displacements applied to both faces of the specimen. In order to make a dynamic compression test ·with a SHPB, a short specimen is inserted between two bars with a higher yield stress than the tested material. Strain gauges are cemented to the bars. With the impact of a projectile (sticker), a longitudinal compressive elastic wave is induced in the incident bar (called the incident wave). A part of this wave is reflected at the bar-specimen interface (called the reflected wave), the other part is transmitted through the specimen and induces an elastic wave in the transmitted bar (called the transmitted wave). Such waves are shown in.figure 2.
The waves are known at points A and B, thanks to the recording of the corresponding longitudinal strain. They have then to be shifted to the bar ends in contact with the specimen. In our processing technique, this shifting takes account of the wave dispersion correction and uses an assisted precise delay setting based on the simulation of the elastic transient response of the specimen, as described in [6]. Let us call
e;(t), er(t)
ande,(t)
the corresponding waves, after the shifting process.The velocities and forces at both specimen faces are given by the following formulas [ 6] :
Finput(t)
=SbEb(e;(t) +er (t))
V,nput(t)
=-Cb(e;(t)-er
(t))Foutput(t)
=SbEbe,(t)
V output(t) =-Cbe,(t)
(3)where
Sb, Eb
andCb
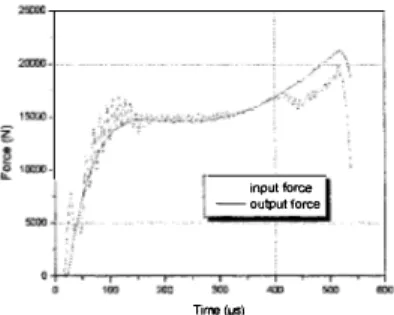
are the bar's cross-sectional area, Young's modulus and elastic wave velocity, respectively.Assuming then that stresses and strains are homogenous in the specimen, the average behavior of the material tested can be found. This assumption is checked by comparing input and output forces before going on
processing the test data. An example of the
equilibrium is plotted in figure 3 in the case
of a test for PC at 900s-1.
1.2. Temperature measurement
input force -outputforce
Time(µs)
figure 3
:
Checking equilibrium for apolycarbonate specimen : input and output forces
In order to record the temperature rise during the SHPB tests, we measure the radiation emitted from the specimen by optical pyrometry [7]. The method is noninvasive, the response time is short and the measurement is easily made at the surface of a radiating specimen. However, the signal produced by the detector is directly dependent on the surface emissivity of the specimen. Its value is often unknown, even at the early stage of the test, and may also depend on temperature, strain, surface finish, etc ... Moreover, we have to take into account the fact that the temperature for the low strains is close to the ambient temperature.
The theoretical signal from an infrared source over the spectral band of the pyrometer can be calculated by integrating the Planck distribution so that the output signal of the pyrometer is given by [7] :
(4)
where A is a calibration constant, n is the solid angle between the imaging system and the
detector,
S
d is the area of the detector, i-(A)
is the spectral transmissibility of the imagingsystem, r(l) is the spectral responsivity of the detector, s(l,8,T) is the spectral directional
emissivity of the specimen and L° (l,B
,
T)is the Planck spectral luminosity.Direct radiometric emissivity evaluations are made by measuring the radiances of a heated specimen and of a blackbody at the same temperature and under the same spectral and geometric conditions. The emissivity is computed as the ratio of the two radiances [8]. The figure 4 shows the results of emissivity measurements for specimens of PC : one undeformed and a other after a test at 900s-1. The emissivity depends on temperature and strain. As a first approximation, we consider that the emissivity varies linearly with the temperature and the strain and is given by :
s( B,T) = -l.9410-4T-{). ll l0-2s + 0.895 (5)
... : ... ��-�
__lu:d··�·!I
I
.. �-m�"'"'"
�
.
f�too�j
··-----
extrapolation,�+::::=::=;::::::;;::'...--;���-+�_j
20 «J 50 eo Temperature (°C}figure 4
:
Emissivity for polycarbonate asAccording to the bibliography, we can say that the emissivity of aluminum is equal to 0.25 and is almost independent of the temperature and the strain.
1.2.1. Experimental set-up l. 2.1.1. Detector
There exist several types of optical transducers available for the measurement of temperature. Important factors that influence the choice of a radiometer are time resolution, expected temperature range, materials involved in the experiments and size of the system. A single element, Indium-Antimonide (InSb), photovoltaic detector, with maximal responsivity in the 4 to 5.5µm wavelength region, was used in this study. The detector is mounted in a liquid nitrogen cooled dewar with a sapphire window. Since the detector is at 77K, the noise is significantly reduced. The detector area is a I mm diameter spot and its response time is in the order of one microsecond.
1.2.1.2. Imaging system
The pyrometer shown in
figure
1 has a spectral sensitivity range between1
and 5.5µm. The radiation of the transmitting surface is collected through a biconvex lens in fluorite (25.4mm in diameter and 25.4mm in focal distance). The distance between the detector and the lens and the distance between the lens and the emitting surface of the specimen are equal to twice the focal distance. This optical assembly optimizes the energy received by the detector from the lmm diameter spot of the specimen surface. The signal/noise ratio of the detector obtained \vith this optical assembly is maximum.1.2.2. Experimental procedure 1.2.2.1. Alignment
In order to measure the surface temperature, it is necessary to carefully focus the optical system on the specified surface region of the specimen. Before each test, a thin metallic pointer temporarily mounted on the optical system is used to define precisely the position of the focal point on the surface of the specimen placed between the bars.
1.2.2.2. Calibration
The calibration technique consists in heating the specimen up to a known temperature and measuring the pyrometer signal. After a series of SHPB tests, a black body
( e =
0.97) was placed between the SHPB at the same location than the specimen. Since the electronics are only sensitive to AC signals, a chopper wheel was used to produce a pseudo AC signal(figure
1calibration apparatus).
We simultaneously record the signal amplitude from the detector and the temperature of the black body which is measured by a K type thermocouple. The corresponding curve is showninfigure
5 which allows toUsing the calibration constant and the emissivity (5), we calculate the surface temperature (4) for PC and aluminum.
2. Results
Commercial polycarbonate (PC) cubes with section lOmm*lOmm and thickness of 6-Smm and a specimen of aluminum with section 8mm*8mm and thickness of 6mm were tested. The true compressive stress versus true strain curves are shown in figure 6 for PC and aluminum. This figure shows that the flow stress is dependent on the strain rate for PC. Two characteristics are observed : firstly, a rather large linear domain exists until a strain of 0.1. This domain is one order of magnitude greater than the typical linear elastic domain of metals. Secondly, following this linear domain, a pronounced softening domain is noticed up to a strain of about 0.3 beyond which the material shows strain hardening.
4.0>:1o" 3.0x1D' lij'2.s,:m•
!!,, i
2-0x10"� 1.5xm"
i 10xit:r' Alumirnm {a}: 1400s·' """'""""'" (b],700S' (c},1000s' (d"24005' (d) 0.0+-,�-���-��-�--i (l.0 02 0.8 1.0 1.2 H True strainfigure 6 : True stress-true strain plot at different strain rates for polycarbonate and
aluminum
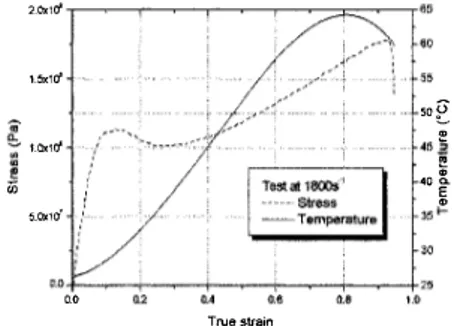
The temperature does not rise significantly below 0.1 strain (figure
7)
beyond which it rises steeply and levels off before dropping. This dropping is due to the fact that the specimen is not in the view field of pyrometer. For the test at a strain rate 1800s-1, the maximum of temperature corresponds to a true strain of 0.8. The curves showing the temperature rise versus plastic strain are shown in figure 8 for PC and aluminum. For PC, even at high strains, the temperature is lower than 75°C which is a smaller value than the melting temperature. This explains the lack of significant thermal softening for the test at 1800 s·1. In this case, the temperature rise does not seem dependant on the strain rate.� a. i!i iii 2_0x1cf 1.5xio' 1.ax1rf �.ox10-' O.O+--�--r---�---�-+ 0.0 True strain .,
soE
� 45,,2 � " 0. �351--figure 7 : True stress-true strain and temperature at a strain rate of 1800s-1for polycarbonate
e
70 • " " 00 il.�
"'/
;'·(a) (c) 0.6 0.8 1.0 Plastic strain -- -�--(d) twmrun (a) : 1400s·1 Polyca-(b)•700s' (c): 1aoos·' (d) : 2400S"'figure 8 : Temperature as functions of plastic strain for polycarbonate and aluminum
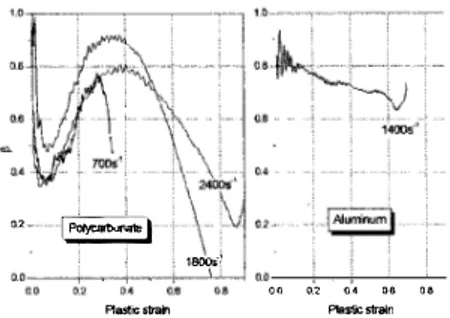
The fraction of plastic work converted into heat (f3) for PC and aluminum, plotted against plastic strain during uniaxial compression deformation is shown in figure 9. For PC, no significant observed dependence of p on strain rate was observed. During the test, the instantaneous conversion factor of plastic work into heat is first decreasing to a minimum and then increases. For a plastic strain of 0.1, 35% of the plastic work are instantaneously dissipated into heat. It implies that 65% of the remaining energy are stored in the material.
For aluminum, the fraction of plastic work converted into heat varies from 1to 0.7.
3. Conclusions
)�
02�
�
\
1aoos·1
oo 0.2 04 ae oe Plastic strain Plastic strain
figure 9: Fraction of plastic work converted
into heat as functions of plastic strain for polycarbonate and aluminum
This article presents a first evaluation the rate of conversion of plastic work into heat during a dynamic SHPB test on polycarbonate specimens. An infrared pyrometer has been developed which is capable of measuring specimen surface temperatures with a time resolution of about lµs. The single detector has been used to measure the temperature during compression loadings at strain rates up to 2000s-1. The experimental setup was capable of repeatable measurement of mechanical and thermal quantities. The temperature seems to be independent of the strain rate. The observed instantaneous conversion factor of plastic work into heat varies between 0.4 and 1 and there was no significant observed dependence of p on the strain rate. By comparison with aluminum , the typical evolution of the conversion factor for PC shows a thermal behavior providing an extra information that will help for a better further definition of the constitutive law.
References
[ l ] R. Kapoor, S. Nemat-Nasser, Determination of temperature rise during strain rate deformation,
Mechanics ofMateriaux, 27 (1998) 1-12.
[2] G. I. Taylor, H. Quinney, Latent heat remaining metal after cold working, Proc. R. Soc.
London, A l 63 (1937) 157-181.
[3] J. Hodowany, G. Ravichandran, A J. Rosakis, P. Rosakis, Partition of plastic work into heat
and stored energy in metals, Experimental Mechanics, 40 (2) (2000) 113-123.
[4] B. Hopkinson, Method measuring pressure deformation high explosive by impact bullets,
A213 (1914) 437-456.
[5] R. M. Davies, A critical study of the Hopkinson pressure bar, Philos. Trans. R. Soc. London,
240 (1948).
[6] H. Zhao, G.
Gary,
On the use of SHPB technique to determine the dynamic behavior of thematerials in the range of the smalls strains, International Journal of solids and structure, 33 (1996)
3363-3375.
[71 A Trojanowski, D. Macdougall and J. Harding, An improved technique for experimental
measurement of specimen surface temperature during Hopkinson-bar tests, Measurement Science and Technology 9 (1998) 12-19.