HAL Id: hal-02367361
https://hal.archives-ouvertes.fr/hal-02367361
Submitted on 17 Nov 2019HAL is a multi-disciplinary open access archive for the deposit and dissemination of sci-entific research documents, whether they are pub-lished or not. The documents may come from teaching and research institutions in France or abroad, or from public or private research centers.
L’archive ouverte pluridisciplinaire HAL, est destinée au dépôt et à la diffusion de documents scientifiques de niveau recherche, publiés ou non, émanant des établissements d’enseignement et de recherche français ou étrangers, des laboratoires publics ou privés.
Varun Yeachana, Christine Barrot, Lucien Baldas, Marcos Rojas-Cárdenas,
Nicolas Laurien, Stéphane Colin
To cite this version:
Varun Yeachana, Christine Barrot, Lucien Baldas, Marcos Rojas-Cárdenas, Nicolas Laurien, et al.. Investigations on acetone vapour photoluminescence for applications in molecular tagging techniques. International Symposium on Thermal Effects in Gas flows In Microscale - ISTEGIM 2019, Karlsruhe Institute of Technology, Oct 2019, Ettlingen, Germany. pp.ISTEGIM 2019 - 152927. �hal-02367361�
1
ISTEGIM 2019 - 152927
INVESTIGATIONS ON ACETONE VAPOUR PHOTOLUMINESCENCE
FOR APPLICATIONS IN MOLECULAR TAGGING TECHNIQUES
Varun Yeachana, Christine Barrot
1, Lucien Baldas, Marcos Rojas-Cardenas, Nicolas
Laurien, Stéphane Colin
Institut Clément Ader (ICA), Université de Toulouse, CNRS, INSA, ISAE-SUPAERO, Mines-Albi, UPS, Toulouse France
christine.barrot@insa-toulouse.fr
KEY WORDS
Molecular tagging thermometry, gas microflows, rarefied flows, fluorescence, phosphorescence.
1 INTRODUCTION
Recent decades have seen large technological advancements in fabricating microscale components, and this has led to the growth of microfluidics. Researchers in the last couple of decades have performed various experiments both in liquids and gases at microscale. Gas flows in microdevices are often subjected to rarefaction effects which are quantified by the Knudsen number, 𝑲𝒏 = 𝝀𝒎
𝑳𝒄, defined as the ratio of the mean free path 𝝀𝒎 over the characteristic length 𝑳𝒄of the device. Knudsen numbers between 10-3 and 10-1 correspond
to the slip-flow regime, which is encountered in most of the usual micro-components involving gas flows. In this rarefaction regime, the flow exhibits local thermodynamic disequilibria in the near-wall regions, leading to a velocity slip and a temperature jump at the wall. There is a considerable progresses in theoretical and numerical analysis of rarefied gas flows. However, this is not necessarily the case towards experimental investigation1,2. Very limited experimental data are available in this domain, particularly concerning local
measurements of velocity and temperature. It is then of high interest to develop novel experimental approaches capable of mapping local temperature and velocity profiles in gas microflows. Therefore, molecular tagging technique is a potential candidate in the experimental front.
In this study, we present the details of investigations carried out on photoluminescence of acetone vapour. As demonstrated in previous studies, phosphorescence of molecular tracers is of interest to measure molecular displacements and thus velocity fields3–6. Taking this aspect into consideration, the emphasis of our
experiments has been on the phosphorescence signal emitted by the tracer molecules in order to identified the main parameters that could affect this luminescent phenomenon. All the experiments were performed with pure acetone vapour at different conditions of pressure (1000 to 10,000 Pa) and temperature (298 to 348 K). The focus has been on the analysis of the phosphorescence intensity and lifetime dependency as a function of pressure and temperature. In order to verify the repeatability, large data set of experiments were performed as to identify: influence of air/ oxygen on phosphorescence, lifetime at different pressures and temperatures, forward and reverse cycling at same temperature, cycling with temperature variation. Moreover, fundamental experiments on obtaining the absorption coefficients of acetone at different excitation wavelengths were carried out. Based on the experimental data, de-excitation time constants for acetone vapour were estimated.
2
2 EXPERIMENTAL SETUP
An experimental set-up dedicated to molecular tagging velocimetry has been developed at Institut Clement Ader (ICA), Toulouse, France. More details of this setup are presented in previous works3–5. This
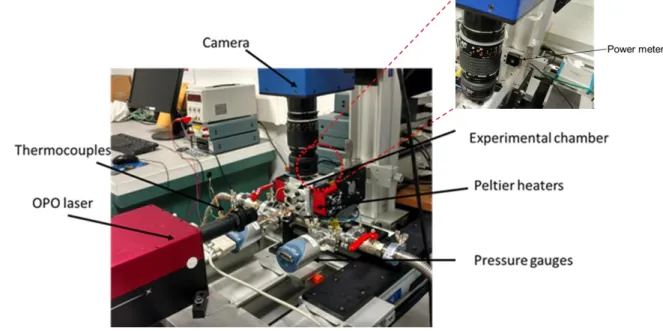
existing setup was adapted for temperature measurements. Figure 1 presents the photography of the MTT experimental setup adopted in this study. Broadly, the setup can be divided into two distinct parts: (1) a gas circuit and (2) MTT elements. Flow seeding and control of operating conditions are achieved with the elements constituting gas circuit: gas bottle, tracer reservoir and vacuum pump. The experimental chamber is filled with gas, its temperature is controlled by heating elements (Peltier heaters) and recorded by temperature sensors. MTT part is composed of an OPO laser used for molecular tagging, images are acquired by a Charge Coupled Device (CCD) camera coupled with an Intensified Relay Optics (IRO). The laser trigger, the camera shutter, and the IRO trigger are synchronized by a Programmable Timing Unit (PTU) connected to the data acquisition and processing system. The energy of the laser beam was continuously recorded at the exit of the chamber by a power meter.
Figure 1. Experimental setup with zoomed view showing the location of power meter
3 EXPERIMENTS
3.1 Influence of oxygen quenching on the phosphorescence signal
Even small leakages in the experimental chamber can introduce oxygen molecules in the system, which can interact with the excited acetone molecules. This results in the reduction of the lifetime of phosphorescence of acetone molecules. Therefore, presence of oxygen influences the de-excitation process and this can lead to erroneous conclusions about the experimental data, especially the relationship between temperature and phosphorescence lifetime.To demonstrate this, we carried out an investigation on signal quenching by oxygen at room temperature and excitation wavelength at 310 nm. In the experimental chamber, we maintained a constant partial pressure of acetone (Pac ~ 5000 Pa) and varied the partial pressure Pair of air. The main parameters that can be adjusted for each captured image are the delay time ∆𝑡𝑑𝑒𝑙𝑎𝑦 between the IRO trigger and the laser trigger, the IRO gate ∆𝑡𝑔𝑎𝑡𝑒, which is the duration of integration of the signal, the IRO
amplification gain G and the exposition time 𝑡𝐶𝐶𝐷 of the CCD detector. The final image is the result of Ni averaged images in which 𝑁𝑙 laser pulses have been integrated. The acquisition parameters are the following:
3
to study the signal evolution over time. The data on signal intensity from captured experimental images are fitted by a Gaussian function and the peak of the Gaussian curve is used to represent the signal intensity.
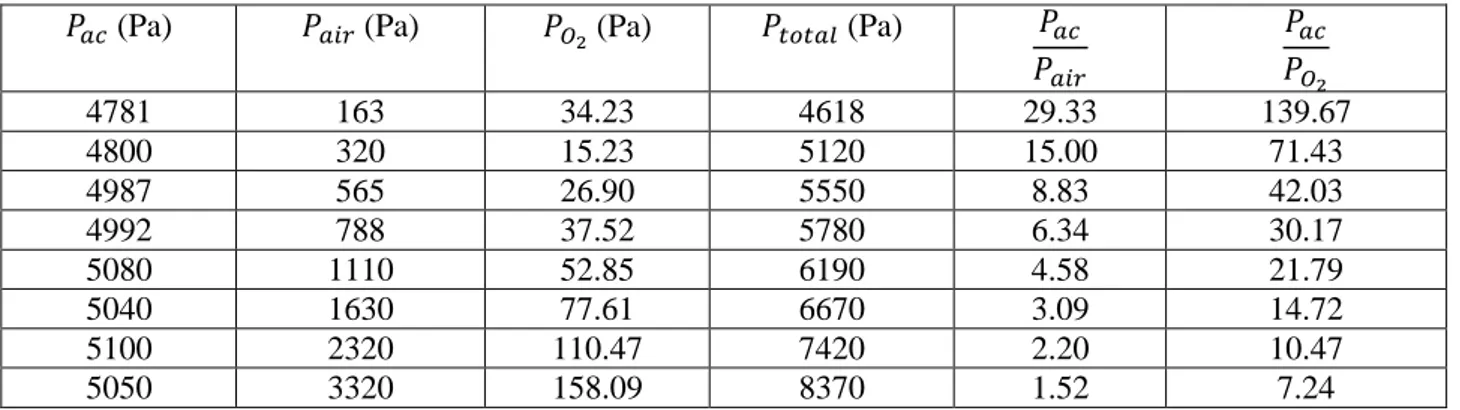
Table 1: Experiments on the influence of oxygen on signal quenching of acetone vapour
𝑃𝑎𝑐 (Pa) 𝑃𝑎𝑖𝑟 (Pa) 𝑃𝑂2 (Pa) 𝑃𝑡𝑜𝑡𝑎𝑙 (Pa) 𝑃𝑎𝑐 𝑃𝑎𝑖𝑟 𝑃𝑎𝑐 𝑃𝑂2 4781 163 34.23 4618 29.33 139.67 4800 320 15.23 5120 15.00 71.43 4987 565 26.90 5550 8.83 42.03 4992 788 37.52 5780 6.34 30.17 5080 1110 52.85 6190 4.58 21.79 5040 1630 77.61 6670 3.09 14.72 5100 2320 110.47 7420 2.20 10.47 5050 3320 158.09 8370 1.52 7.24
Table 1 shows the experimental conditions for oxygen quenching. It can be observed that the ratio of partial pressures of acetone and air, (𝑃𝑎𝑐/𝑃𝑎𝑖𝑟), varied from 29.33 to 1.52. Air has been assumed to be a mixture of
only nitrogen and oxygen, with the later contributing to 21% of partial pressure. Therefore, the ratio of the partial pressure of acetone and oxygen, (𝑃𝑎𝑐/𝑃𝑂2), varies from 139.67 to 7.24.
Figure 2: Lifetime curves of phosphorescence intensity of acetone vapour with the presence of oxygen at different conditions.
Figure 2 shows the lifetime curves for the set of data presented in Table 2 traduced by a decay of the intensity of light emitted by acetone molecules with time. Since oxygen and acetone occupy the same volume and are at the same temperature, the ratio of their number densities is identical to the partial pressure ratio. For the data shown in Figure 2, the pressure of acetone for every experiment is around 5000 Pa. It can be observed from Figure 2 that an increase in the partial pressure (or number density) of oxygen drastically reduces the intensity counts and then lifetime of de-excitation. Therefore, these experiments clearly demonstrate the role played by oxygen in quenching the signal.
3.2 Lifetime of pure acetone by varying pressure and temperature
Once we established that our experimental chamber was free from leakages, the next set of experiments focused on understanding the influence of pressure and temperature on intensity and lifetime of pure acetone vapour phosphorescence. Table 2 shows the conditions at which the experiments were carried out. For every
4
experimental condition shown in Table 2, the pressure corresponds to temperature at 298 K. The acetone vapour was introduced at these conditions and the lifetime experiments were performed. Thereafter, the acetone vapour was heated to 328 K and 343 K and we performed other set of experiments.
Table 2: Experimental conditions with acetone vapour excited at 310 nm.
Initial Pressure (Pa) Initial temperature (K) Heated temperature (K)
1,000 298 328, 343
3,000 298 328, 343
5,000 298 328, 343
10,000 298 328, 343
Since the volume of the experimental chamber is constant, heating the acetone vapour, induced a rise in the pressure, which was in close agreement with the predictions of ideal gas relation. The objective was to keep the number density constant in order to isolate the effect of temperature (from that of number density) on lifetime curves.
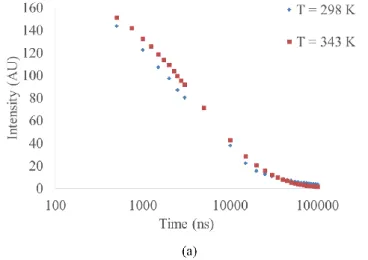
Figure 3: (a) Lifetime curve (on logarithmic scale) for acetone vapour at initial conditions of P = 10,000 Pa and T = 298 K. The same acetone vapour was heated to 343 K.
The experimental analysis revealed that at a fixed number density, for the temperature range investigated in our study, there is no significant variation of intensity with temperature. This observation was consistent for all pressures and temperatures investigated in this study. As an example, Figure 3 shows the lifetime curve for acetone vapour at P = 10,000 Pa and T = 298 K. The same vapour was heated to 343 K and then lifetime curve was obtained. It can be observed that the two curves are very close to each other.
The initial decay of acetone vapour phosphorescence closely approximates an exponential behaviour (Figure 2 and
Figure 3), which is very typical in photoluminescence processes7. However, after a particular delay time, the
slope tends to change, showing that a double exponential decay would be a better fitting function for the experimental data, which leads to two time constants. This double exponential behaviour of photoluminescence is a reflection of the phenomenon of the phosphorescence which evolves over time as a result of the decaying triplet state population7. A bi-exponential of the form shown in Equation (1) is used to fit the experimental data
5 𝑓(𝑡) = 𝑎𝑒−𝑡𝜏1+ 𝑏𝑒
−𝑡
𝜏2 (1)
The rapid decay components (left term) describe the early, strong emission and slow decay component (second term) describes the late, weak emission.
From our set of experimental data, we have extracted the two time constants : the smaller time constant (fast decay, 𝜏1) is of the order of 10 𝜇𝑠, as shown in Figure 4(a); the larger time constant (slow decay, 𝜏2) of the curve and is of the order of 200 𝜇𝑠 at 1000 Pa and 100 𝜇𝑠 at higher pressures, as shown in Figure 4(b). The reason for higher values of the slow decay time constants at 1000 Pa can be linked to the presence of lower number of triplet state populations compared to higher pressures. Due to the sensibility of the fitting function, the time constants obtained can vary, for example, it is between 6 to 12 𝜇𝑠 for the data of P = 1000 and 5000 Pa.
Figure 4(a) rapid decay time constant at 298 K, (b) slow decay time constant at 298 K
4 MODIFICATIONS TO THE EXPERIMENTAL CHAMBER 4.1 Modified experimental setup
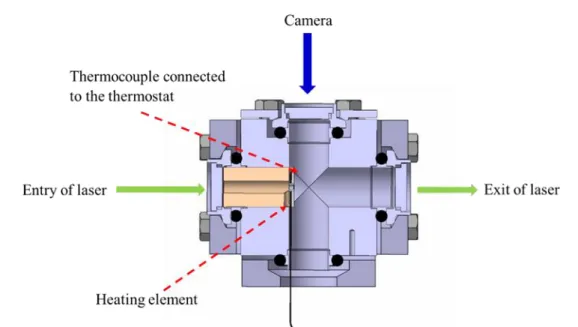
The analysis of the data obtained for the experimental conditions summarised in Table 2 shows that, for the range of temperature investigated, the influence of temperature itself is negligible for the phosphorescence emission. However, the intensity and lifetime of phosphorescence could be sensible to number density, which could provide an indirect way to estimate temperature variations from density variations, when pressure is known. Therefore, the effect of localised heating was studied. For this, the experimental chamber was changed by incorporating a heating element on a small plate inside the chamber as shown in Figure 5 and maintaining the chamber walls at a lower temperature. The temperature of the heating element was adjusted with the aid of a thermostat which could monitor and control the temperature with a thermocouple placed on the heating element.
6
Figure 5 Cross sectional view of the experimental chamber showing the positions of the heating element and the thermocouple and the direction of laser beam.
A local variation of temperature, and thereby density is expected, notably in the direction perpendicular to the heated element, i.e. in the direction of the laser beam. By tagging the region close to the heated element, it is possible to observe if the gradient of temperature – and consequently of density – generated along the laser beam influences the intensity captured. Due to the large volume of the chamber, the pressure is expected to stay constant during experiments.
4.2 Numerical simulations
Simple CFD simulations were performed in order to estimate the density and temperature gradients generated by the heating element in the chamber. The real experimental system was simplified as a four way cross as shown in Figure 6(a), so as to simplify the numerical analysis. The heating element is positioned as shown in Figure 6(b). Due to the symmetry involved in the design, only one half of the model was simulated. The heating element was modelled as a disk with a hole in the centre having a diameter of 2 mm which corresponds to the access for the laser beam in the real experiments. The heated element was maintained at 348 K. The simulation was carried with Ansys Fluent 18.2. The meshing option of inflation with progressive transition was employed. The geometry was meshed into 100381 nodes and 312086 elements. A viscous (laminar) based model with the fluid properties of acetone vapour was employed. A pressure based solver (including gravity) was used. For the solution methods, pressure – velocity coupling scheme was used. For the spatial discretisation, the following schemes were used: Gradient –least squares cell based, pressure – second order, for density, momentum and energy – second order upwind scheme.
7
Figure 6 (a) Schematic of the simplified geometry used to model the experimental chamber, (b) Symmetry plane with the presence of heating element
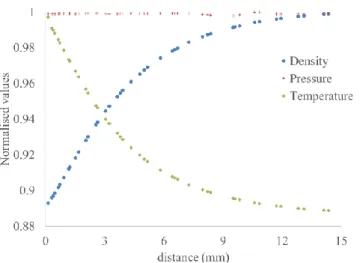
Figure 7 shows the normalised variation of the density, pressure and temperature along the line passing through the centre of the hole of the laser beam. It can be noted from this figure that close to the heating element, there is a sharp drop in the density near the vicinity of the heating element. Based on the previous experimental results, CFD simulations, and modified experimental chamber, further experiments were carried out to measure temperature gradients through the resulting gradient of number density, in an environment with controlled pressure.
Figure 7 Normalised values of the variation of the density, pressure and temperature at the centre of the hole of laser beam, obtained from simulations. The distance corresponds to the diameter of our optical access to observe the laser
beam. The heating element is located around 0 mm.
4.3 Experiments
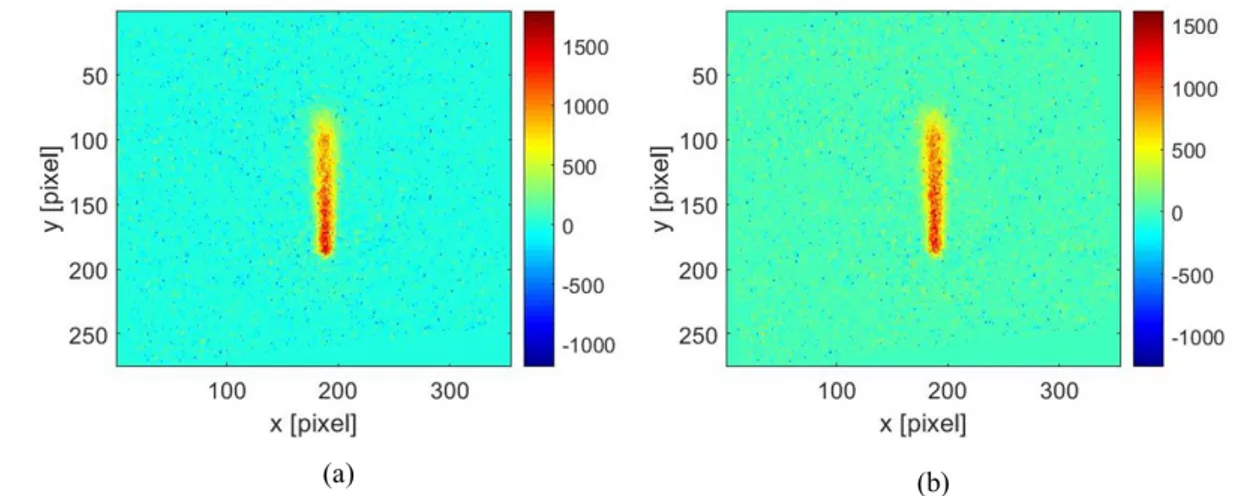
The experiments consist in introducing acetone vapour in the chamber at room temperature. The pressure of acetone vapour is fixed at P = 10,000 Pa. Thereafter, images at 5 ns delay after laser beam excitation are captured. These images are taken at room temperature (295 K), the whole chamber being at the same constant temperature. The power supply of the heating element is then turned on and the element reaches a stable heated temperature of 348 K. Figure 8(a) shows the experimental image of acetone vapour at P = 10,000 Pa and room temperature. Figure 8(b) shows the image at P = 10,000 Pa with the heating element turned on and maintained at 348 K. Both these images are obtained after the subtraction of the corresponding background images.
8
Figure 8. Experimental images of acetone vapour at P = 10,000 Pa at delay of 5 ns after subtracting corresponding background image. (a) chamber at room temperature, T = 295 K, (b) Heated element maintained at T = 348 K
4.4 Discussion
For a photoluminescence phenomenon, the number of photons collected by a photo detector (𝑆) from a volume ∆𝑉 of molecules excited by a laser beam of energy density 𝐼𝑖𝑛, can be estimated as
𝑆 = 𝜂𝑝𝐼𝑖𝑛𝜎𝑎𝑏𝑠(𝜆,𝑇)
𝐸𝑝ℎ(𝜆) 𝑛𝜙(𝜆, 𝑇, 𝑃) (2)
Where 𝜎𝑎𝑏𝑠 is the absorption cross-section, 𝐸𝑝ℎ is the photon energy, 𝜆 is the wavelength of the light used for excitation, T is the temperature and 𝑃 is the pressure, 𝑛 is the number density of the emitting molecules, 𝜂𝑝 is the capturing efficiency of the detecting optics. 𝜙 refers to quantum yield of photoluminescence equals to the ratio 𝑛𝑢𝑚𝑏𝑒𝑟 𝑜𝑓 𝑝ℎ𝑜𝑡𝑜𝑛𝑠 𝑒𝑚𝑖𝑡𝑡𝑒𝑑
𝑛𝑢𝑚𝑏𝑒𝑟 𝑜𝑓 𝑝ℎ𝑜𝑡𝑜𝑛𝑠 𝑎𝑏𝑠𝑜𝑟𝑏𝑒𝑑 .
From equation (2), the ratio of 𝑆295 and 𝑆348, intensity counts obtained without and with turning on the heating element respectively, is expressed as :
In our experiment, for both cases with and without the heating element on: the optics and the excitation of the wavelength are the same, the laser energy is assumed to be similar. This further reduces equation (3) to the following:
𝑆348
𝑆295=
𝑛348𝜎𝑎𝑏𝑠(𝜆,𝑇 = 348 𝐾)𝜙(𝜆, 𝑇 = 348 K, 𝑃)
𝑛295𝜎𝑎𝑏𝑠(𝜆,𝑇 = 295 𝐾)𝜙(𝜆, 𝑇 = 295 K, 𝑃) (3)
The absorption cross-section and quantum efficiency are both functions of temperature7,8, and therefore, we
must know these values to further proceed in our analysis.
With our experimental setup shown in Figure 1, we measured the absorption cross-section of acetone vapour, 𝜎𝑎𝑏𝑠, and these values can be generated on the basis of Beer-Lambert’s law, which can be expressed as
𝜎𝑎𝑏𝑠= −
1 𝑛𝐿𝑙𝑛 (
𝐼𝑜𝑢𝑡𝑙𝑒𝑡
𝐼𝑖𝑛𝑙𝑒𝑡 ) (4)
wher 𝐿 is the length traversed by the laser beam in the acetone vapour, 𝐼𝑜𝑢𝑡𝑙𝑒𝑡 is the laser energy intensity at the exit of the chamber containing acetone, and 𝐼𝑖𝑛𝑙𝑒𝑡 is the laser energy intensity at the entry of the chamber. In the present experimental study, since only one power meter was at disposal (Figure 1), the ratio 𝐼𝐼𝑜𝑢𝑡𝑙𝑒𝑡
9
measured by comparing the power meter signals obtained at the exit of the chamber for a chamber filled with acetone and for an empty chamber. The experiments were carried out under conditions shown in Table 3. Table 3: Excitation wavelengths and operating temperature used in measuring absorption cross-section of acetone vapour
Wavelength (nm) 248, 266, 276, 282, 289, 300, 308, 310, 320 Temperature (K) 298 K and 328.5 K
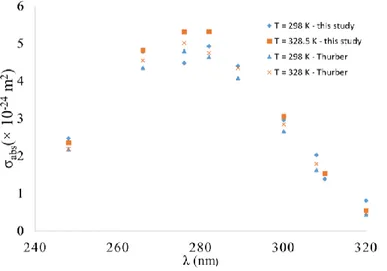
Figure 9 shows the variation of absorption cross-section as a function of wavelength at two different temperatures. The absorption cross-section increases with the excitation wavelength, reaches a maximum around 280 nm and then decreases. We observe that coefficients extracted from our experiments are in close agreement with those in the literature8.
Figure 9: Variation of absorption cross-section of acetone with wavelength. Present results at two different temperatures compared with data from Thurber et al5.
From Figure 9, we know the values of absorption cross-sections of acetone vapour excited at 310 nm, and we note that there is no strong dependency with temperature, and we assume that the absorption cross-sections are nearly the same at 295 and 348 K. This further reduces the Equation (3) as follows:
𝑆348 𝑆295=
𝑛348𝜙(𝜆, 𝑇 = 348 K, 𝑃)
𝑛295𝜙(𝜆, 𝑇 = 295 K, 𝑃) (5)
Now, to estimate the ratio of 𝑛𝑛348
295 based on the experimentally observed value of
𝑆348
𝑆295, we would be needing the information on the quantum yield (or efficiency), 𝜙(𝜆,𝑇=348,𝑃)𝜙(𝜆,𝑇=295,𝑃). This data can be obtained from the work done by Thurber et al8. At the location of the heating element (y = 85), the quantum efficiency
ratio 𝜙(𝜆,𝑇=348 K,𝑃)𝜙(𝜆,𝑇=298 K,𝑃) can be approximated close to 0.95.
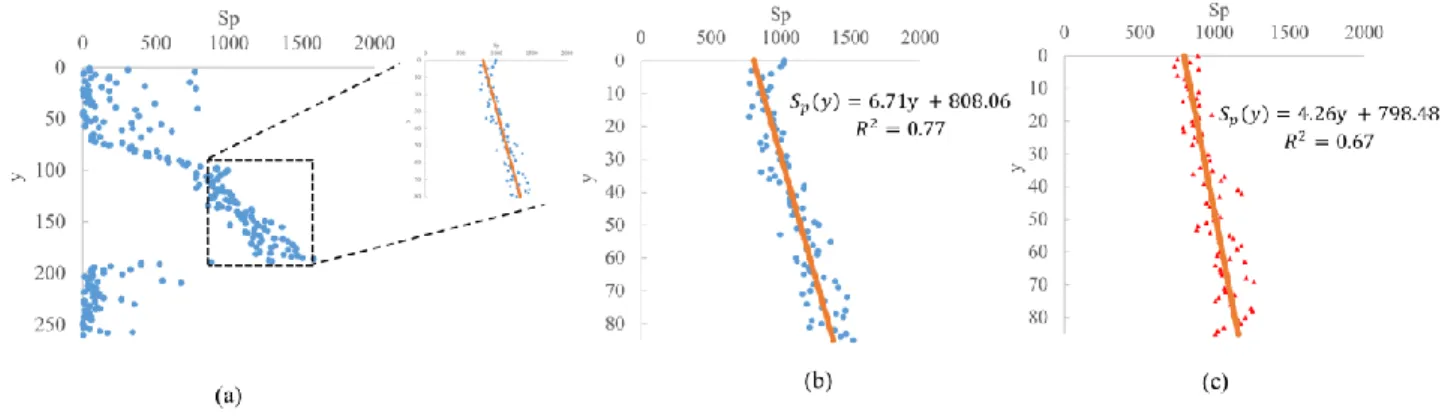
For the analysis of images shown in Figure 8, we fit the intensity signal along x with a Gaussian function for every y value. Then, the variation of intensity of the peak (i.e. the maximum value) along the y – direction (i.e. direction of the laser beam) of these Gaussians curves are considered. Figure 10 shows the evolutions of the intensity of the peaks (Sp) along the y – direction obtained from images shown in Figure 8. In Figure 10(a), the intensity values are close to zero in the background regions where there is no laser illumination. The position of the heating element is considered to be just before the first variation of the intensity counts in the
10
then studied in the region of interest (ROI) delimited by pixels 100 to 185 in the y- direction and pixels between 165 and 210 in the x-direction.
Figure 10(b) shows the ROI without the heating element turned off (T = 295 K) and Figure 10(c) with the heating turned on (T=348 K). In both cases, we can notice a reduction of the intensity along the direction of the laser beam. In Figure 10(b), this reduction is due to the diffusion of the laser beam as we move along the direction of the laser beam. Therefore, along the direction of propagation of the laser beam, it undergoes spreading, but the overall energy is almost conserved, as there is negligible absorption by acetone vapour. This has been verified from the image at room temperature by summing up the intensity counts along x –direction for every y – pixel in the ROI. If there was a considerable decrease of energy in this region, then the integrated counts would show a reduction in the number of counts. However, we observed that there is no reduction in the integrated counts, demonstrating that the absorption of laser energy by acetone vapour is almost negligible. Therefore, the variations of Gaussian peaks in Figure 10(c) is due to two factors : first factor is the diffusion of the laser beam, and the second factor can be due to the variation of the density along the y-direction.
Figure 10 Variation of intensity counts along y – direction (a) for all the image Figure 8 (a), the zoomed portion shows the ROI
(b) in the ROI at T = 295 K (y-axis translated to zero) (c) in the ROI at T=348 K (y-axis translated to zero)
To understand the influence of the heating element on the intensity value, we have to approximate its variation shown in Figure 10. In the ROI, a linear approximation is considered. The intensity value in the case of the heating element turned on should be slightly lower when compared to the case where the heating element is turned off. Due to the density difference near the heating element, on fitting a linear curve in the ROI (along y), the curve generated without the heating element is expected have a slope higher than the curve generated with the heating element turned on. Equations (6) and (7) shows the linear approximations for the data shown in Figure 10(a) and (b), respectively.
With the heating element turned on and maintained at 348 K :
𝑆𝑃,295(𝑦) = 6.71y + 808.06 (6)
Without turning on the heating element :
𝑆𝑃,348(𝑦) = 4.26y + 798.48 (7)
The equations (6) and (7) are fitted by translating values of y-pixels (0 to 85). Thus, the location of heating element is at y = 85. At y = 0, the temperature obtained should be same in both the cases, with heating element turned on and off. Since the pressure and temperature are same, the number density is same, and the quantum efficiency ratio for the pixels around this location is close to 1. This means that we would expect 𝑆𝑃,348(𝑦=0)
𝑆𝑃,295(𝑦=0) to be one. From equations (6) and (7), at y = 0, we obtain,
𝑆𝑃,348(𝑦 = 0)
𝑆𝑃,295(𝑦 = 0)=
798.48
808.06= 0.99 (8)
11 Therefore, near the heating element, we obtain,
𝑆𝑃,348
(
𝑦 = 85)
𝑆𝑃,298
(
𝑦 = 85)
= 0.84.(9)
From equation (5) and on substituting the corresponding values of quantum efficiency ratio, we obtain
𝑛348(𝑦=85)
𝑛295(𝑦=85)= 0.88. If we consider the temperature ratio (295/348), we would get 0.85 (from the ideal gas
relation). This shows that with our experimental images and analysis, we are able to measure differences in number density introduced by a difference in temperature.
5 CONCLUSIONS
This study has established the procedure to carefully perform and analyse experiments with acetone vapour emission intensity with time. The same approach can be used to study other potential tracers in future works. The influence of oxygen quenching has been studied and it has been show that the reduction in the intensity can be strongly affect by the presence of oxygen in the system. The evaluation of time constants has shown the bi-exponential decay behaviour of acetone vapour. For the temperature range investigated in this study, the variation of intensity (lifetime constants) of acetone vapour has been shown to be weak with temperature as well as the evaluation of absorption cross-sections and quantum yield values. However, a dependency of intensity with the number density has been evidenced showing the potentiality of the molecular tagging technique for indirect temperature measurement. Further investigations will be conducted to analyse the effects of higher temperature on the emission of acetone vapour.
Acknowledgements
This project has received funding from the European Union’s Framework Programme for Research and Innovation Horizon 2020 (2014-2020) under the Marie Skłodowska-Curie Grant Agreement No. 643095, and from the Fédération de Recherche FERMAT (FR 3089).
References and Citations
1. Colin, S. Gas microflows in the slip flow regime: a critical review on convective heat transfer. J. Heat
Transf. 134, 020908 (2012).
2. Kandlikar, S., Garimella, S., Li, D., Colin, S. & King, M. R. Heat transfer and fluid flow in minichannels
and microchannels. (Elsevier, 2005).
3. Fratantonio, D. et al. Molecular tagging velocimetry for confined rarefied gas flows: Phosphorescence emission measurements at low pressure. Exp. Therm. Fluid Sci. 99, 510–524 (2018).
4. Samouda, F., Colin, S., Barrot, C., Baldas, L. & Brandner, J. J. Micro molecular tagging velocimetry for analysis of gas flows in mini and micro systems. Microsyst. Technol. 21, 527–537 (2015).
5. Mohand, H. S. H., Frezzotti, A., Brandner, J. J., Barrot, C. & Colin, S. Molecular tagging velocimetry by direct phosphorescence in gas microflows: correction of Taylor dispersion. Exp. Therm. Fluid Sci. 83, 177– 190 (2017).
6. Frezzotti, A., Mohand, H. S. H., Barrot, C. & Colin, S. Role of diffusion on molecular tagging velocimetry technique for rarefied gas flow analysis. Microfluid. Nanofluidics 19, 1335–1348 (2015).
7. Charogiannis, A. Development of a laser induced phosphorescence technique for the investigation of evaporating two-phase flows. (2013).
8. Thurber, M. C., Grisch, F., Kirby, B. J., Votsmeier, M. & Hanson, R. K. Measurements and modeling of acetone laser-induced fluorescence with implications for temperature-imaging diagnostics. Appl. Opt. 37, 4963–4978 (1998).