HAL Id: insu-00376155
https://hal-insu.archives-ouvertes.fr/insu-00376155
Submitted on 16 Apr 2010HAL is a multi-disciplinary open access archive for the deposit and dissemination of sci-entific research documents, whether they are pub-lished or not. The documents may come from
L’archive ouverte pluridisciplinaire HAL, est destinée au dépôt et à la diffusion de documents scientifiques de niveau recherche, publiés ou non, émanant des établissements d’enseignement et de
Interactions of ammonium smectite with low molecular
weight carboxylic acids.
Mathieu Gautier, Fabrice Muller, Jean-Michel Bény, Lydie Le Forestier,
Patrick Albéric, Patrick Baillif
To cite this version:
Mathieu Gautier, Fabrice Muller, Jean-Michel Bény, Lydie Le Forestier, Patrick Albéric, et al.. In-teractions of ammonium smectite with low molecular weight carboxylic acids.. Clay Minerals, Miner-alogical Society, 2009, 44, pp.207-219. �insu-00376155�
Full title of the article
INTERACTIONS OF AMMONIUM SMECTITE WITH LOW MOLECULAR WEIGHT CARBOXYLIC ACIDS
Shortened title
NH4-CLAY-CARBOXYLIC ACIDS INTERACTION
Authors
M. GAUTIER, F. MULLER, J.-M. BENY, L. LE FORESTIER, P. ALBERIC, P. BAILLIF
Address
CNRS/INSU, Institut des Sciences de la Terre d’Orléans (ISTO), Université d’Orléans-Université de Tours, 1A rue de la Férollerie, 45071 Orléans Cedex 2, France
Corresponding author:
ABSTRACT:
This study aims at better understanding the interaction between an ammonium smectite and carboxylic acids. The SWy-2 (Wyoming smectites) has been exchanged with NH4+ and then batched with carboxylic acids
(acetic, formic, chloroacetic and oxalic) in concentrations between 0,01M and 1M. The obtained solid phases have been chemically analyzed and characterized by infrared absorption spectroscopy and X-ray powder diffraction. The ionic chromatography has been used for the quantitative measurement of ammonium in the solution after interaction. For the four acids, the interaction is characterized by a cationic exchange of NH4+ to
H3O+. A partial exchange to Al3+ due to a partial dissolution of the sample
in strong acidic medium is observed with chloroacetic and oxalic acids. For these two last acids, the adsorption of molecules on the clay sample occurs, mainly through H-bonding with the cation. Moreover, the intercalation of oxalic acid in the interlayer space has been highlighted.
KEYWORDS:
Ammonium ; Montmorillonite ; SWy-2 ; Carboxylic acids ; Acetic acid ; Formic acid ; Chloroacetic acid ; Oxalic acid ; Waste landfill ; Leachate.
INTRODUCTION
The percolation of water through waste landfills produces leachates with high amount of pollutants. Clay barriers are used in the bottom of these sites to limit soil and underground water pollution. Smectites are mainly chosen because of their low permeability after compaction, their expansion ability, their molecule fixation property and their high Cation Exchange Capacity (CEC). Landfill leachates are characterized by a very high variety of cations. Among these cations, ammonium is in large excess in leachates, as mentioned by several authors (Leikam & Stegmann, 1996; Lo, 1996; Kruempelbeck & Ehrig, 1999; Christensen et al., 2001; Oman & Junestedt, 2007). Kjeldsen et al. (2002) even describe ammonium as the major long-term pollutant. The presence of ammonium is principally explained as resulting from bacteria degradation. Consequently, a natural cationic exchange can be predicted in clay barrier between starting exchangeable cation (mainly Na+, Ca2+ and K+) andNH . Previous studies mainly +4 characterized ammonium smectites by FTIR spectroscopy (Chourabi & Fripiat, 1981; Petit et al., 1998, 1999; Bishop et al., 2002; Pironon et al., 2003).
For the first years after the disposal of the waste in the landfill, which mainly corresponds to the anaerobic acid phase, leachates are composed of
several carboxylic and volatile fatty acids. Harmsen (1983) estimated that 95% of the total organic carbon comes from these acids. Interactions between carboxylic acids and Na- or Ca-clays are well described in the literature (Brindley & Moll, 1965; Yariv & Shoval, 1982; Kubicki et al., 1999; Yariv & Lapides, 2005). Yariv et al. (1966) performed an infrared study of benzoic acid adsorbed onto NH4-montmorillonite but generally no
detailed paper of interaction between organic acids and NH4-clays are
available. Except the specific infrared study of benzoic acid adsorbed onto NH4-montmorillonite (Yariv et al., 1966), no other data concerning the
interaction between organic acids and NH4-clays are available in the literature. The purpose of this paper is to study the behaviour of four short carboxylic acids (acetic, CH3COOH, formic, HCOOH, chloroacetic,
ClCH2COOH and oxalic acids, (COOH)2) on smectite previously exchanged
MATERIALS AND METHODS
Materials
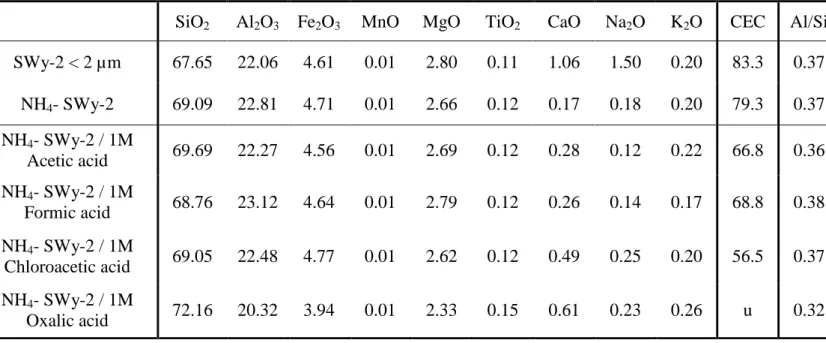
The smectite sample used for this study is the SWy-2 montmorillonite from the Source Clays Repository of The Clay Minerals Society. The structural formula of the < 2 µm fraction, calculated from the chemical composition given in Table 1, is
(Ca0.13Na0.34K0.03)[Al3.04Fe(III)0.41Mg0.49Ti0.01][Si7.98Al0.02]O20(OH)4. A 5%
silicon content correction (presence of quartz mainly) was applied as described by Chipera & Bish (2001). The corrected structural formula is the following:
(Ca0.14Na0.36K0.03)[Al3.05Fe(III)0.42Mg0.51Ti0.01][Si7.86Al0.14]O20(OH)4.
Approximately 2 g of the Wyoming montmorillonite were poured into a Nalgene centrifuge tube and mixed with 50 mL of a 1M ammonium chloride solution. The sample rotated on a SRT1 Stuart Scientific roller mixer for 12h. The supernatant chloride solution was then drained and the tube was refilled with a fresh 1M NH4Cl solution. This process was repeated
five times. The sample was then put in a dialysis membrane tubing and placed in deionized water to remove chlorine. The water was daily changed until the disappearance of chlorine (AgNO3 test). After dialyze and
corresponds to the clay fraction was extracted, dried and finely hand ground in an agate mortar.
The organic acid solutions were prepared from mixtures of reagent grade organic acids in deionized water (milli-Q/18.2 MΩ.cm-1
). The concentrations of organic acids were 0.01, 0.1 and 1 M. These concentrations were chosen higher than those in waste landfill leachates, in order to promote the reactions.
A mass of 200 mg of finely dispersed <2 µm NH4-sample was placed in
centrifuge tubes and shaken at room temperature in 20 mL of distilled water, 0.01, 0.1 and 1M solutions of these organic acids, respectively. After seven days, each solution was recovered by centrifugation and the pH value was measured with a pH-microelectrode (Mettler Toledo, InLab 423). The suspension aliquots were filtered through a Millipore filter (0.2 µm) and stored at 4°C before ICP-AES and ionic chromatography analyses. Then the treated NH4-samples were recovered for analyses, rinsed softly for 1 hour
with 20 mL of deionized water (milli-Q/18.2 MΩ cm-1
) and dried at 40°C.
Sample characterization ICP-AES
The chemical composition of the clay samples was checked by ICP-AES analysis using a Jobin-Yvon Ultima spectrometer. Approximately 100 mg
precisely weighted of samples were dissolved by alkaline fusion (LiBO2)
and the Si, Al, Fe, Ti, Mn, Mg, Li, Ca, Na, K concentrations were measured.
Infrared spectroscopy
Fourier Transform Infrared (FTIR) spectra were recorded using a NICOLET Magna-IR 760 Fourier transform spectrometer. To avoid K+-clay cations exchange within sample during analysis (Pelletier et al., 1999) and to eliminate the contribution of the water absorbed by the KBr pellets in the stretching O-H band, a NICOLET Nic-Plan microscope was used. The spectrometer and the microscope were purged with dry air to remove most of the atmospheric H2O and CO2. The powder sample was spread over the
NaCl window of the microscope stage. The analysed sample area was a 100 µm diameter circle chosen under the microscope 15X Cassegrainian objective. The operating conditions were 128 scans and 2 cm-1 resolution with no ambient CO2-H2O corrections. The studied wavenumber range was
650 cm-1 – 4000 cm-1 according to the spectrometer beamsplitter and the microscope detector (Nicolet MCT-A).
Carbon and nitrogen analyses
Total carbon and nitrogen contents were quantified by combustion at 1300°C using an elemental analyser CNS 2000 LECO. About 40 mg of sample were analysed. The combustion process converts any elemental carbon into CO2 which is quantified with an infrared spectroscopy cell.
Nitrogen sample is converted into oxidized forms then reduced into N2 and
quantified by conductivity measurement.
A LECO analyser is not classically used in clay science to quantify carbon and nitrogen. However, it is a direct method for the quantification of the nitrogen content, and then the ammonium content of the studied minerals can be deduced. Moreover, this technique allows us to show the presence or the absence of adsorption of organic molecules on clay mineral by the carbon content measurement. To validate the method, a set of 16 measurements has been realized on the SWy-2 sample exchanged with the ammonium cations (Table 2). These results allow to evaluate N , the mean
value of the nitrogen content in ammonium smectites, and Δ , the N
sensibility of this technique: N = 8.8 mg/g with NΔ = ± 0.8 mg/g.
On the other hand, the sensibility of this technique is not adapted to the determination of the small residual carbon content in purified clay minerals. Indeed, we obtain C = 0.8 mg / g with ΔC = ± 0.5 mg / g. The carbon content is however a reliable indicator of the organic molecules adsorption. For example, in the case of the glycolated NH4-SWy-2 smectite, the
measurement of the carbon concentration is C = 64,6 mg / g in comparison with 0,9 mg / g obtained without ethylene glycol molecules intercalation.
Cations in the solution were quantified after interaction with the smectites by an ionic chromatography equipped with a cation column. Only the contents of ammonium are showed in Tab. 3.
X-Ray Diffraction
X-Ray Diffraction (XRD) patterns were recorded using a Thermo Electron ARL’XTRA diffractometer equipped with a Si(Li) solid detector. The vertical θ:θ goniometer supports two Sollers slits. A VTI RH 200 Relative
Humidity generator device coupled to an Anton Paar HTK 1200R chamber allows having variable environmental conditions. Experimental measurement parameters were 10s counting time per 0.05°2θ step. The
divergence slit, the incident beam scatter slit, the diffracted beam scatter slit and the receiving slit are 1.0, 1.5, 0.45 and 0.30 mm wide, respectively. Between 30 and 60 mg of powder sample are necessary for XRD analysis. Data collection was performed at 30°C and 50% relative humidity (RH) after an equilibrium period of 1 hour before the measurement.
Cationic Exchange Capacity and measurements of the interlayer cations content
The Cation Exchange Capacity (CEC) was measured using the triethylenetetramino copper-II complex method (Meier & Kahr, 1999; Ammann et al., 2005) for which about 50 mg of the sample precisely
weighted were suspended for 1 hour in 10 mL of 0.004 M triethylenetetramino copper-II complex [Cu(trien)Cl2] solution. After
centrifugation, the Cu concentration in solution was measured using a 905-GBC atomic absorption spectrophotometer from 905-GBC Scientific Equipment to determine the CEC value.
Because of a partial dissolution of the clay in our acid solutions and an eventual cationic exchange, Si, Al, Fe, Mn, Mg, Ca, Na and K concentrations were also measured, after total Cu exchange, to quantify the part of each element as compensating cation .
RESULTS
The NH4-sample
The chemical composition of the NH4-sample is showed in Table 1 and the
nitrogen content of Table 2. We can notice the decrease of the Ca and Na concentrations in comparison with the initial SWy-2 montmorillonite. After exchange, the structural formula of the NH4-sample is:
(NH4)0.49Ca0.02Na0.04K0.03[Al3.08Fe(III)0.41Mg0.47Ti0.01][Si7.97Al0.03]O20(OH)4.
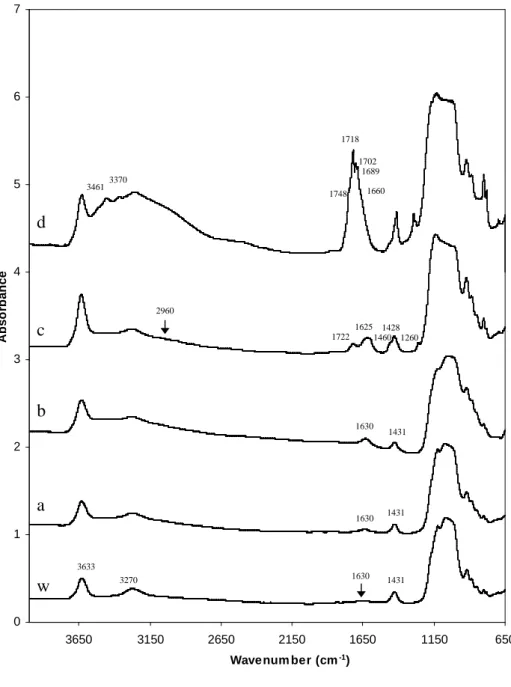
The FTIR spectrum of NH4-sample is presented in Fig. 1w. The N-H main
stretching band is observed at 3270 cm-1 and two very small bands exist around 3080 and 2830 cm-1 as observed by Petit et al. (1998). The ν4 NH -+4
bending vibration is centred at 1431 cm-1 (Petit et al., 1998, 1999; Pironon
1630 cm-1, assigned to the sample water content, is very low in this NH4
-sample.
The XRD diagram obtained at 30°C and 50% RH (Fig. 3) shows a classical pattern of smectite. The basal distance d001 is equal to 1.19 nm. A few
amount of quartz was detected and no calcite phase was observed.
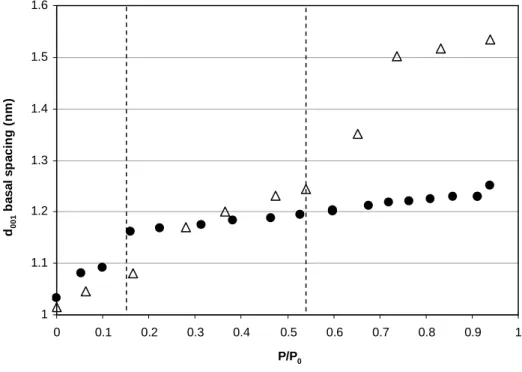
The relative low interlayer hydration property of the NH4-sample is
characterized by the evolution of the basal distance with relative humidity (Fig. 4). It can be decomposed in two domains. For P/P0 ≤ 0.15, the d001
spacing sharply increases to reach a value around 1.19 nm. For P/P0 > 0.15,
the interlayer distance slightly increases to reach a final value of 1.24 nm at P/P0≈0.90. These results are in concordance with those of Pironon et al.
(2003).
Fixation ability
Acetic and formic acid treatments
The chemical analyses of NH -samples treated with acetic and formic acids +4 (Table 1) do not reveal any dramatic changes after interaction in comparison with the NH4-sample. Fig. 1 w, a, b shows the FTIR spectra for the NH4
-SWy-2 interacted with water, 1M acetic and 1M formic acids, respectively. No characteristic bands characteristic of acid molecules or of bonds between the clay and the acid molecules were detected. The 1431 cm-1 H-N-H bending band relative intensity weakly decreases after the treatments. This
can be assigned to a decrease of the clay NH content. In the same way the +4 relative intensity of the 1630 cm-1 H-O-H bending band of water increases. The carbon and nitrogen concentrations after treatments and the pH of the solutions have been measured and presented in Table 3. The small and almost constant value of carbon content indicates the absence of molecular fixation on clay. The nitrogen concentrations decrease with the increase of acid concentration and confirm the FTIR results. The ionic chromatography analyses of the solution show that the ammonium concentration released from clay increases with the increase of acid concentration (Table 3). The pH of the solutions was relatively low (between 1.8 and 3.9) and logically decreased with the increase of acid concentration (Table 3). Then, we can assume that a cationic exchange of the initially NH to H+4 3O+ cations seems
to be the main effect of the interaction between NH4-sample and acetic and
formic acids.
Chloroacetic acid treatment
The nitrogen analyses of the reacted solid samples show an ammonium cation content decreasing trend with the acid concentration (Table 3). In the same way, the pH value of the solution decreases with the acid concentration. So, a cationic exchange of the initially NH to H+4 3O+ cations
is highlighted, as in the case of acetic and formic acids. However, the FTIR spectrum shows a molecular fixation (Figs 1c and 2a). The NH4-sample
assigned to υCH, a broad band at 1722 cm-1 due to a C=O stretching and a
wide broad band near 1625 cm-1. Another broad band is observed at 1428 cm-1 with an important shoulder at 1460 cm-1. We can note that in this 1410 cm-1 - 1470 cm-1 frequencies range several bands can overlap, corresponding to NH bending, CH+4 2 scissoring, a combination band between C-O
stretching and H-O-C in plane angle bending and υsymCO of carboxylate ion
(CO2)- (Lin-Vien et al., 1991). For example, (Max & Chapados, 2004) give
a mean value of 1397 cm-1 with a 35 cm-1 standard deviation for the CH2
scissoring, δsc(CH2) and 1406 cm-1 with a 12 cm-1 standard deviation for the
(CO2)- symmetric stretching νsym (CO2)- of nine carboxylic acids and their
sodium salts in aqueous solutions. Because of this overlap, the decrease of theNH content in clay can not be confirmed by FTIR analyses. A medium +4 band at 1260 cm-1 is also observed and can be attributed to a H-C-H wag vibration of a –CH2X terminal group (Lin-Vien et al., 1991). The acid
sorption is confirmed by carbon concentration measurements (Table 3). At 0.01M acid concentration, the carbon concentration remains identical to that of water treated sample. The increase of the clay carbon content is significant for 0.1M and 1M concentrations, with 9.3 mg/g and 14.7 mg/g, respectively.
As previously seen with chloroacetic interaction, a strong decrease of the nitrogen concentration in treated sample and a decrease of the pH of the solution (Table 3) are due to a cationic exchange of the initialNH . +4 Moreover, the increase of the carbon content, especially for 0.1M and 1M, with the acid concentration (Table 3) indicates a fixation of oxalic acid onto the clay. The FTIR spectrum of the NH4-SWy-2 sample interacted with 1M
oxalic acid (Figs 1d) show a very broad band around 1700 cm-1. This band is composed of three contributions at 1718 cm-1, 1702 cm-1 and 1689 cm-1; of two weak shoulders at 1748 cm-1 and 1660 cm-1 and of a very weak one at 1626 cm-1 (Fig. 2b). Moreover, the spectrum presents two new bands in comparison with the initial NH4-SWy2 sample: one in the 1500 cm-1 - 1350
cm-1 range with components at 1463 cm-1, 1429 cm-1 and 1415 cm-1. These additional bands prove that new molecular bonds exist after the treatment. Because of overlaps in this region (Fig. 2b) and the high exchange rate after 1M oxalic acid treatment (Table 3), the 1431 cm-1 H-N-H bending band is not visible in the FTIR spectrum. Another band between 1350 cm-1 and 1250 cm-1 with two contributions at 1293 cm-1 and 1280 cm-1 also confirms the oxalic acid fixation (Bellamy & Pace, 1963).
X-Ray Diffraction patterns are shown in Fig. 3. The NH4-SWy-2 interacted
for seven days with water is used as a reference. The basal distance of ammonium smectites interacted with acetic acid (pKa=4.76) shifts from 1.19 to 1.24 nm with acid concentration increase (Fig. 3a). The expansion of the basal distance is due to the partial interlayer cationic exchange. Concerning formic acid (pKa = 3.74), the shift of the 001 reflexion is more important, from 1.19 to 1.33 nm (Fig. 3b). In spite of acid fixation, X-ray diffraction patterns of the NH4-SWy-2 interacted with chloroacetic acid
(pKa = 2.87) show the same evolution (Fig. 3c), with a shift from 1.19 to 1.49 nm. X-ray diffraction patterns of the NH4-SWy-2 interacted with oxalic
acid (pKa1 = 1.27, pKa2 = 4.27) show a different behaviour (Fig. 3d). As
concentration increases, the 001 reflexion becomes sharper, and the shift towards lower angle is smaller (from 1.19 to 1.26 nm) than with other acids.
Evolution of the exchange rate versus pH
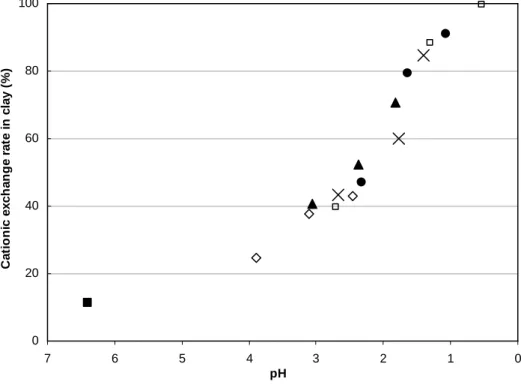
The exchange rate is obtained from the nitrogen concentration in solid phase after interaction with acids in different concentrations divided by the content of nitrogen in the starting NH4-SWy-2 sample. Whatever the studied acid,
the cationic exchange rate in clay increases as the pH value of the solution decreases (Fig. 5). The comparison with chlorhydric acid shows that the exchange with organic acids is directly linked to the pH of the solution and that the fixation has no influence on the exchange rate. For the same acid
concentration, the cationic exchange rate is different because of the acidity of the solution. For example, with the 1M concentration, the exchange rate reaches 43% in the case of acetic acid (pH=2.5), 70% for formic acid (pH=1.8), 85% for chloroacetic acid (pH=1.4) and 91% for oxalic acid (pH=1.1).
DISCUSSION
Nature of the compensating cation after acid treatment
Under acidic medium, the destruction of octahedral and tetrahedral sheets can occur (Huang & Keller, 1971; Metz et al., 2005). Clay dissolution
induces cations in solution which can move to the interlayer space and participate to an exchange process. The Al/Si ratio in NH4-SWy-2 solid
phase is initially equal to 0.37 (Table 1). Concerning formic, acetic and chloroacetic acids interactions, the Al/Si ratio is quite constant after interaction with 1M acid solution. In the case of oxalic acid interaction, the Al/Si ratio decreases to 0.32 for 1M concentration, which indicates an octahedral sheet destruction. In an acid medium, the presence of hydrated protons in the interfoliar space is doubtless (Balek et al., 2002; Ferrage et al., 2005). During the treatment, the interlayer NH cation was firstly +4 exchanged by H3O+. Secondly, due to the partial clay dissolution, other
because of the acid attack of layers by protons, these H-montmorillonites are unstable materials and are partially converted to (H, Al, Mg)-montmorillonite (Glaeser et al., 1960; Coleman & Craig, 1961; Eeckman &
Laudelout, 1961; Davis et al., 1962; Miller, 1965; Janek & Komadel, 1993;
Komadel, 2003). To determine precisely the nature of compensating cations after acid treatment, the concentrations of Si, Al, Fe, Mn, Mg, Ca, Na and K were measured in the solution after total exchange with triethylenetetramino copper complex. The quantity of ammonium as compensating cation was deduced from nitrogen analyses (LECO).
Fig. 6 shows the fraction of each cation in the exchange sites for different pH values. Whatever the pH value, potassium, sodium and silicium contents were very low, below 1 meq/100g and were not shown. The magnesium, calcium and iron contents were very weak and did not exceed 10 meq/100g. Below pH 2, no calcium was detected but a small quantity of iron cations was measured.
In the 7 – 2.4 pH range, the quantity of ammonium cation slightly decreases due to a gradual cationic exchange between ammonium and hydronium. In more acidic medium (pH<3) aluminium cations were present in interlayer sites. The Al quantity strongly increases as the pH decreases and this is accompanied by an important drop of the ammonium quantity.
To summarize, different types of montmorillonites were obtained during the increasing of the acidity which depends on the exchange rate and the nature
of the compensating cation: in the original state (NH4-montmorillonite at pH
6.4) and down to pH 2.4, the montmorillonite is still mainly composed of ammonium and hydronium as compensating cations. Between pH 2.4 and pH 1.5, three principally compensating cations coexist:NH , H+4 3O+ and
Al3+. Below pH 1.5, the montmorillonite becomes an aluminous montmorillonite with aluminium as major compensating cations. Coleman & Craig (1961) and Eeckman & Laudelout (1961) also highlight that the autotransformation of H-montmorillonite is favoured by a temperature increase above 30°C. The drying at 40°C of our samples may have increased their instability.
Acetic and formic acids interactions
Fig. 7 presents the value of the d001 basal spacing versus the cationic
exchange rate. This graph can be divided in different domains. In case of interaction with acetic acid the d001 spacing is quite constant up to 40%
exchange rate, around 1.19 nm (initial value of the basal distance of an ammonium smectites) then increases to 1.25 nm. Concerning formic acid interaction, the d001 value slightly increases from 1.20 nm at 41% exchange
rate to 1.33 nm at 71% exchange rate. This evolution of the d001 value is
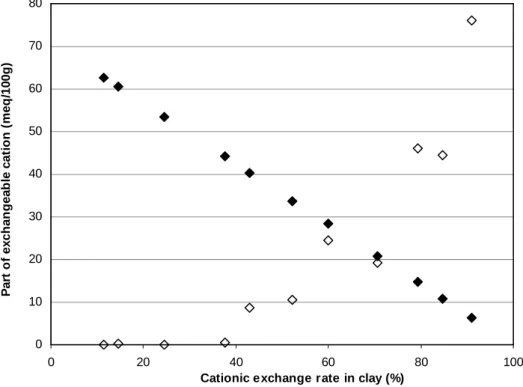
correlated with the content and nature of cations in the interlayer space. Fig. 8 shows the evolution of Al3+ and NH compensating cation versus the +4
spacing is due to the partial NH4-SWy-2 exchange to H3O-SWy-2. Above
40%, aluminium cations appear as compensating cations and there is coexistence of mainly ammonium, hydronium and aluminium in the interlayer space.
In addition to the basal distance increase, the full width at half maximum of the (001) reflexion also slightly increases (Fig. 3a, b), confirming the evolution to a less organised interstratified sample with mainly NH , H+4 3O+
or Al3+ in theinterlayer site.
In the experimental conditions of this study (concentration ≤ 1M), the main
consequence of the interaction between acetic and formic acids with the NH4-SWy-2 sample is a cationic exchange.
Chloroacetic acid interactions
The behaviour of the d001 basal spacing after interaction with chloroacetic
acid is similar to this obtained with acetic or formic acid. At around 43 % of exchange rate (0.01M concentration, pH=2.7), the d001 spacing is equal to
1.21 nm and continually increases to reach 1.39 nm at 85% of exchange rate (Fig. 7). This result can be correlated with the progressive exchange of interfoliar cations (NH and H+4 3O+) to Al3+ produced by the sample
dissolution in strong acid conditions (Fig. 6). We can notice that the standard d001 spacing obtained with a totally exchanged Al-montmorillonite
treatment (Fig. 3c) corresponds to an interstratified sample in which dominant layers are constituted with aluminium in interlayer sites (Figs 7 and 8).
The FTIR spectra allow us to propose an adsorption model based on the study of Yariv & Shoval (1982). These authors worked on the association between fatty acids and montmorillonite and they identified two distinct cases of interaction. In the first situation the molecule is in neutral form, RCOOH, characterized by an absorption band between 1660 and 1725 cm-1. In the other case, the molecule is in anionic form, RCOO-, characterized by two absorption bands between 1420 and 1610 cm-1. These two cases are identified in our FTIR spectrum (Fig. 1c, 2a). The band observed at 1722 cm-1 is characteristic of the COOH group. The linkage is realized with an hydrogen bond between an oxygen of the carbonic group and a water hydrogen or between hydrogen of carboxylate group and an oxygen from water or silicate layer (Yariv & Shoval, 1982; Yariv, 1996). The characteristic bands of the RCOO- anion are present at 1600 cm-1 and 1453 cm-1 (Fig. 2a). This absorption can be attributed to a linkage of a COO -group with hydroxyl -group of octahedral sheets on broken-bonds surface or with an exchangeable cation of clay surface, with the possibility of a water bridge formation (Yariv & Shoval, 1982).
Fig. 7 shows that below 50% exchange rate, the d001 value slightly increases
as previously described, but above 50%, contrary to other acids, the d001
does not strongly increase but reaches 1.25 nm at 79% and remains constant after this value. At the same time, with the increase of the concentration, the 001 reflexion becomes sharper (Fig. 3d). This behaviour implies that adsorption exists in the interlayer space. Moreover, Table 3 shows that this fixation strongly increases with acid concentration.
The pH value after interaction (1.1, Table 3) is very near to the pKa1 of the
oxalic acid. For this pH value, the oxalic acid can act as one or two acid function. These situations have been studied by Yariv & Shoval (1982) for the two species RCOOH and RCOO-. In our case, R corresponds to one COOH group. In the neutral form, the COOH group links to the layer and to the interlayer water through hydrogen bonds or through direct linkage to the exchangeable cation. For the deprotonated form, a bonding between carboxylate group and interlayer water or cation is mainly assumed (Yariv & Shoval, 1982). As in chloroacetic acid case, a linkage of a COO- group with hydroxyl group of octahedral sheets on broken-bonds surface can also occur.
Specht & Frimmel (2001) studied the interaction between oxalic acid and kaolinite in suspension at pH 1.2. In the same way, Yoon et al. (2004)
worked on oxalate adsorption at boehmite/water and corundum/water interfaces. Our FTIR spectrum (Fig. 1d, 2b) can be compared to their results
obtained by ATR-FTIR. The 1718 cm-1 band can be attributed to the stretching vibration νC=O of the acid carbonyl group of the neutral acid
molecule (Specht & Frimmel, 2001). The very weak shoulder at 1626 cm-1 can be attributed to the stretching antisymetric νas(CO2-) of the carboxylate
group of the deprotonated acid (Specht & Frimmel, 2001). These two bands are always present after an additional rinsing (Fig. 2c) but the 1718 cm-1 band intensity decreases in comparison with the 1626 cm-1 one, the intensity of this band which remains practically unchanged. These results indicate that among the linkages some are weaker than others.
CONCLUSION
The interaction between ammonium smectites of Wyoming and acetic, formic, chloroacetic and oxalic acids is characterized by a partial cationic exchange, dependent on the pH of the solution. Ammonium cations were progressively replaced by hydronium cation under acid condition. A dissolution of the sample also occurs and in strong acid medium (pH <2) aluminium is present in the interlayer space.
In the used conditions (batch interaction, stirring, soft rinsing and drying at 40°C) during one week, acetic and formic acids are not absorbed on ammonium clay. Chloroacetic acid is fixed on clay particle surface and on broken-bonds surface and two modes of bonding are envisaged: a
hydrogen bonding and/or a direct linking on cation (possibly by a water bridge). Fixation of oxalic acid also occurs thanks to hydrogen bonding and/or direct linking on cation. Oxalic acid is composed of two carboxylic groups and strong bondings are observed.
For chloroacetic acid interaction, the basal spacing increases as well as in acetic and formic acid interaction. In these cases, the interlayer space is only controlled by the partial cationic exchange. Limited chloroacetic acid fixation occurs on clay particle and does not affect the interlayer. On the contrary, after oxalic acid interaction the limited basal spacing expansion at 1.26 nm and the decreasing of the width of the 001 reflexion indicates that the oxalic acid molecule is mainly intercalated.
The ammonium smectite has a limited fixation ability with carboxylic acids. Only very reactive carboxylic acids (chloroacetic and oxalic acids) seem to be strongly absorded on the ammonium clay. It is necessary to investigate more in details these ammonium smectite with other organic molecules to extend the study of the fixation ability.
The aim of this paper was to investigate the interaction between an ammonium montmorillonite and low molecular weight carboxylic acids. Ammonium is the most abundant cation in landfill leachate; so it can occupy the interlayer sites of the smectite and the organic acids act a source of incoming pollutant. To conclude in waste landfill context, this study highlights that acetic and formic acids can percolate through the clay barrier
and could be found in soil and groundwater. For the first years after the disposal of the waste in the landfill, the clay barrier tends to become a H3O+/Al3+-montmorillonite. Moreover, the small clay dissolution under this
acidic medium could damage the barrier. These evolutions question the long-term durability of the clay barrier and also the prevention of any pollution. However the pH values observed in the study (1.1<pH<3.9, see Table 3) are lower than those of landfill leachates from 4.5 to 9 (Christensen
et al., 2001). In order to clearly understand the behaviour of these molecules
in the landfill environment it would be interesting to buffer the organic solutions with NH4OH to adjust the pH to the value commonly found in
landfill.
Acknowledgements
The authors wish to express thanks to Marielle Hatton for the precious helpful in the LECO analyser using. They also want to thank Jaime Cuevas and the anonymous referee for reviewing the manuscript and for their valuable comments.
Reference
Ammann L., Bergaya F. & Lagaly G. (2005) Determination of the cation exchange capacity of clays with copper complexes revisited. Clay Minerals, 40, 441-453.
Balek V., Malek Z., Ehrlicher U., Györyova K., Matuschek G. & Yariv S. (2002) Emanation thermal analysis of TIXOTON (activated
bentonite) treated with organic compounds. Applied Clay Science,
21, 295-302.
Bellamy L. J. & Pace R. J. (1963) Hydrogen bonding in carboxylic acids. I. Oxalic acids. Spectrochimica Acta, 19, 435–442.
Bishop J. L., Banin A., Mancinelli R. L. & Klovstad M. R. (2002) Detection of soluble and fixed NH4+ in clay minerals by DTA and IR
reflectance spectroscopy: a potential tool for planetary surface exploration. Planetary and Space Science, 50, 11-19.
Brindley G. W. & Moll W. F. (1965) Complexes of natural and synthetic Ca-montmorillonites with fatty acids (clay organic studies-IX).
American Mineralogist, 50, 1355-1370.
Chipera S. J. & Bish D. L. (2001) Baseline studies of the clay minerals society source clays: powder X-ray diffraction analyses. Clays and Clay Minerals, 49, 398-409.
Chourabi B. & Fripiat J. J. (1981) Determination of tetrahedral substitutions and interlayer surface heterogeneity from vibrational spectra of ammonium in smectites. Clays and Clay Minerals, 29, 260-268.
Christensen T. H., Kjeldsen P., Bjerg P. L., Jensen D. L., Christensen J. B., Baun A., Albrechtsen H.-J. & Heron G. (2001) Biogeochemistry of landfill leachate plumes. Applied geochemistry, 16, 659-718.
Coleman N. T. & Craig D. (1961) The spontaneous alteration of hydrogen clay. Soil Science, 91, 14-18.
Davis L. E., Turner R. & L.D. W. (1962) Some studies of the
autotransformation of H-bentonite to Al-bentonite. Soil Science Society of America Proceedings, 22, 281-285.
Eeckman J. P. & Laudelout H. (1961) Chemical stability of hydrogen-montmorillonite suspensions. Kolloid Zeit., 178, 99-107.
Ferrage E., Tournassat C., Rinnert E. & Lanson B. (2005) Influence of pH on the interlayer cationic composition and hydration state of Ca-montmorillonite: Analytical chemistry, chemical modelling and XRD profile modelling study. Geochimica et Cosmochimica Acta,
69, 2797-2812.
Glaeser R., Mantin I. & Mering J. (1960) Etudes sur l'acidité de la
montmorillonite. International Geological Congress, XXI Session,
28-34.
Harmsen J. (1983) Identification of organic compound in leachate from a waste tip. Water Research, 17, 669-705.
Huang W. H. & Keller W. D. (1971) Dissolution of clay minerals in dilute organic acids at room temperature. American Mineralogist, 56,
1082-1095.
Janek M. & Komadel P. (1993) Autotransformation of H-smectites in aqueous solutions. Effect of octahedral iron content. Geologica Carpathica, Series Clays, 44, 59-64.
Kjeldsen P., Barlaz M. A., Rooker A. P., Baun A., Ledin A. & Christensen. (2002) Present and Long-Term Composition of MSW Landfill Leachate: A Review. Critical Reviews in Environnemental Science and Technology, 32, 297-336.
Komadel P. (2003) Chemically modified smectites. Clay Minerals, 38,
127-138.
Kruempelbeck I. & Ehrig H.-J. (1999) Long term behaviour of municipal solid waste landfills in Germany. Proceedings Sardinia 99, Seventh International Waste Management and Landfill Symposium, 27-36.
Kubicki J. D., Schroeter L. M., Itoh M. J., Nguyen B. N. & Apitz S. E. (1999) Attenuated total reflectance Fourier-transform infrared spectroscopy of carboxylic acids adsorbed onto mineral surfaces.
Geochimica et Cosmochimica Acta, 63, 2709-2725.
Leikam K. & Stegmann R. (1996) Stellenwert der mechanischbiologischen Restabfallvorbehandlung. Abfallwirtschafts Journal, 9, 39-44.
Lin-Vien D., Colthup N. B., Fateley W. G. & Grasselli J. G. (1991) The Handbook of Infrared and Raman Charactetistic Frequencies of Organic Molecules. Academic Press.
Lo I. M.-C. (1996) Characteristics and treatment of leachates from domestic landfills. Environment International, 22, 433-442.
Max J. J. & Chapados C. (2004) Infrared spectroscopy of aqueous
carboxylic acids: comparison between different acids and their salts.
Journal of Physical Chemistry A, 108, 3324 - 3337.
Meier L. P. & Kahr G. (1999) Determination of the cation exchange capacity (CEC) of clay minerals using the complexes of copper(II) ion with triethylenetetramine and tetraethylenepentamine. Clays and Clay Minerals, 47, 386-388.
Metz V., Amram K. & Ganor J. (2005) Stoichiometry of smectite
dissolution reaction. Geochimica et Cosmochimica Acta, 69,
1755-1772.
Miller R. J. (1965) Mechanisms for hydrogen to aluminium transformations in clays. Soil Science Society of America Proceedings, 29, 36-39.
Oman C. B. & Junestedt C. (2007) Chemical characterization of landfill leachates - 400 parameters and compounds. Waste Management, In
Press, doi:10.1016/j.wasman.2007.06.018.
Pelletier M., Michot L. J., Barres O., Humbert B., Petit S. & Robert J. L. (1999) Influence of KBr conditioning on the infrared hydroxyl-stretching region of saponites. Clay Minerals, 34, 439-445.
Petit S., Righi D., Madejova J. & Decarreau A. (1998) Layer charge estimation of smectites using infrared spectroscopy. Clay Minerals,
33, 579-591.
Petit S., Righi D., Madejova J. & Decarreau A. (1999) Interpretation of the infrared NH4+ spectrum of the NH4+-clays; application to the evaluation of the layer charge. Clay Minerals, 34, 543-549.
Pironon J., Pelletier M., de Donato P. & Mosser-Ruck R. (2003) Characterization of smectite and illite by FTIR spectroscopy of interlayer NH4+ cations. Clay Minerals, 38, 201-211.
Specht C. H. & Frimmel F. H. (2001) An in situ ATR-FTIR study on the adsorption of dicarboxylic acids onto kaolinite in aqueous
suspensions. Physical Chemistry Chemical Physics, 3, 5444-5449.
Yariv S. (1996) Thermo-IR-spectroscopy analysis of the interactions between organic pollutants and clay minerals. Thermochimica Acta,
274, 1-35.
Yariv S. & Lapides I. (2005) The use of thermo-XRD-analysis in the study of organo-smectite complexes. Journal of Thermal Analysis and Calorimetry, 80, 11-26.
Yariv S. & Shoval S. (1982) The effects of Thermal Treatments on Associations between Fatty Acids and Montmorillonite. Israel Journal of Chemistry, 22, 259-265.
Yariv S., Russel J. D. & Farmer V. C. (1966) Infrared study of the adsorption of benzoic acid and nitrobenzene in montmorillonite.
Israel Journal of Chemistry, 4, 201-213.
Yoon T. H., Johnson S. B., Musgrave C. B. & Brown J., Gordon E. (2004) Adsorption of organic matter at mineral/water interfaces: I. ATR-FTIR spectroscopic and quantum chemical study of oxalate adsorbed at boehmite/water and corundum/water interfaces. Geochimica et Cosmochimica Acta, 68, 4505-4518.
FIGURE CAPTIONS
FIG. 1: FTIR spectra of NH4–SWy-2 interacted with water (w) used as reference, acetic acid (a), formic acid (b), chloroacetic acid (c) and oxalic acid (d) recorded at room temperature with the IR microscope. All acids are in 1M concentration.
FIG. 2: Zoom on 1200-2000 cm-1 FTIR spectra of NH4–SWy-2 interacted with chloroacetic acid (a) and oxalic acid (b) recorded at room temperature with the IR microscope. Both acids are in 1M concentration. NH4–SWy-2 interacted with oxalic acid sample after 1 hour water rinsing is shown on c curve.
FIG. 3: XRD patterns of NH4 smectite interacted with water used as reference, acetic acid (a), formic acid (b), chloroacetic acid (c) and oxalic acid (d). Acids are in 0.01. 0.1 and 1M concentration. Qz indicates the presence of quartz.
FIG. 4: Variation of the d001 versus the partial pressure of water. Black circles: NH4-SWy-2; open triangles: Na-SWy-2.
FIG. 5: Evolution of the exchange rate as a function of the pH in the
solution (final N content/initial N content*100) in the NH4-SWy-2 after 7 days interaction with water (black square), acetic acid (open diamond), formic acid (black triangle), chloroacetic acid (cross), oxalic acid (black circle) and chlorhydric acid (open square) as reference.
FIG. 6: Evolution of the fraction of each cation in the exchange sites versus
pH. Open diamonds: aluminium; open triangles: iron; crosses: magnesium; open circles: calcium; black diamonds: ammonium.
FIG. 7: Variation of the d001 basal spacing at 50% of relative humidity of the NH4-SWy-2 sample after 7 days interaction with water (black rectangle), acetic acid (open diamond), formic acid (black triangle), chloroacetic acid (cross) and oxalic acid (black circle) versus the cationic exchange rate calculated from NH+4 concentration. Lines are trends for the eyes.
FIG. 8: Evolution of the part of NH+4 and Al3+ cations in the exchange site with general cationic exchange rate in %. Open diamonds: Al3+; black diamonds: NH+4.
FIG. 1: FTIR spectra of NH4–SWy-2 interacted with water (w) used as reference, acetic acid (a), formic acid (b), chloroacetic acid (c) and oxalic acid (d) recorded at room temperature with the IR microscope. All acids are in 1M concentration. 0 1 2 3 4 5 6 7 650 1150 1650 2150 2650 3150 3650 Wavenum ber (cm-1) A b s o rb a n c e w a b c d 3270 3633 1431 1722 1625 3461 3370 1260 1428 1431 1630 1630 1431 1460 1702 1718 1689 1748 1660 2960 1630
FIG. 2: Zoom on 1200-2000 cm-1 FTIR spectra of NH4–SWy-2 interacted with chloroacetic acid (a) and oxalic acid (b) recorded at room temperature with the IR microscope. Both acids are in 1M concentration. NH4–SWy-2 interacted with oxalic acid sample after 1 hour water rinsing is shown on c curve. 3 4 5 6 7 1200 1300 1400 1500 1600 1700 1800 1900 2000 Wavenum ber (cm-1) A b s o rb a n c e a c 1702 1280 1293 1429 1415 1718 1689 1463 1748 1660 1722 1600 1260 1428 1453 1626 b 1626 1718 1415
FIG. 3: XRD patterns of NH4 smectite interacted with water used as reference, acetic acid (a), formic acid (b), chloroacetic acid (c) and oxalic acid (d). Acids are in 0.01. 0.1 and 1M concentration. Qz indicates the presence of quartz. 2 8 14 20 26 32 38 44 50 56 62 2Ө Cu (°) C o u n ts 2 8 14 20 26 32 38 44 50 56 62 2Ө Cu (°) C o u n ts a b 0.01M 1M 0. 1M 1M 0. 1M Qz Qz (001) (001) 0.01M NH4-SWy-2 NH4-SWy-2
2 8 14 20 26 32 38 44 50 56 62 2Ө Cu (°) C o u n ts 2 8 14 20 26 32 38 44 50 56 62 2Ө Cu (°) C o u n ts c d 0.01M 1M 0. 1M 1M 0. 1M Qz Qz (001) (001) 0.01M NH4-SWy-2 NH4-SWy-2
FIG. 4: Variation of the d001 versus the partial pressure of water. Black circles: NH4-SWy-2; open triangles: Na-SWy-2.
1 1.1 1.2 1.3 1.4 1.5 1.6 0 0.1 0.2 0.3 0.4 0.5 0.6 0.7 0.8 0.9 1 P/P0 d0 0 1 b a s a l s p a c in g ( n m )
FIG. 5: Evolution of the exchange rate as a function of the pH in the
solution (final N content/initial N content*100) in the NH4-SWy-2 after 7 days interaction with water (black square), acetic acid (open diamond), formic acid (black triangle), chloroacetic acid (cross), oxalic acid (black circle) and chlorhydric acid (open square) as reference.
0 20 40 60 80 100 0 1 2 3 4 5 6 7 pH C a ti o n ic e x c h a n g e r a te i n c la y ( % )
FIG. 6: Evolution of the fraction of each cation in the exchange sites versus
pH. Open diamonds: aluminium; open triangles: iron; crosses: magnesium; open circles: calcium; black diamonds: ammonium.
0 10 20 30 40 50 60 70 80 0 1 2 3 4 5 6 7 pH F ra c ti o n o f e x c h a n g e a b le c a ti o n ( m e q /1 0 0 g ) Al Fe Mg Ca NH4
FIG. 7: Variation of the d001 basal spacing at 50% of relative humidity of the NH4-SWy-2 sample after 7 days interaction with water (black rectangle), acetic acid (open diamond), formic acid (black triangle), chloroacetic acid (cross) and oxalic acid (black circle) versus the cationic exchange rate calculated from NH+4 concentration. Lines are trends for the eyes.
1.1 1.2 1.3 1.4
0 20 40 60 80 100
Cationic exchange rate (%) d0 0 1 b a s a l s p a c in g ( n m )
FIG. 8: Evolution of the part of NH+4 and Al3+ cations in the exchange site with general cationic exchange rate in %. Open diamonds: Al3+; black diamonds: NH+4. 0 10 20 30 40 50 60 70 80 0 20 40 60 80 100
Cationic exchange rate in clay (%)
P a rt o f e x c h a n g e a b le c a ti o n ( m e q /1 0 0 g )
TABLE
Table 1: Chemical composition reported in oxide weight percentages of
calcined samples measured by ICP-AES. Cationic Exchange Capacity CEC is expressed in meq/100 g of calcined clay. Al/Si is the solid ratio measured thanks to Al2O3 and SiO2 concentrations.
Table 2: Series of carbon and nitrogen concentrations measurements for the
NH4-SWy-2 reference sample.
Table 3: Carbon and nitrogen concentration in treated samples measured by
elemental analyzer CNS 2000 LECO® and ammonium concentration in solution measured by ionic chromatography. The molar concentration of the initial acid solutions and the pH of the solution after interaction are indicated. The d001 basal spacings obtained from Fig. 3 are reported.
Table 1: Chemical composition reported in oxide weight percentages of
calcined samples measured by ICP-AES. Cationic Exchange Capacity CEC is expressed in meq/100 g of calcined clay. Al/Si is the solid ratio measured thanks to Al2O3 and SiO2 concentrations.
u: undetermined
SiO2 Al2O3 Fe2O3 MnO MgO TiO2 CaO Na2O K2O CEC Al/Si
SWy-2 < 2 µm 67.65 22.06 4.61 0.01 2.80 0.11 1.06 1.50 0.20 83.3 0.37 NH4- SWy-2 69.09 22.81 4.71 0.01 2.66 0.12 0.17 0.18 0.20 79.3 0.37 NH4- SWy-2 / 1M Acetic acid 69.69 22.27 4.56 0.01 2.69 0.12 0.28 0.12 0.22 66.8 0.36 NH4- SWy-2 / 1M Formic acid 68.76 23.12 4.64 0.01 2.79 0.12 0.26 0.14 0.17 68.8 0.38 NH4- SWy-2 / 1M Chloroacetic acid 69.05 22.48 4.77 0.01 2.62 0.12 0.49 0.25 0.20 56.5 0.37 NH4- SWy-2 / 1M Oxalic acid 72.16 20.32 3.94 0.01 2.33 0.15 0.61 0.23 0.26 u 0.32
Table 2: Series of carbon and nitrogen concentrations measurements for the
NH4-SWy-2 reference sample.
Concentration (mg/g) Carbon Nitrogen u. 9.50 0.98 8.66 0.72 8.59 1.06 9.18 0.76 8.27 1.18 8.02 0.27 8.26 0.36 8.01 0.75 8.77 0.97 8.85 0.47 9.38 0.70 9.39 0.70 9.03 0.47 8.96 1.27 8.93 1.28 8.45 M 0.80 8.76 ∆ M 0.50 0.80
Table 3: Carbon and nitrogen concentration in treated samples measured by
elemental analyzer CNS 2000 LECO® and ammonium concentration in solution measured by ionic chromatography. The molar concentration of the initial acid solutions and the pH of the solution after interaction are
indicated. The d001 basal spacings obtained from Fig. 3 are reported.
u: undetermined
Solid phase Solution
NH4- SWy-2 interacted with: Acid concentration (mol/L) pH d001 (nm) Carbon (mg/g) Nitrogen (mg/g) Ammonium (mg/L) Released nitrogen (mg/g) Sum of nitrogen in the solid phase and the
released nitrogen in solution (mg/g) Water - 6.4 1.19 2.9 7.8 4.9 0.4 8.2 Acetic Acid 0.01 3.9 1.19 2.5 6.6 26.3 2.0 8.6 pKa = 4.76 0.1 3.1 1.20 2.2 5.5 40.5 3.2 8.7 1 2.5 1.24 2.3 5.0 42.1 3.3 8.3 Formic Acid 0.01 3.1 1.19 2.0 5.2 28.1 2.2 7.4 pKa = 3.74 0.1 2.4 1.21 2.0 4.2 51.3 4 8.2 1 1.8 1.32 2.2 2.6 72.6 5.6 8.2 Chloroacetic Acid 0.01 2.7 1.21 2.8 5.0 37.9 3.0 8.0 pKa = 2.87 0.1 1.8 1.27 9.3 3.5 66.3 5.2 8.7 1 1.4 1.39 14.7 1.4 80.6 6.3 7.7 Oxalic Acid 0.01 2.3 1.21 2.8 4.6 u - - pKa1 = 1.27 0.1 1.6 1.25 7.7 1.8 u - - pKa2 = 4.27 1 1.1 1.26 36.4 0.8 u - -