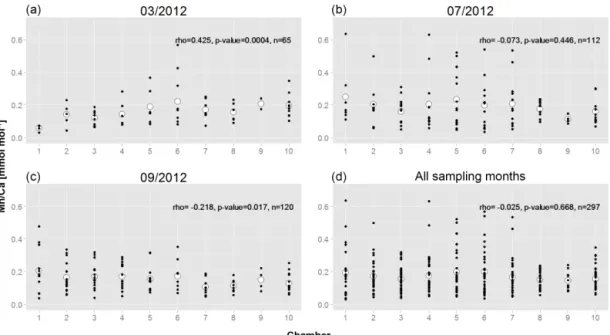
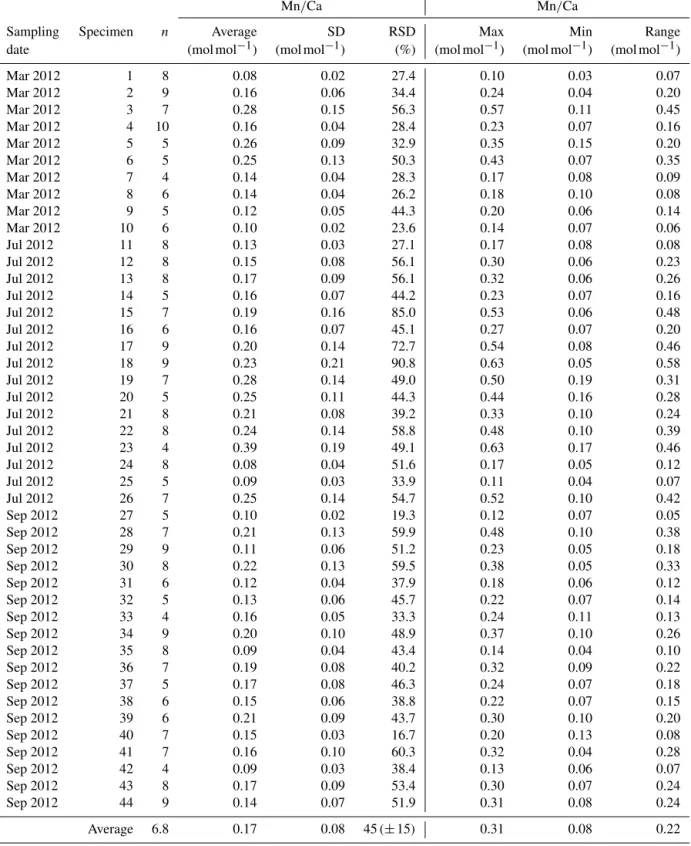
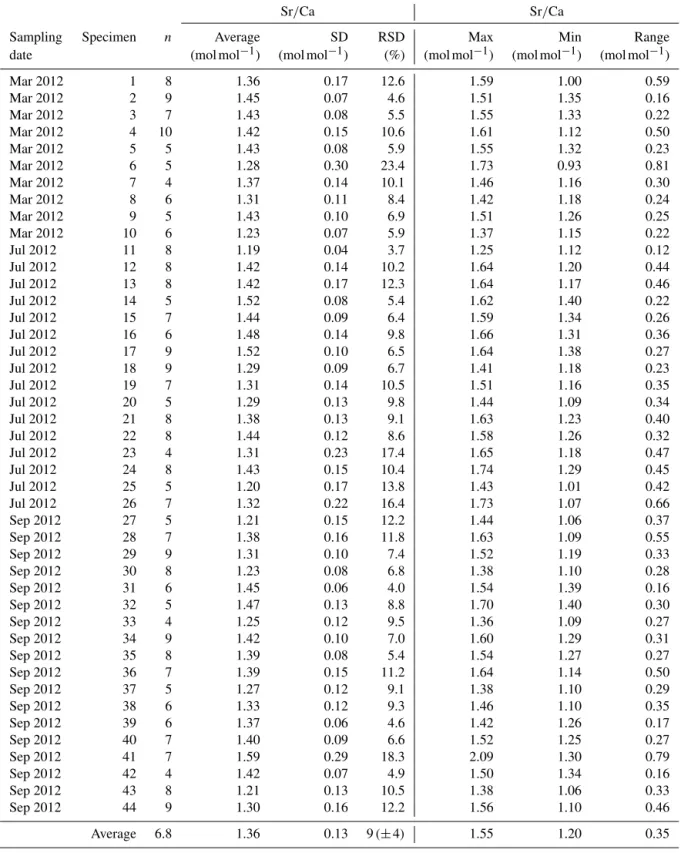
Mn∕Ca intra- and inter-test variability in the benthic foraminifer <i>Ammonia tepida</i>
Texte intégral
Figure


Documents relatifs
The four major elements in transmission paths are station equip- ment (telephones, data sets, etc.), customer loops (cables and wires that connect station
[r]
mathsbdp.fr eeeespace_ space_ space_uuuutilisation_repère space_ tilisation_repère tilisation_repère tilisation_repère. On considère un
Resulta claro entonces que el análisis del itinerario de re- solución recorrido por el alumno aporta una información muy relevante para el estudio del proceso de aprendizaje de
The above claim is a modern interpretation of the Dulac’s classification [Dul08] of such Morse centers in a complex domain, see Lins Neto [LN14, Theorem 1.1]. Indeed, it is easier
Réalisé en béton prêt à l’emploi coulé en place, le dallage d’un bâtiment industriel ou commercial est l’élément de structure de l’ouvrage sans doute le plus
[r]
[r]
