Objectives: We hypothesize that the combined use of MRI corti-cal thickness measurement and subcorticorti-cal gray matter volumetry could provide an early and accurate in vivo assessment of the structural impact of cardiac arrest and therefore could be used for long-term neuroprognostication in this setting.
Design: Prospective cohort study.
Setting: Five Intensive Critical Care Units affiliated to the Uni-versity in Toulouse (France), Paris (France), Clermont-Ferrand (France), Liège (Belgium), and Monza (Italy).
Patients: High-resolution anatomical T1-weighted images were acquired in 126 anoxic coma patients (“learning” sample) 16 ± 8 days after cardiac arrest and 70 matched controls. An additional sample of 18 anoxic coma patients, recruited in Toulouse, was used to test predictive model generalization (“test” sample). All patients were followed up 1 year after cardiac arrest.
Interventions: None.
Measurements and Main Results: Cortical thickness was computed on the whole cortical ribbon, and deep gray matter volumetry was performed after automatic segmentation. Brain morphometric data were employed to create multivariate predictive models using learning machine techniques. Patients displayed significantly extensive cortical and subcortical brain volumes atrophy compared with controls. The accuracy of a predictive classifier, encompassing cortical and sub-cortical components, has a significant discriminative power (learning area under the curve = 0.87; test area under the curve = 0.96). The anatomical regions which volume changes were significantly related to patient’s outcome were frontal cortex, posterior cingulate cortex, thalamus, putamen, pallidum, caudate, hippocampus, and brain stem. Conclusions: These findings are consistent with the hypothesis of pathologic disruption of a striatopallidal-thalamo-cortical meso-circuit induced by cardiac arrest and pave the way for the use of combined brain quantitative morphometry in this setting. (Crit
Care Med ; 45:e763–e771)
Key Words: cardiac arrest; coma; cortical thickness; prognosis; subcortical volumetry
DOI: 10.1097/CCM.0000000000002379
1Department of Anaesthesiology and Critical Care, Critical Care Unit,
University Teaching Hospital of Purpan, Place du Dr Baylac, Toulouse Cedex 9, France.
2Critical Care and Anaesthesiology Department, University Teaching
Hospital of Purpan, Place du Dr Baylac, Toulouse Cedex 9, France.
3Toulouse NeuroImaging Center, Toulouse University, Inserm, UPS, France. 4Department of Anaesthesiology and Critical Care, Critical Care Unit,
Hopital Dieu Hospital, Narbonne, France.
5Department of Anaesthesiology and Critical Care, School of medicine and
Surgery, University Milano Bicocca and Hospital San Gerardo, Monza, Italy.
6Department of Neuroradiology, University Hospital of Clermont-Ferrand,
Clermont-Ferrand, France.
7Department of Anaesthesiology and Critical Care, University Hospital of
Clermont-Ferrand, Clermont-Ferrand, France.
8Laboratoire d’Imagerie Biomédicale (UMR S 1146/UMR 7371),
Univer-sité Pierre-et-Marie-Curie-Paris 06, Paris, France.
9Critical Care and Anaesthesiology Department, Groupe Hospitalier
Pitié-Salpétrière, APHP, Paris, France.
10 Department of Neuroradiology, Groupe Hospitalier Pitié-Salpétrière,
APHP, Paris, France.
11 Cyclotron Research Center and Department of Neurology, University
Hospital and University of Liège, Liège, Belgium.
12 Algology and Palliative Care Department, University Hospital and
Univer-sity of Liège, Liège, Belgium.
Supplemental digital content is available for this article. Direct URL citations appear in the printed text and are provided in the HTML and PDF versions of this article on the journal’s website (http://journals.lww.com/ccmjournal). Drs. Peran and Aubry disclosed government work. Dr. Citerio's institution received funding from Grant Regione Lombardia—General Health Direction RF-2010-2319503. Dr. Galanaud received funding from Medday Pharma-ceuticals. Dr. Fourcade disclosed government work. Dr. Puybasset's institu-tion received funding from PHRC, French ministry on health. The remaining authors have disclosed that they do not have any potential conflicts of interest. For information regarding this article, E-mail: [email protected]; silva.s@ chu-toulouse.fr
Brain Gray Matter MRI Morphometry for
Neuroprognostication After Cardiac Arrest
Stein Silva, MD, PhD
1–3; Patrice Peran, PhD
3; Lionel Kerhuel, MD
1–3; Briguita Malagurski, MSc
3;
Nicolas Chauveau, PhD
3; Benoit Bataille, MD
4; Jean Albert Lotterie, MD, PhD
3; Pierre Celsis, MD, PhD
3;
Florent Aubry, PhD
3; Giuseppe Citerio, MD
5; Betty Jean, MD
6; Russel Chabanne, MD
7;
Vincent Perlbarg, PhD
8; Lionel Velly, MD, PhD
9; Damien Galanaud, MD, PhD
10;
Audrey Vanhaudenhuyse, PhD
11,12; Olivier Fourcade, MD, PhD
2; Steven Laureys, MD, PhD
11;
Louis Puybasset, MD, PhD
9Copyright © 2017 The Author(s). Published by Wolters Kluwer Health, Inc. on behalf of the Society of Critical Care Medicine and Wolters Kluwer Health, Inc. This is an open-access article distributed under the terms of the Creative Commons Attribution-Non Commercial-No Derivatives License 4.0 (CCBY-NC-ND), where it is permissible to download and share the work provided it is properly cited. The work cannot be changed in any way or used commercially without permission from the journal. 2017
M
any comatose post cardiac arrest (CA) patients die or survive with severe disability after a prolonged ICU stay associated with important cost burden. Conversely, the potential for premature withdrawal of life support from patients who may have a chance of functional recovery represents an additional ethical dilemma. Thus, finding accurate prognostic indicators that can reliably iden-tify patients who have a likelihood of meaningful neurologic recovery is a very important healthcare issue (1). Lately, important advances have been made in clinical evaluation, electrophysiology and neuroimaging, providing insights into the underlying pathophysiologic mechanisms of brain injury induced by CA, as well as prognosis (2). Nevertheless, it is worth noting that studies in this field (2, 3) have been prone to substantial biases as: 1) self-fulfilling prophecies of early withdrawal of life-sustaining therapies (i.e., treating physi-cians were not blinded to the results of prognostic test), 2) small sample size and heterogeneity of patients populations, and 3)poorly described outcome measures, generally focused on short-term prognostication.Regarding the brain structural impact of CA, it has been suggested by histological and animal studies that anoxic/ hypoxic encephalopathy is related to diffuse and severe structural damages encompassing brain swelling, cortical laminar necrosis, and basal ganglia necrosis (4). Gray mat-ter seems to have far greamat-ter vulnerability to hypoxia when compared with white matter, particularly in brain regions showing high basal metabolic levels (5). Nevertheless, brain gray matter architectural changes induced by CA have not yet been systematically explored in CA survivors, prob-ably because conventional MRI sequences, as T1-weighted sequences, are currently considered not precise enough to detect brain structural anomalies in this setting and are sup-posed to fail to accurately predict outcome when they are used alone in patients with anoxic/hypoxic encephalopa-thy (2). However, neuroimaging analysis techniques have greatly advanced over the years, and innovative neuroimag-ing methods hold the promise for providneuroimag-ing in vivo insight into these pathophysiologic processes. For example, cortical thickness measurement and deep gray matter quantitative volumetry have been recently used to allow a fine-grained assessment of brain volumes atrophy related to neurode-generative disorders (6, 7).
We hypothesize that the use of cortical thickness measurement and subcortical gray matter quantitative volumetry could provide an accurate in vivo assessment of the impact of anoxic/hypoxic insult induced by CA. We speculate that cortical and subcortical volume atrophy measurements provided by these approaches could be used as accurate predictors of long-term neurologic out-come in this setting. To test this hypothesis, we prospectively stud-ied a large and multicenter cohort of anoxic comatose patients. All patients were prospectively recruited and managed according to standard of care recommendations (5) by clinical practitio-ners blinded to MRI data, to avoid bias related to self-fulfilling prophecies. Patients were scanned during the acute phase follow-ing the CA, exclusively durfollow-ing coma state, in standardized clinical
conditions. Finally, the prognostic value of neuroimaging record-ings was assessed against long-term neurologic outcome using a validated clinical score (8), 1 year after injury.
MATERIALS AND METHODS Participants
This prospective, multicenter study was undertaken in five Intensive Critical Care Units affiliated to the University in Tou-louse (France), Paris (France), Clermont-Ferrand (France), Liège (Belgium), and Monza (Italy) between October 2011 and October 2014. We compared CA survivors who met the strict clinical definition of coma (Glasgow Coma Scale at the admis-sion to hospital < 8 with motor responses < 6) to sex and age-matched healthy volunteers. In patients, clinical examination was repeatedly performed using standardized scales (Glasgow Coma Score on the day of scanning and 1 year later using the Glasgow Outcome Scale [GOS]-E [8]). All patients were pro-spectively recruited and managed according to standard of care recommendations (5) by clinical practitioners blinded to MRI data. The Ethics committee of each recruiting center approved this study. Informed consent to participate to the study was obtained from the subjects themselves in the case of healthy subjects and from the legal surrogate of the patients.
Imaging Procedures
Acquisitions. In all subjects, high-resolution anatomical
image, using 3D T1-weighted sequence (in plane, 160 contigu-ous slices) was acquired using 3 T MR scanners. All patients were scanned less than 1 month after CA (MRI delay after CA, 16 ± 8 d). Monitoring of vital variables was performed by a senior intensivist throughout the experiment. All patients were in coma during the MRI scan.
Analysis. Analysis was performed by investigators who
were blinded to the clinical information and outcomes data. To proceed to cortical thickness measurement, brain volumes were resampled to a 1 × 1 × 1 mm resolution and then seg-mented using Statistical Parametric Mapping 8 (http://www. fil.ion.ucl.ac.uk/spm/). Cortical thickness was computed on the whole cortical ribbon in the native space of the sub-ject’s brain, using a Laplace’s equation-based algorithm (9). The 3D cortical thickness map was registered in a standard-ized and parcellated into 96 areas (48 Brodmann areas × 2 hemispheres). To reinforce the robustness of the measures, these areas were then grouped into 20 zones (10 zones × 2 hemispheres) following pathophysiologic criteria (7). A mean cortical thickness was computed for each zone of each subject (mean between right and left brain hemispheres).
Deep gray matter quantitative volumetry was performed using FSL 4.1 (FMRIB, Software Library V5.0, Analysis Group, Oxford, United Kingdom; http://www.fmrib.ox.ac.uk/fsl/) and in house software developed in Matlab (6). For each subject, deep gray matter structures and brain stem were segmented. To reduce the effects of interindividual variability in head size, individual volume values were multiplied by a normalization factor from the corresponding T1-weighted image.
Outcome Assessment
All patients were followed up until death or 1 year after CA in survivors. The principal outcome measure was the extended version of the GOS-E (8), which was measured by blinded assessors. This scale classifies patients into eight categories as follows: GOS-E score of 1, death; 2, vegetative state/unrespon-sive wakefulness syndrome; 3, lower severe disability; 4, upper severe disability; 5, lower moderate disability; 6, upper moder-ate disability; 7, lower good recovery; and 8, upper good recov-ery. Among survivors, any GOS-E score from 2 to 4 was defined as an “unfavorable outcome” (UFO), whereas a score from 5 to 8 was defined as a “favorable outcome” (FO).
Statistical Analysis
Normally distributed variables were expressed as mean ± sd
and nonnormally distributed variables as median (interquar-tile range, 25–75). FO patients were compared with UFO patients. Continuous variables were compared using Student t test or the Mann-Whitney U test, as appropriate. A Student-Newman-Keuls post hoc analysis was used to identify sample means that are significantly different from each other. Categor-ical variables were compared using the chi-square test.
To examine the potential relationship between cortical and subcortical morphometric changes induced by hypoxic/anoxic insult, a cross-correlation matrix and a principal component analysis (PCA) were applied to the whole dataset.
To specifically address the prognosis value of cortical thick-ness measurement and subcortical gray matter quantitative volumetry, we used a supervised learning machine approach to elaborate and validate a mathematical model trained on labeled examples. To do so, two independent patients sample were used: 1) a learning sample was employed to establish the best classification model and then was tested using a repeated 10-fold cross-validation procedure and 2) a validation sam-ple, which was not used during the previous phase and was employed to test degeneralization of the model.
Normalized cortical and subcortical morphometric data were used as independent variables and employed to estimate partial least square (PLS) regression (10) (e-text1, Supplemental Digital Content 1, http://links.lww.com/CCM/C459) to predict two final diagnoses (FO and UFO) using a unique linear multi-variate model. Nonsurvivors patients (GOS-E score of 1) were not included in this predictive analysis. Actually, patient’s mor-tality during the early phase after CA resuscitation is frequently related to multiple organ failures, which could not be directly related to CA-induced structural brain injury and consequently to patient’s potential of neurologic recovery. Furthermore, deci-sions of early withdrawal of life-sustaining therapies constitute a potential confounder in this setting and justify taking into account this possible source of bias (2).
PLS latent variables were calculated from the largest covari-ance between the independent and dependent variables (MRI data and outcome, respectively). PLS components with an eigen-value superior to one were included in the model. To avoid over-fitting risk, the data of the validation set were used to evaluate the predictive abilities of the obtained model. The standardized
coefficients and 95% CIs of each variable were determined using a bootstrap procedure (100,000 permutations). Finally, a binary logistic regression was performed on the PLS components to convert PLS values of each observation into a probability score.
Receiver operating characteristic (ROC) (11) curves were calculated for the predictive model, and the highest sum of sensitivity and specificity was considered as being the opti-mal threshold. Positive and negative likelihood ratios were also estimated from this optimal threshold. All p values were two-tailed, and statistical significance was defined as a p value of less than 0.05. Analyses were performed using SPSS (SPSS, Chicago, IL), Statistica (Statsoft, Tulsa, OK), and Tanagra 1.4.50 (Rakotomalala, Lyon University, France) softwares. RESULTS
Participants
We compared 126 CA survivors who met the clinical definition of coma (sex ratio, 0.8; age range, 23–51) to 70 sex and age-matched healthy volunteers (sex ratio, 0.7; age range; 24–45). e-table 1 (Supplemental Digital Content 2, http://links.lww. com/CCM/C460) and e-fig. 6 (Supplemental Digital Content 9, http://links.lww.com/CCM/C467 —legend, Supplemental Digi-tal Content 10, http://links.lww.com/CCM/C46) report demo-graphic and clinical characteristics of the patients. To predict outcome in 1-year survivors (37 from the initial 126 patients), data from these patients were used to constitute a learning sample aiming to elaborate a predictive model using machine-learning techniques. Additionally, a validation sample of CA patients in coma, exclusively recruited in Toulouse (18 CA patients in coma, sex ratio, 0.9; age range, 22–57) and which was not used during the previous phase, was used to test the model generalization. CA Impact on Brain Volumes
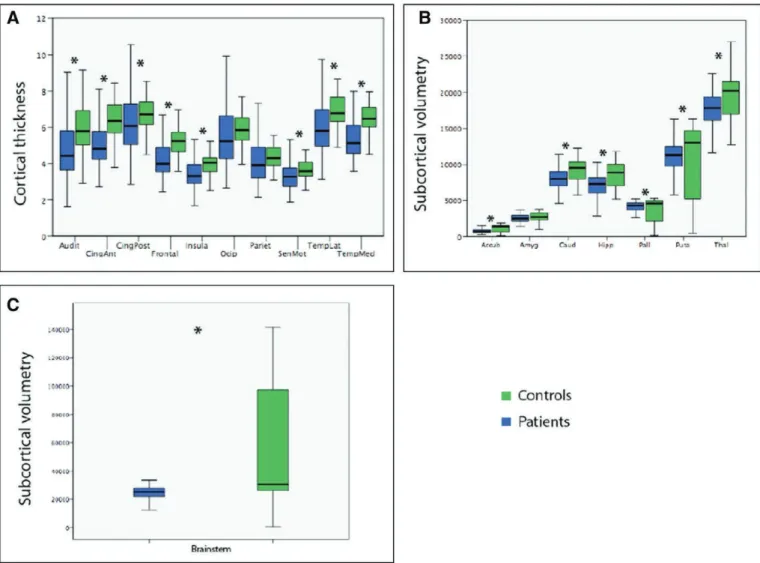
Whole brain mean cortical thickness significantly differed between patients and controls (Fig. 1). Furthermore, a New-man-Keuls post hoc analysis showed that all cortical zones significantly differed in terms of cortical thickness between both groups (interaction group × anatomical region, F = 10.9; p < 0.0001).
Regarding subcortical morphometric changes induced by CA, results showed that the global measurement of basal gan-glia, thalamus, and brain stem volumes was significantly dif-ferent between coma patients and controls (Fig. 1). In sum, anoxic comatose patients displayed significantly extensive cortical and subcortical brain volumes atrophy compared with sex- and age-matched controls.
Cortical and Subcortical Specific Vulnerability
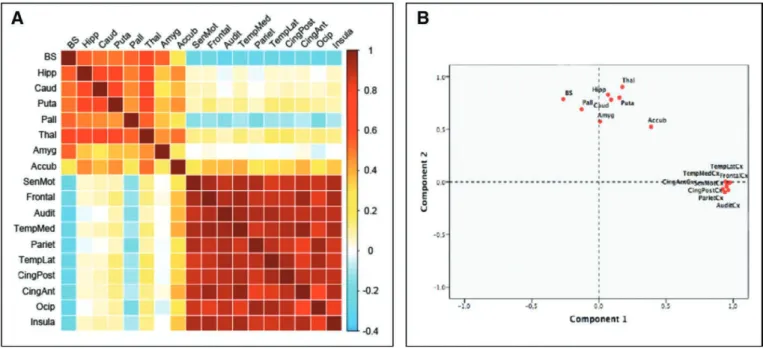
To examine the potential relationship between cortical and subcortical morphometric changes induced by hypoxic/anoxic insult, a cross-correlation matrix (Fig. 2A) and a PCA were applied to the whole dataset (Fig. 2B). It is worth noting that the whole brain morphometric correlation matrix suggests a dissociated cortical and subcortical pattern of structural sus-ceptibility (Fig. 2A). Congruently, the distribution of the PCA
values (Fig. 2B) with the two first components uncovers the fact that the cortical atrophy observed in all the defined brain zones significantly correlates to principal component 1 and that the volume decrease, which has been identified in subcor-tical structures (i.e., basal ganglia, thalamus, and brain stem) in patients compared with controls, seems to be independent of the degree of cortical atrophy, as suggested by their significant correlation with the principal component 2.
To summarize, the impact of CA on subcortical and cortical gray matter morphometry seemed to be dissociated. A specific pattern of atrophy was observed among cortical regions and between the whole set of subcortical structures. In other words, regarding CA-induced gray matter volume reductions, corti-cal and subcorticorti-cal structures behave as independent groups: the volumetric change of each gray matter structures seems to be specifically correlated with the degree of atrophy that is observed in structures of the same group (i.e., cortical vs subcortical).
Predictive Value
Admission characteristics of the patients according to their out-come are presented in e-table 1 (Supplemental Digital Content 2, http://links.lww.com/CCM/C460); there were no significant demographic differences between survivors’ comatose patients with favorable (GOS-E, 5–8) and UFO (GOS-E, 2–4). No dif-ference was found in the timing of MRI scan between FO and UFO patients. Nevertheless, patients with FO differed from patients with UFO by a significant and specific decrease of cor-tical thickness in the frontal cortex (p < 0.001) and the volume reduction at the level of the thalamus, putamen, and pallidum (p < 0.001, p < 0.01, and p < 0.008, respectively) (Table 1).
Additionally, we investigated using machine-learning meth-ods the accuracy of a predictive classifier built on the whole dataset of cortical thickness and subcortical volumes mea-surements. One model was tested using morphometric data (e-fig. 1, Supplemental Digital Content 4, http://links.lww. com/CCM/C462 —legend, Supplemental Digital Content 10,
Figure 1. Quantitative cortical (A) and subcortical (B and C) morphometric differences between patients and controls. Normalized 3D cortical thickness maps (mm) and subcortical volumes (mm3) were obtained and compared between coma patients and sex and age-matched controls (false discovery rate
corrected p values for multiple comparisons, p < 0.05). Accub = accumbens nucleus, Amyg = amygdala, Audit = auditory cortex, Caud = caudate nucleus, CingAnt = anterior cingulate cortex, CingPost = posterior congulate cortex, Frontal = frontal cortex, Hipp = hippocampus, Insula = insula, Occip = occipital cortex, Pariet = parietal cortex, Pall = pallidum, Puta = putamen, SenMot = sensory motor cortex, TempLat = lateral temporal cortex, TempMed = medial temporal cortex, Thal = thalamus.
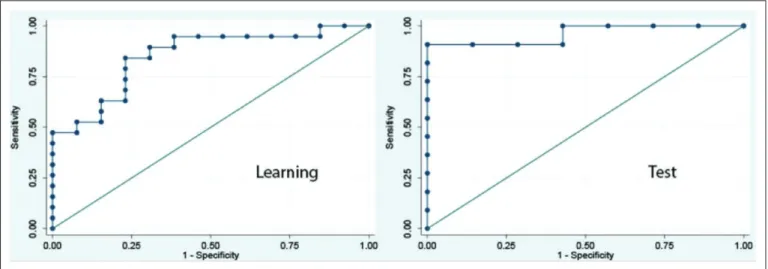
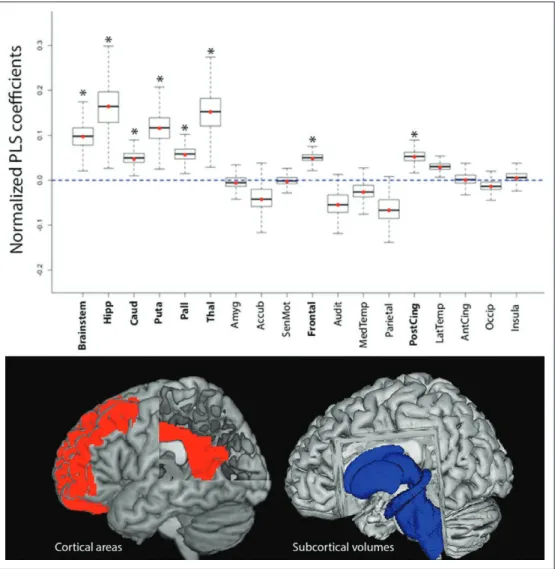
http://links.lww.com/CCM/C468; and e-fig. 2, Supplemental Digital Content 5, http://links.lww.com/CCM/C463 —legend, Supplemental Digital Content 10, http://links.lww.com/CCM/ C468). During the learning phase, area under the ROC (area under the curve [AUC]) values showed that a composite model encompassing cortical and subcortical components has the optimal discriminative power (AUC = 0.87; Fig. 3) (e-table 2, Supplemental Digital Content 3, http://links.lww.com/CCM/ C461). Data obtained during the validation phase confirm the accuracy and robustness of the predictive model (AUC = 0.96; Fig. 3) (e-table 2, Supplemental Digital Content 3, http://links. lww.com/CCM/C461; e-fig. 3, Supplemental Digital Content 6, http://links.lww.com/CCM/C464 —legend, Supplemental Digital Content 10, http://links.lww.com/CCM/C468; and e-fig. 5, Supplemental Digital Content 8, http://links.lww.com/CCM/ C466 —legend, Supplemental Digital Content 10, http://links. lww.com/CCM/C468). It must be highlighted that the anatomi-cal regions which volume changes were significantly related to patient’s outcome in the combined predictive model were fron-tal cortex, posterior cingulate cortex, thalamus, putamen, pal-lidum, caudate and brain stem (Fig. 4). Finally, to illustrate the potential bedside use of this approach for neuroprognostica-tion, the cross-validated predictive model described in the cur-rent study was integrated in an open-source application which
permits the individual estimation of 1-year outcome of CA sur-vivors patients in coma, using MRI gray matter morphometric data (e-fig. 4, Supplemental Digital Content 7, http://links.lww. com/CCM/C465 —legend, Supplemental Digital Content 10, http://links.lww.com/CCM/C468).
DISCUSSION
Neuroimaging shows promise for determining early prognosis based on structural brain injury (2). Nevertheless, conventional MRI sequences, as T1-weighted sequences, are presently con-sidered not precise enough to detect brain structural anomalies induced by CA (2). The current study suggests that the use of gray matter morphometry, obtained from standard brain T1-weighted acquisition, enables an accurate in vivo evaluation of the structural impact of anoxic/ischemic brain injury in this challenging setting.
Remarkably, our data suggest that the prognostic value of gray matter morphometry in CA survivors is not related to the total amount of cortical or subcortical global atrophy induced by CA, but to the specific structural impairment of the fron-tal cortex, the posterior cingulate cortex, the hippocampus, the brain stem, the thalamus, and the striatopallidal system. All these cortical and subcortical structures are believed to underlie con-scious processing (12) and willful behavior (13). Indeed, both
Figure 2. A, Whole brain morphometric correlation matrix. Table showing the Pearson correlation (r) coefficients between cortical and subcortical gray matter morphometric data. Direction and strength of the linear relationship between the variables (whether causal or not) is represented by r values (ranging from –1 to +1, coded in blue to red, respectively). A correlation matrix is symmetric because the correlation between Xi and Xj is the same as the correlation between Xj and Xi. It is worth noting that volumetric changes in subcortical regions are mainly correlated with anatomical changes in others subcortical structures (i.e., left and upper part of the matrix). As a counterpart, the degree of cortical atrophy induced by CA seems to be specifically correlated with the volumetric changes observed in other cortical regions (i.e., right and lower part of the matrix). B, Principal component analysis (PCA) of cortical thickness and subcortical volumes measured in patients (82% of the variability is accounted on the component 1/component 2 plane). PCA is a statistical procedure that uses an orthogonal transformation to convert a set of observations of possibly correlated variables into a set of values of linearly uncorrelated variables called “principal components.” PCA is mostly used as a tool in exploratory data analysis and can be thought of as revealing the internal structure of the data in a way that best explains the variance in the data. In this case, PCA method permits to identify that the morphometric changes induced by CA are significantly correlated among cortical regions (i.e., correlation with component 1) and within the set of subcortical volumes (i.e., correlation with component 2) but are largely independent between them (i.e., orthogonal components). Accub = accumbens nucleus, Amyg = amygdala, Audit = auditory cortex, BS = brain stem, Caud = caudate nucleus, CingAnt = anterior cingulate cortex, CingPost = posterior congulate cortex, Frontal = frontal cortex, Hipp = hippocampus, Insula = insula, Occip = occipital cortex, Pall = pallidum, Pariet = parietal cortex, Puta = putamen, SenMot = sensory motor cortex, TempLat = lateral temporal cortex, TempMed = medial temporal cortex, Thal = thalamus.
TABLE 1.
Patients Outcome and Brain Quantitative Morphometry
Gray Matter Morphometry
Favorable Outcome (n = 11) Unfavorable Outcome (n = 26)
p
Median IQR (25–75) Median IQR (25–75)
Cortical thickness (mm) Frontal 4.2 3.7–4.5 3.5 3.2–4 0.001 Sensorimotor 3.3 3–3.4 2.7 2.3–3.5 0.2 Medial temporal 5.5 4.7–5.8 4.8 4.7–5.7 0.3 Lateral temporal 6.1 5.5–6.5 5.3 4.6–6.1 0.3 Parietal 3.9 3.7–4.2 3.3 3–4.6 0.1 Anterior cingulate 5 4.5–5.5 4.3 3.6–5.7 0.09 Posterior cingulate 6.2 5.3–6.9 5 4.8–6.9 0.06 Auditory 4.7 4.1–5.4 3.9 3.3–5.2 0.3 Insula 3.4 2.9–3.6 2.9 2.5–3.3 0.5 Occipital 5.4 5–6.3 4.4 3.5–6.2 0.2 All regions 4.8 4.3–5 4 3.5–5 0.01
Subcortical structures volumes (mm3)
Thalamus 18,952 17,630–19,779 17,689 14,179–18,150 0.001 Caudate 8,563 7,484–9,048 8,210 6,752–8,743 0.06 Putamen 12,122 11,698–13,149 10,351 8,028–10,689 0.01 Pallidum 4,592 4,435–4,708 3,786 3,155–4,416 0.008 Amygdala 2,419 2,001–2,833 2,206 1,499–3,072 0.08 Accumbens 746 571–968 627 574–911 0.4 All structures 8,563 7,484–9,048 8,210 6,752–8,743 0.04 Brainstem volume (mm3) 26,839 23,608–29,398 22,832 21,280–27,311 0.07
IQR = interquartile range.
Results are expressed as median (interquartile range, 25–75). Favorable outcome = Glasgow Outcome Scale Extended (GOS-E), 5–8; Unfavorable outcome = GOS-E, 2–4. Patient’s outcome was assessed 1 yr after cardiac arrest.
Boldface font indicates significant p values (p < 0.05).
Figure 3. Predictive value. Receiver operating characteristic curves depicting the relationship between the proportion of true-positive findings and the proportion of false-positive findings. Estimation performances on outcome prediction of the combined morphometric cortical and subcortical partial last square model (favorable outcome vs unfavorable outcome) are represented as areas under the curve (AUC). Learning sample AUC = 0.87 (0.67–0.95); test sample AUC test = 0.96 (0.88–1).
the frontal cortex and the posterior cingulate cortex have dense structural and functional connections suggesting a role as corti-cal hubs (14), an essential property for complex cognitive process (15). A selective hypometabolism in these cortical structures has been reported in a wide range of altered conscious states such as sleep (16), drug-induced anesthesia (17), or acquired disor-ders of consciousness induced by brain injury (18, 19). The brain stem, encompassing the ascending reticular activation system, is located at a critical juncture in the inflow of sensory informa-tion and can modulate wakefulness and awareness. It is worth noting that a significant impairment of functional connectivity has been described in anoxic/ischaemic patient with chronic dis-orders of consciousness, between the brain stem and the poste-rior cingulate cortex/précuneus (20) or the hippocampus (21).
Finally, thalamic and striatopal-lidal structures are intercon-nected in large-scale loops that are involved in forebrain func-tion (22). Corticothalamic and corticostriatal dynamic con-nectivity seems to be crucial for high-level cognitive processing including attentional focus (23), volition (24), and motor control (25). The integrity of these cor-tico-subcortical networks has been related to the severity of a patient’s disorder of conscious-ness on acute (26) and chronic setting (27). Overall, these find-ings are consistent with the idea that functional/structural impairment within a cortico- striatopallidal-thalamo-cortical mesocircuit is characteristic of disorder of consciousness observed in severe brain injury patients (28).
Additionally, our data sug-gest that gray matter quanti-tative morphometry could be useful to improve our under-standing of the underlying pathophysiology of hypoxic/ anoxic encephalopathy. Actually, we identified early after CA, a specific pattern of atrophy of gray matter vol-umes, suggesting a dissoci-ated vulnerability to primary hypoxic/anoxic injury (29) or secondary brain insults (5), of cortical regions compared with subcortical structures. Alternatively, this dissociated pattern of anatomical cou-pling between cortical/subcortical structures after CA could be interpreted as the consequence of massive anatomical (30) and functional (18) long-range disconnections between these structures, in agreement with theoretical models conscious processing (13, 31).
Studies in the challenging field of neuroprognostica-tion of hypoxic-ischaemic coma are prone to substantial biases (2, 32). The present multicenter prospective study was designed to limit the impact of inherent biases as the sample size, the heterogeneity of the studied population, the tim-ing of patient’s assessment, and circular reasontim-ing (i.e., self-fulfilling prophecy) (33). Nevertheless, our study has several limitations. As a variant with previous neuroimaging studies of disorders of consciousness (34), we controlled potential
Figure 4. Model components. Cortical and subcortical morphometric data were used as independent variables and then employed to estimate partial last square (PLS) regression to predict final outcome. PLS components with an eigenvalue superior to 1 were included in the multivariate predictive model (favorable outcome vs unfavorable outcome). Normalized PLS coefficients, obtained by a bootstrap procedure (100,000 permutations), are depicted as whisker box plots (median, interquartile range, 95% CI). The bottom illustrates the topography of the cortical (red) and subcortical (blue) structures, whose structural changes were significantly associated with 1-year patients outcome. Accub = accumbens nucleus, Amyg = amygdala, Audit = auditory cortex, Caud = caudate nucleus, CingAnt = anterior cingulate cortex, CingPost = posterior congulate cortex,
Frontal = frontal cortex, Hipp = hippocampus, Insula = insula, Pall = pallidum, Puta = putamen, Occip = occipital cortex, Pariet = parietal cortex, SenMot = sensory motor cortex, TempLat = lateral temporal cortex,
confounding factors, by a sex and age match between patients and healthy volunteers. Nevertheless, it could be argued that additional factors, such as comorbid conditions (7) or socio-cultural level (35), could potentially contribute to brain atro-phy. This point needs to be addressed in future studies in the field. Furthermore, the current study was designed to pro-vide a snapshot of the impact of CA on brain gray matter volumes, and the timing of neuroimaging acquisitions was decided to obtain the best balance between clinical relevance and study feasibility. Several points must be highlighted that justify the level standardization and consistency in the timing of MRI of the current study: 1) to avoid confounding fac-tors, all patient MRI assessments were conducted at least 2 days (4 ± 2 d) after a complete withdrawal of sedative drugs therapies and under normothermic conditions, 2) to guar-antee patients management according to standard of care recommendations, patients transfer to the imaging centers was exclusively performed after achievement of clinical sta-bility, and 3) to specifically address the impact of cortical and subcortical gray matter atrophy induced by CA, we focused the MRI assessment during the consistent acute period that follows early brain edema development. Future longitudinal neuroimaging studies will need to focus on repeated brain scan acquisitions after CA, aiming to disentangle the dynamic structural signatures of brain injury in this setting and ulti-mately identify the best timing to use such neuroimaging bio-markers for neuroprognostication.
We do not anticipate that the brain cortical and subcortical quantitative morphometry will be used in isolation as a prog-nosticator for post CA patients, but rather in conjunction with other prognostic variables (2, 36). Clinicians should continue to use all the available tools to provide accurate prognostic advice in this challenging setting. Eventually, we suggest that a quantitative prognostic outcome model incorporating serial neurologic assessment, multimodal MRI (encompassing struc-tural and functional data) with variables such as electrophysio-logic measurement, is likely to prove most powerful in assisting in decision making regarding continuation or withdrawal of life support in these patients.
REFERENCES
1. Laureys S, Boly M: The changing spectrum of coma. Nat Clin Pract Neurol 2008; 4:544–546
2. Greer DM, Rosenthal ES, Wu O: Neuroprognostication of hypoxic-ischaemic coma in the therapeutic hypothermia era. Nat Rev Neurol 2014; 10:190–203
3. Young GB: Clinical practice. Neurologic prognosis after cardiac arrest. N Engl J Med 2009; 361:605–611
4. Adams JH, Graham DI, Jennett B: The neuropathology of the vegeta-tive state after an acute brain insult. Brain 2000; 123 (Pt 7):1327– 1338
5. Nolan JP, Neumar RW, Adrie C, et al: Post-cardiac arrest syndrome: Epidemiology, pathophysiology, treatment, and prognostication. A Scientific Statement from the International Liaison Committee on Resuscitation; the American Heart Association Emergency Cardio-vascular Care Committee; the Council on CardioCardio-vascular Surgery and Anesthesia; the Council on Cardiopulmonary, Perioperative, and Critical Care; the Council on Clinical Cardiology; the Council on Stroke. Resuscitation 2008; 79:350–379
6. Péran P, Cherubini A, Assogna F, et al: Magnetic resonance imaging markers of Parkinson’s disease nigrostriatal signature. Brain 2010; 133:3423–3433
7. Querbes O, Aubry F, Pariente J, et al; Alzheimer’s Disease Neu-roimaging Initiative: Early diagnosis of Alzheimer’s disease using cortical thickness: Impact of cognitive reserve. Brain 2009; 132: 2036–2047
8. Jennett B, Snoek J, Bond MR, et al: Disability after severe head injury: Observations on the use of the Glasgow Outcome Scale. J Neurol Neurosurg Psychiatry 1981; 44:285–293
9. Jones SE, Buchbinder BR, Aharon I: Three-dimensional mapping of cortical thickness using Laplace’s equation. Hum Brain Mapp 2000; 11:12–32
10. McIntosh AR, Lobaugh NJ: Partial least squares analysis of neuro-imaging data: Applications and advances. Neuroimage 2004; 23 (Suppl 1):S250–S263
11. Bewick V, Cheek L, Ball J: Statistics review 13: Receiver operating characteristic curves. Crit Care 2004; 8:508–512
12. Baars BJ, Ramsøy TZ, Laureys S: Brain, conscious experience and the observing self. Trends Neurosci 2003; 26:671–675
13. Crick F, Koch C: A framework for consciousness. Nat Neurosci 2003; 6:119–126
14. Achard S, Delon-Martin C, Vértes PE, et al: Hubs of brain functional networks are radically reorganized in comatose patients. Proc Natl Acad Sci U S A 2012; 109:20608–20613
15. Sporns O: The human connectome: A complex network. Ann N Y Acad Sci 2011; 1224:109–125
16. Horovitz SG, Braun AR, Carr WS, et al: Decoupling of the brain’s default mode network during deep sleep. Proc Natl Acad Sci U S A 2009; 106:11376–11381
17. Amico E, Gomez F, Di Perri C, et al: Posterior cingulate cortex-related co-activation patterns: A resting state FMRI study in propofol-induced loss of consciousness. PLoS One 2014; 9:e100012
18. Silva S, de Pasquale F, Vuillaume C, et al: Disruption of posteromedial large-scale neural communication predicts recovery from coma. Neu-rology 2015; 85:2036–2044
19. Vanhaudenhuyse A, Noirhomme Q, Tshibanda LJ, et al: Default network connectivity reflects the level of consciousness in non-communicative brain-damaged patients. Brain 2010; 133:161–171
20. Silva S, Alacoque X, Fourcade O, et al: Wakefulness and loss of awareness: Brain and brainstem interaction in the vegetative state. Neurology 2010; 74:313–320
21. Di Perri C, Bastianello S, Bartsch AJ, et al: Limbic hyperconnectivity in the vegetative state. Neurology 2013; 81:1417–1424
22. Shepherd GM: Corticostriatal connectivity and its role in disease. Nat Rev Neurosci 2013; 14:278–291
23. Zuo XN, Di Martino A, Kelly C, et al: The oscillating brain: Complex and reliable. Neuroimage 2010; 49:1432–1445
24. Posner MI, Dehaene S: Attentional networks. Trends Neurosci 1994; 17:75–79
25. Bremmer F, Schlack A, Shah NJ, et al: Polymodal motion process-ing in posterior parietal and premotor cortex: A human fMRI study strongly implies equivalencies between humans and monkeys. Neu-ron 2001; 29:287–296
26. Noirhomme Q, Soddu A, Lehembre R, et al: Brain connectivity in pathological and pharmacological coma. Front Syst Neurosci 2010; 4:160
27. Monti MM, Rosenberg M, Finoia P, et al: Thalamo-frontal connectiv-ity mediates top-down cognitive functions in disorders of conscious-ness. Neurology 2015; 84:167–173
28. Schiff ND: Recovery of consciousness after brain injury: A mesocir-cuit hypothesis. Trends Neurosci 2010; 33:1–9
29. Choi DW: Ischemia-induced neuronal apoptosis. Curr Opin Neuro-biol 1996; 6:667–672
30. Galanaud D, Naccache L, Puybasset L: Exploring impaired conscious-ness: The MRI approach. Curr Opin Neurol 2007; 20:627–631 31. Dehaene S, Changeux JP: Experimental and theoretical approaches
32. Hahn DK, Geocadin RG, Greer DM: Quality of evidence in studies evaluating neuroimaging for neurologic prognostication in adult patients resuscitated from cardiac arrest. Resuscitation 2014; 85:165–172 33. Mohri M, Rostamizadeh A, Talwalkar A: Foundations of Machine
Learning. Cambridge, MA, The MIT Press, 2012
34. Laureys S, Schiff ND: Coma and consciousness: Paradigms (re) framed by neuroimaging. Neuroimage 2012; 61:478–491
35. Coffey CE, Saxton JA, Ratcliff G, et al: Relation of education to brain size in normal aging: Implications for the reserve hypothesis. Neurol-ogy 1999; 53:189–196
36. Sandroni C, Cariou A, Cavallaro F, et al: Prognostication in comatose survivors of cardiac arrest: An advisory statement from the European Resuscitation Council and the European Society of Intensive Care Medicine. Resuscitation 2014; 85:1779–1789