HAL Id: hal-02413956
https://hal.archives-ouvertes.fr/hal-02413956
Submitted on 7 Jul 2020HAL is a multi-disciplinary open access archive for the deposit and dissemination of sci-entific research documents, whether they are pub-lished or not. The documents may come from teaching and research institutions in France or abroad, or from public or private research centers.
L’archive ouverte pluridisciplinaire HAL, est destinée au dépôt et à la diffusion de documents scientifiques de niveau recherche, publiés ou non, émanant des établissements d’enseignement et de recherche français ou étrangers, des laboratoires publics ou privés.
Distributed under a Creative Commons Attribution| 4.0 International License
dynamics
Jean-Yves Trosset, Sami Tliba, Ali El Ati, Hela Friha, Estelle Mogensen,
Jawher Kahouli, Robin Lacombe, Ouerdia Arkoun, Sette Diop, Rodrigo
Ledesma-Amaro, et al.
To cite this version:
Jean-Yves Trosset, Sami Tliba, Ali El Ati, Hela Friha, Estelle Mogensen, et al.. Influence of micro-environment on yeast population dynamics. Ecological Engineering and Environment Protection, National Society of Ecological Engineering and Environment Protection, 2019, 2019 (2), pp.5-13. �10.32006/eeep.2019.2.0513�. �hal-02413956�
Ecological Engineering and Environment Protection, No 2, 2019, p. 5-13
doi.org/10.32006/eeep.2019.2.0513
This article is distributed under the terms of 5 the Creative Commons Attribution License
I. MICROORGANISMS AND ENVIRONMENT
INFLUENCE OF MICRO-ENVIRONMENT ON YEAST
POPULATION DYNAMICS
Jean-Yves Trosset, Sami Tliba, Ali El Ati, Hela Friha, Estelle Mogensen, Jawher Kahouli, Robin Lacombe, Ouerdia Arkoun, Sette Diop, Rodrigo Ledesma-Amaro, Islam Boussaada
Abstract: Abundance or scarcity of external nutrients is a metabolic trigger, especially for highly proliferative cells
such as bacteria, yeasts, parasites or tumors. In presence of oxygen cells usually adopt efficient metabolism in order to maximize energy production yield in poor diet. If nutrient resource increases, a metabolic shift from efficient metabolism (respiration) to inefficient metabolism (fermentation) is reflecting a minimal cost principle of living systems to optimize fitness. This is known as the Crabtree/Warburg effect. Identifying a model that describes the population dynamics of cells and the input growth condition are the goals of this study. Proof of principle has been constructed using a battery of growth experiments on Crabtree-positive yeasts–Saccharomyces under various conditions of glucose in aerobic and micro-aerobic conditions. General cell growth model estimating metabolic shift has been constructed based on an Auto Regressive approach.
Keywords: Yeast, Population dynamics, Modeling, Identification.
1. INTRODUCTION
Nutrient deficiency is often the source of ingenuity in living systems that developed efficient strategies to optimize growth and/or fitness. In abundance of nutrients, living systems seems to follow a least action principle by living aside costly strategies for survival. This is a key issue to animals such as pinnipeds and seabirds which have to commute between their breeding central colony on land and their foraging at sea. For distant capture zones, breeding may be at risk and strategic decision should be made between different metabolic costs to optimize fitness. Such ecosystem has been studied recently using this minimal cost/fitness ratio principle [1].
Such principle can also be applied at a cellular level to understand metabolic shifts under various conditions of the micro-environment [2]. If nutrient is abundant i.e. easily available, as pinnipeds do not need to cover large distance to reach forage place, cells do not need to maintain costly enzymatic pathways such as mitochondrial machinery to produce energy for cell proliferation.
The shift from respiration to fermentation is another example of such strategic decision that cells make even in presence of oxygen when passing from scarcity to abundance of nutrients. This is known as the Crabtree/Warburg effect. Due to its implication in metabolic-based cancer therapies [3] and in control-based bio-production optimization processes [4], a regain of interest has been recently seen in deciphering the paradox associated to the mechanism of action of Crabtree
effect. A consensus emerges: at a sufficiently high sugar concentration in the micro-environment, the efficient respiration machinery for ATP production is replaced by a less efficient fermentative pathway but with faster ATP turnover which conducts to faster growth rate [5].
Generic models of metabolic network of central carbon metabolism [6–8] or formal models of regulation of energetics metabolism [9] have been developed to understand this metabolic competition with the hope to relate this to population dynamics. One step forward in controlling Crabtree effect, is to decipher how micro-environment such as oxygen influences the glucose threshold at which this effect arises.
This paper analyzed growth experiments carried out on yeast Saccharomyces cerevisiae (baker’s yeast) to identify population dynamics estimators of the metabolic shifts from respiration to mixed respiro-fermentative metabolism using various glucose and oxygen conditions.
Large scale yeast growth experiments with replicates have been carried out on 96 well plates under various glucose starting condition under high or low presence of oxygen. Average intrinsic dynamic parameters using exponential and logistic models have been determined using auto-regressive statistical approach. This paper shows two major finding: i) the facility to recover very fluctuating experimental data with a single or two-parameters autoregressive models (exponential or logistic) and ii) the capacity of the model to identify the glucose concentration range for an optimum
respiro-6 fermentative metabolism. The capacity of the exponential and logistic models to elucidating these quantitative bio-indicators of Crabtree/Warburg effect will also be presented and discussed in the final section.
2. MATERIAL AND METHODS 2.1. Strains and media
The widely used S. cerevisiae strain BY4741 was used in this study. The prototrophic strains generated in this study are listed in Supplementary Table 1. The rich media used in this study was YPD (X g/L glucose (Sigma), 1% peptone (BD bioscience) and 1% yeast extract (BD bioscience). X varies from 0, 0.1, 0.5, 1, 5, 10, 30, 50, 75, 100, 200 to 300 g/L.
2.2 Culture conditions
Growth tests were performed in 100-µL cultures in 96-well plates, with either constant shaking (aerobic) or no shaking (micro-aerobic/anoxic), in YPD as carbon source at 28 °C. Growth was monitored by measuring the optical density (OD600nm) at different intervals with a microtiter plate reader (Biotek, Colmar, France). For each strain and set of conditions, we used at least two biological replicates. Pre-cultures were carried out in overnight flasks and the initial OD was set to 0.1.
3. PARAMETER IDENTIFICATION
Roughly speaking, system identification consists in building mathematical models of dynamical systems from observed input–output data. It can be seen as the first building block for the regulation and control tasks for applicative aims. System identification is a very large topic, with different techniques that depend on the features of the models to be estimated: linear, time varying, nonlinear, hybrid, nonparametric, etc.
For population dynamics in the biological framework, the mathematical models are often given in continuous time domain as Ordinary Differential Equations (ODE). The two most famous ones are the Malthus model and the Verhulst model.
Let us denote by the continuous time signal corresponding to the population density of the yeast, which is under consideration in this paper. The Malthus model expresses that
where stands for the exponential growth rate of the yeast population. Generally, is strictly positive, which means that the density increases indefinitely. Even if this kind of behavior has no biological meaning since it does not reproduce a limitation on the population density due to the biotic capacity, its main advantage comes from its simplicity as well as a good trend to reproduce the start of the growth dynamic. A more realistic model that has been considered for years for example by zoologists is the Verhulst model, given by
where an inhibition term is introduced. Its solution can be derived analytically and is known as the logistic function. It is given by the expression
where is the initial value of . This model is known to well capture the existence of a biotic capacity, expressed by the constant meaning that the population density can not go beyond this quantity that depends on the environment. Mathematically, the Verhulst model allows to capture the dominant dynamics corresponding to nonlinear phenomenon thanks to the quadratic term in the dynamical equation. Both and are positive parameters. Since we aim to estimate these two parameters, for both models, in order to make them fit as good as possible the whole available data, we need to convert these ODEs into discrete time recurrent equations, to cope with the samples that have been periodically acquired with a sampling time, denoted from now by . For this, we use the forward Euler approximation of the time derivative operator. Then, it can be shown, that the Verhulst model becomes
where is the -th sample of . It is the discrete time signal corresponding to the population density of the yeast at the discrete time such
that . The parameters and are
related to and by the following relations
Note that the recurrent equation derived from the Malthus model is the same that the one derived from the Verhulst model except that .
Ecological Engineering and Environment Protection, No 2, 2019, p. 5-13
7 In this paper, we propose to estimate the parameters of both models by assuming that each real measurement at discrete time obeys, in the case of Verhulst model, to
where stands for a random discrete time signal
with a Gaussian distribution (of zero mean and unknown variance). By considering that samples are available from the initial time to , it can be proven that an estimation in the least square sense of and , denoted by and , and based on the prediction error approach, is given by
In the case of Verhulst model, one just has to consider the expression of since does not have sense in this case. Once and have been estimated, one can easily recover an estimation of and thanks to the inverse relations of the forward Euler approximation given above. Note that the prediction error method is based on the one-step-ahead predictor of the variable , denoted by
and given by the expression
For given parameters and , the variable predictor allows to compute a prediction of this variable at the discrete time by only knowing, and using, past samples, i.e. this variable at times before included. It is important to note that this predictor does not correspond to the solution of the discrete time recurrent equation, derived from the ODE, but it gives a prediction at a sample time .
4. RESULTS
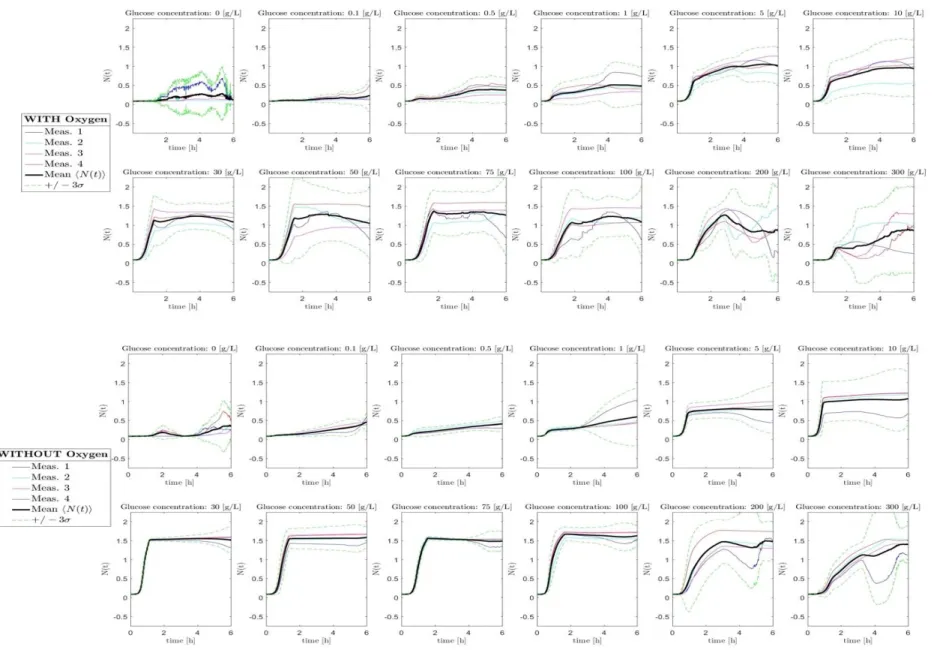
4.1. Raw data on yeast population dynamics Yeast population dynamics were carried out for 12 concentration of glucose in g/L: 0, 0.1, 0.5, 1, 5, 10, 30, 50, 75, 100, 200, 300 over a time period of 6 hours and a sampling frequency of 20 mn. Two independent setup with or without agitation were realized to study the effect of oxygen. All raw data for these 12 glucose concentrations with low or high oxygen conditions are shown in Fig. 1. The growth at 0g/L glucose concentration is due mostly to nutrient stock reserve already present within yeast cells. The great variability of nutrient
reservoir between yeast cells is reflecting to the diversity of trajectory between 4 replica. Note that as biomass contents is measured through turbidity via optical density and not by counting cells on plate, the decrease of OD after the stationary phase is less pronounced as no difference between living and death cells can be made. Difference between these two oxygen conditions for the biomass production starts to show up at 30g/L glucose where stationary mean OD stabilizes around 1 in aerobic and 1.5 in micro-aerobic condition expressed as “Without Oxygen” in Fig. 1.
4.2. Auto-regressive exponential (Malthus) model
The (Malthus) exponential growth model relates the evolution of the cell population ( )
to the
current population N(t):
For clarity N(t) is a substitute for the population density as measured by optical density.
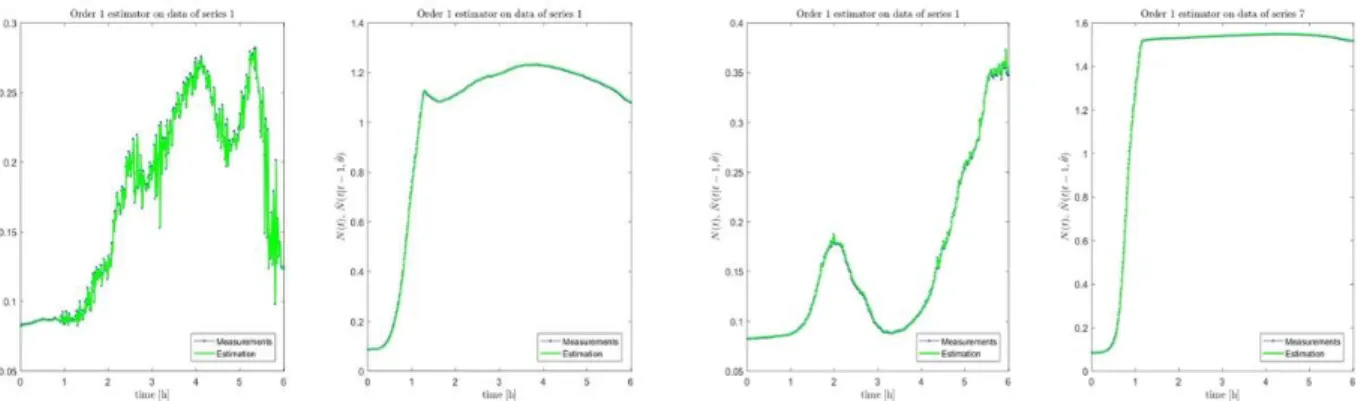
The specific growth rate is strictly changing with time as (t). In this model, we tried to estimate the average specific growth rate that minimize the prediction error over the whole trajectory. Auto-regression is made by learning data or estimating the parameter of the model on a given time window ( = 20mn) and predicting the dynamics on the next windows . Example is shown in Fig. 2 for the first two series (0 and 0.1 g/L of glucose with oxygen) for which time variation of cell population is large.
- 8 -
Fig. 1. Raw data of yeast growth in presence (A) and in weak oxygen content (B), with 4 replica for each concentration of glucose. The dark curve represents the average over 4 replica and the dash green curve represents the average with 3 standard deviations above and below average.
Ec olog ical E ng in eeri ng a nd E nv iron m en t Pr otecti on , N o 2 , 2 01 9, p .5 -13 8
Ecological Engineering and Environment Protection, No 2, 2019, p. 5-13
9
Fig. 2. Regressive curve (green) of experimental mean trajectory (black) using auto-regressive approach for the 0 g/L and 30 g/L glucose concentration in presence of oxygen (left two
panels) and without oxygen (right two panels). This overall average is estimated with relative
good precision. The error distribution of the predicted
is shown in Fig. 3 for two series (0 g/L and 30 g/L) with and without oxygen. of less than 0.02%.
Fig. 3. Relative error distribution of prediction in % for the 1st series (0 g/L) and the 7th series (30 g/L) with oxygen (two left panels) and without oxygen (two right panels).
The standards deviation of these errors distribution is significantly larger in the experiment with agitation i.e. in aerobic condition compared to the experiments in low presence oxygen (without agitation and plate covered). The error distribution is related to the variation of along the whole trajectory. The difference of distribution in the two oxygen conditions suggests that the spread of the error distribution is a bio-indicator of the presence of oxygen or of the mechanical agitation.
4.3. Auto-regressive logistic (Verhulst) model The (Verhulst) logistic growth model adds a competitive component to the exponential model which takes effect when population is large:
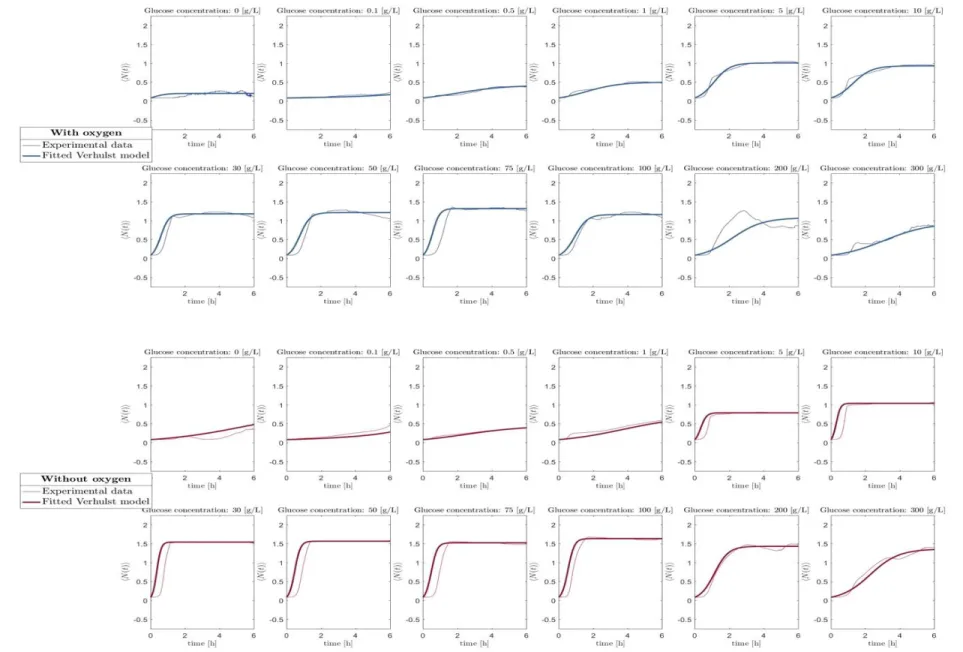
The overall prediction of the mean trajectory for each nutrient conditions (glucose and oxygen) and are presented in Fig. 4.
As a general view, the trajectories in aerobic condition display a slower evolution towards the predicted stationary phase imposed by the Verhulst model.
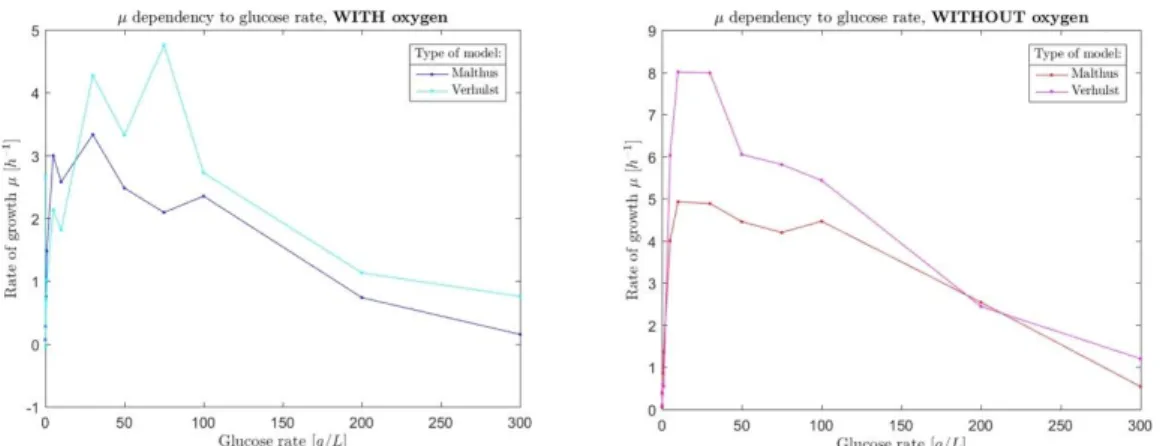
We used both exponential (Malthus) and logistic (Verhulst) model to predict the specific growth rate. The average for each condition of glucose under the two oxygen conditions are shown in Fig. 5.
10
Fig. 4. Auto-regressive Verhulst model of the experimental mean trajectory for all concentrations of glucose in presence (top panel) and in absence of oxygen (bottom panel).
Ec olog ical E ng in eeri ng a nd E nv iron m en t Pr otecti on , N o 2 , 2 01 9, p. 5-13 10
Ecological Engineering and Environment Protection, No 2, 2019, p. 5-13
11
Fig. 5. Average specific growth rate calculated with the Malthus and Verhulst models for each glucose concentration in aerobic (left panel) and anaerobic conditions (right panel). 4.4. Specific growth rate prediction
The Malthus-based (exponential model) prediction of is made using the initial part of the trajectory (from 0 to 0.85h), i.e. during the exponential phase. The Verhulst-based estimation of is made using the whole trajectory as the competitive effect has an increasing contribution
with population growth. The general tendency is the same for the Malthus and Verhulst model: a higher specific growth rate is observed in anaerobic condition compared to aerobic condition. This can be seen more clearly in Fig. 6 where the left panel is the Malthus model and the right panel corresponds to the Verhulst prediction of .
Fig. 6. Highlighting the difference of oxygen conditions for the Malthus model (left panel) and the Verhulst model (right panel).
Fig. 7. Biotic capacity K dependency to glucose initial concentrations in aerobic conditions (left panel) and in anaerobic conditions (right panel).
12 A qualitative shift of specific growth rate is observed at lower part of the glucose concentration spectrum. Similarly for the biotic capacity coefficient of the Verhulst Model (K in the expression of b).
The same tendency is observed as for the specific growth rate: a higher biomass production at the stationary phase.
5. CONCLUDING REMARKS
Mixed versus fermentative metabolism:
autoregressive predictive approach is a well-used method for predicting dynamical trajectories from missiles to cell populations. It is a ‘one-shot’ strategy in which the first k samples of the experimental trajectory are used to predict the next one. In both exponential and logistic models, the two indicators, the specific growth rate and the biotic capacity seems to highlight a larger efficiency of pure fermentative versus mixed respiro-fermentative metabolism when nutrient is in excess.
Optimum specific growth rate: capturing the
glucose dependence on specific growth rate is one approach for such optimization process. An optimum of specific growth rate is observed at a relatively large glucose concentration (in the range [30g/L – 100g/L]). This sudden decrease of specific growth rate after the optimum is likely related to the so-called sugar-induced cell death [10]. This optimum occurs at glucose concentration which is well above the Crabtree/Warburg threshold (usually in the range [0.1g/L – 1g/L]) and as such, is independent of our two oxygen conditions. This optimum specific growth rate is likely related to saturation effect of respire-fermentative pathways: saturation of respiration at low glucose concentration, and saturation of fermentation at higher glucose concentration. Note that the thresholds of glucose concentrations for the Crabtree effect or saturation of overflow metabolism (fermentation) is likely depends on the size of the nutrient reservoir (150g/L in our case), a factor not studied here but crucial for scale up studies.
Short and long time dynamics: if the calculated
mean specific growth rate is a better indicator than the biotic capacity (see Fig. 6 and 7), they both capture the same information: the glucose conditions at which overflow metabolism starts to saturate. The optimum of the specific growth rate is more pronounced with the Verhulst model (logistic model) than with the Malthus model (linear model). This suggests that the detection of early saturation effects i.e. the influence of the nutrient content on
long range population dynamics (as estimated by the biotic capacity) is better estimated using competitive effect. In the logistic model this competitivity is estimated through inhibition term corresponding to the square of population size N(t)2 at current time t. Instead, competitivity can be understood as a long term toxic influence of the milieu on the population dynamics as in the Kostitzin model which considers the entire history of the population trajectory for this milieu-induced toxicity factor [10].
Diversity and Stability: the metabolic and
genetic diversity of the yeast population is expressed more strongly in presence than in absence of oxygen and in scarcity of nutrient (e.g. 0g/L-1g/L of glucose). Without external nutrient, yeasts survive from their own reserve of lipids. The inter-connection of b-oxidation with mitochondrial respiration explains the larger amplitudes of population size in presence of oxygen compared to anaerobic conditions, at least for the early phase of the population trajectory (Fig.1.: first picture of top and bottom panels). Another indicator of such genetic and metabolic diversity (beside yeast lipid reservoir) is the lag phase before exponential growth. Short lag phase is another measure of yeast adaptability for a given nutrient conditions and fluctuations over varying nutrient conditions a criteria of adaptability and fitness as studied by Perez-Samper et al. [12].
The capacity of growth at poor diet conditions rely on an efficient metabolism (respiration) for which high ATP production yield per molecule of sugar becomes crucial. In abundance of nutrients, fluctuations around average of population size becomes less apparent as yeasts with large nutrient reservoir are likely dominating the initial phase (selective advantage). As shown in our study and suggested by others [10, 12], the Crabtree effect offers a fitness advantage in fluctuating environmental conditions.
If poor nutrient conditions promote biodiversity, an indicator of bio-stability [13], then rich diet: a source of long term toxicity for living systems?
ACKNOWLEDGMENTS
We thank Prof. Patrick Coquillard from University Nice/Sophia Antipolis for helpful discussions on cost/benefit concept within ecological systems. This work is partially financially supported by a public grant overseen by the French National Research Agency (ANR) as part of the ”Investissement d’Avenir” program, through the ”iCODE Institute project” funded by the IDEX Paris-Saclay.
Ecological Engineering and Environment Protection, No 2, 2019, p. 5-13
13 BIBLIOGRAPHY
1. Wajnberg E, Massardier-galat L, Morinay J, Guinet C, Coquillard P. Breeding success of a marine central place forager in the context of climate change : A modeling approach. PlosOne, Vol. 12(3), 2017; 1–24.
2. Hofmeyr JHS, Cornish-Bowden A. Regulating the cellular economy of supply and demand. FEBS Lett. Vol. 476, 2000, 47–51.
3. da Veiga Moreira J., Hamraz M., Abolhassani M., Schwartz L, Jolicoeur M, Peres S., Metabolic therapies inhibit tumor growth in vivo and in silico., Sci. Reports, Vol 9, 2019, 3153–3163.
4. Habegger L., Rodrigues C., Dabros M., Preventing overflow metabolism in Crabtree-positive microorganisms through on-line monitoring and control of fed-batch fermentations. Fermentation, Vol 4, 2018, 79.
5. Nilsson A, Nielsen J. Metabolic Trade-offs in yeast are caused by F1F10 ATP-synthase. Scientific Reports. Vol 6, 2016, 22264-22278.
6. Pfeiffer T., Morley A., An evolutionary perspective on the Crabtree effect. Front Mol Biosci, Vol. 1, 2014, 1–6.
7. Yizhak K, Le Dévédec SE, Rogkoti VM, Baenke F, de Boer VC, Frezza C, et al. A
computational study of the Warburg effect identifies metabolic targets inhibiting cancer migration. Mol Syst Biol. Vol. 10, 2014, 744-756.
8. Rekhi R, Qutub AA. Systems approaches for synthetic biology : a pathway toward mammalian design. Front. Physiol., Vol. 4, 2013, 285, 293.
9. Khoodeeram R, Bernot G, Trosset J. An Ockham Razor model of energy metabolism. Proc. of the Thematic Research School on, Modelling Complex Biological Systems in the Context of Genomics (eds. P. Amar, F. Képès and V. Norris), EDP Science, 2017, 85-93.
10. de Alteriis E, Cartenì F, Parascandola P, Serpa J and Mazzoleni S. Revisiting the Crabtree/Warburg effect in a dynamic perspective: a fitness advantage against sugar-induced cell death. Cell Cycle, Vol 17, 2018, 688-701.
11. Chassé J, Legay J, Pavé A. Le modèle de Volterra-Kostitzin en dynamique des populations. Ajustement et interprétation des paramètres. Ann. Zool. Ecol. Anim. Vol 9, 1977, 425-441.
12. Perez-Samper G, Cerulus B, Jariani A, Vermeersch L, Barrajón Simancas N et al. Mol. Biol. Phys. Vol 9, 2018, e01331-18.
13. Tilman D, Reich P, Knops JM. Biodiversity and ecosystem stability in a decadelong grassland experiment. Nature. Vol 441, 2006, 1476-4687. Ouerdia Arkoun, Estelle Mogensen and
Jean-Yves Trosset are with Sup’Biotech 66 rue Guy Môquet F-94800 Villejuif, France [email protected], [email protected],
[email protected] Sette Diop and Sami Tliba
are with L2S CNRS – CentraleSupélec – Université Paris-Sud - Université Paris-Saclay
3 rue Joliot Curie
91192 Gif Sur Yvette cedex, France [email protected], [email protected] Ali El Ati and Hela Friha are with IPSA
63 Boulevard de Brandebourg 94200 Ivry sur Seine, France [email protected], [email protected]
Rodrigo Ledesma-Amaro
is with Centre for Synthetic Biology and Department of Bioengineering
Imperial College London London SW7 2AZ, UK
[email protected] Islam Boussada
is with L2S and INRIA Saclay, Équipe Disco and on live from IPSA
Jawher Kahouli and Robin Lacombe are with both Sup’Biotech and IPSA [email protected],
Address for correspondence: Professor Jean-Yves Trosset Sup’Biotech
66 rue Guy Môquet F-94800 Villejuif, France