Arterial elastance and heart-arterial coupling in aortic regurgitation are
determined by aortic leak severity
1Patrick Segers PhDa, Philippe Morimont MDb, Philippe Kolh MD, PhDb, Nikos Stergiopulos PhDc, Nico Westerhof PhDd, Pascal Verdonck PhDa
a Hydraulics Laboratory, Institute Biomedical Technology, Ghent University, Gent b Hémoliège, Centre Hospitalier Universitaire, University of Liège, Liège, Belgium c
Biomedical Engineering Laboratory, EPFL, Lausanne, Lausanne, Switzerland
d Laboratory for Physiology, ICaR-VU, Vrije Universiteit Amsterdam, Amsterdam, The Netherlands.
Background In aortic valve regurgitation (AR), aortic leak severity modulates left ventricle (LV) arterial system
interaction. The aim of this study was to assess (1) how arterial elastance (Ea), calculated as the ratio of LV
end-systolic pressure and stroke volume, relates to arterial properties and leak severity and (2) the validity of Ea/Emax
(with Emax the slope of the end-systolic pressure-volume relation) as a heart-arterial coupling parameter in AR.
Methods and Results Our work is based on human data obtained from a study on vascular adaptation in chronic
AR. These data allowed us to assess the parameters of a computer model of heart-arterial interaction. In particular, total peripheral resistance (R) and aortic leak severity—expressed as leak resistance (RL,ao)—were
quantified for different patient subgroups (group I/IIa/IIb: Emax = 2.15/0.62/0.47 mm Hg/mL; Ea = 1.24/0.66/0.90
mm Hg/mL; R = 1.9/0.6/0.85 mm Hg·s/mL, RL,ao = 0.35/0.05/0.20 mm Hg·s/mL). A parameter study
demonstrated that RL,ao was the main determinant of Ea. With all other parameters constant, valve repair would
increase Ea to 2.81, 1.08, and 1.54 mm Hg/mL in groups I, IIa, and IIb, respectively. For a given Ea/Emax, LV
pump efficiency (estimated as the ratio of stroke work and LV systolic pressure-volume area) was lower than the theoretical predicted value, except for the simulations with intact aortic valve.
Conclusions In AR, Ea is determined by aortic leak severity rather than by arterial system properties. Using
Ea/Emax as a coupling parameter in general or as a mechanico-energetic regulatory parameter in particular is
questionable.
Effective arterial elastance (Ea), introduced as a measure of the arterial load on the heart,[1] is considered a
surrogate of arterial input impedance[2] and a measure of arterial stiffness.[3] It is approximated by the ratio of left ventricular (LV) end-systolic pressure and stroke volume and combines steady and pulsatile load components.[1] Ea can be combined with Emax (the slope of the LV end-systolic pressure-volume relation) to form the
heart-arterial coupling parameter Ea/Emax. The Ea/Emax parameter is extensively used in studies considering
mechanico-energetic aspects of heart-arterial coupling.[2][12] In the normal heart, the Ea/Emax ratio is within the range of 0.5
to 1, and the LV operates close to its optimal efficiency (Ea/Emax = 0.5) or stroke work (Ea/Emax = 1).[3] [10] In
heart failure, with dilated hearts, Ea/Emax becomes larger than 1.[7][8] It is therefore tempting to see Ea/Emax as a
regulated parameter that is kept at a value close to or below 1 in the normally functioning heart.
In aortic valve regurgitation, the normal heart-arterial interaction is disturbed by the leaking aortic valve. In such circumstances, the mechanical interaction between the LV and the arterial system takes place during both systole and diastole, with the severity of the aortic leak being an important modulator of cardiovascular hemodynamics. Although Ea and Emax can still be calculated from measured pressure-volume (P-V) loops,[13] the pattern of these
P-V loops is in part determined by the aortic regurgitation itself, and aortic leak severity should therefore interfere with the Ea/Emax concept.
Our study is based on human data obtained from a study on heart-arterial coupling (Ea/Emax) and vascular
adaptation in chronic aortic regurgitation. [13] Devlin et al[13] classified the patients in 3 groups on the basis of LV performance and characterized arterial function by means of Ea. We used these data to assess the parameters of a
computer model that allows simulation of heart-arterial coupling in control and aortic regurgitation conditions. As such, we (1) expanded the information contained in Ea into important clinical parameters, such as total
peripheral resistance and aortic leak resistance, uniquely quantifying aortic leak severity. Making further use of the data sets derived from the 3 patient subgroups, we (2) quantified the impact of changes in total peripheral resistance, aortic leak severity, and total arterial compliance on cardiovascular hemodynamics in general and on
1
Supported by a postdoctoral grant of the Fund for Scientific Research-Flanders, Belgium (FWO-Vlaanderen), and by a postdoctoral grant of the National Fund for Scientific Research, Belgium.
Ea in particular; and (3) assessed how far the theoretical Ea/Emax mechanico-energetic heart-arterial coupling
framework holds in aortic regurgitation.
Methods
Human data
Data were obtained from a patient study on chronic aortic regurgitation.[13] In this study, 45 patients (aged 50 ± 14 years) were classified into 3 subgroups according to LV contractility (Emax) and ejection fraction (EF). Group
I consisted of 24 patients with normal contractility (Emax ≥1 mm Hg/mL). Group IIa consisted of 10 patients with
impaired LV contractility (Emax <1 mm g/mL) but normal EF (EF ≥0.5), whereas group IIb (11 patients) had both
impaired contractility and EF (EF <0.5). Hemodynamic patient data, as reported by Devlin et al,[13] are given in Table I.
Table I. Hemodynamic data as reported by Devlin et al[13] and calculated and estimated computer model parameters for the 3 subgroups of aortic regurgitation data
Group I Group IIa Group IIb
HR (beats/min) 80 78 84 Ped (mm Hg) 19 12 22 Ps (mm Hg) 153 136 153 Pes (mm Hg) 146 134 151 Ved (mL) 202 383 514 Ves (mL) 84 179 347 EF (-) 0.59 0.55 0.34 SV (mL) 118 204 167 RI (-) 2.81 2.53 2.19 Emax (mm Hg/mL) 2.15 0.62 0.47 CO (L/min)* 3.36 6.29 6.41 Ea (mm Hg/mL)* 1.24 0.66 0.90 Ea /Emax (-)* 0.57 1.06 1.92 Emin (mm Hg/mL)* 0.102 0.029 0.045 Vd (mL)* 16 -37 26 T (s) 0.75 0.77 0.71 tEmax (S) 0.26 0.27 0.25 R (mm Hg · s/mL)‡ 1.9 0.6 0.85 C (mL/mm Hg)† 1.15 1.15 1.15 L (mm Hg · s2 /mL)† 0.005 0.005 0.005 Z0 (mm Hg · s/mL)† 0.033 0.033 0.033 RL,ao (mm Hg · s/mL)‡ 0.35 0.05 0.20
The lowest RL,ao corresponds to the most severe aortic leak. Compared to Devlin's reported Ea (1.50, 0.70 and 1.36 mm Hg/mL for group I, IIa and IIb, respectively), the values we found for Ea are somewhat lower. It is not clear why our Ea, calculated from the reported average values of SV and end-systolic pressure, differ this much from their values.
* Calculated directly from data reported by Devlin et al.[13] †Assumed fixed values.
‡Estimated values.
Cardiac output (CO; L/min) was calculated from the data as (HR/1000)·(SV/RI), with heart rate (HR, beats/min), stroke volume (SV, mL), and regurgitation index (RI) being the ratio of LV stroke volume to the forward stroke volume. Devlin et al[13] calculated RI from radionuclide LV and right ventricular counts, the latter representing the forward stroke volume. Arterial elastance was calculated as the ratio of end-systolic pressure and stroke volume.[1]
Computer model of heart-arterial interaction
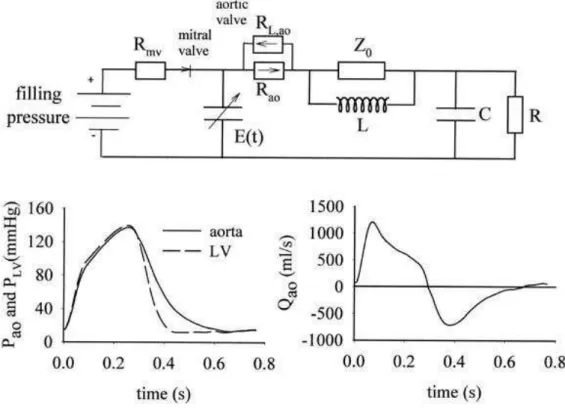
LV pressure (PLV) and volume (VLV) and aortic pressure (Pao) and flow (Qao) are computed with the use of a
heart-arterial interaction model (Figure 1).[14][15]
Fig. 1. In the heart-arterial interaction model, heart function is modeled as a time-varying elastance function, E(t). Arterial model is a lumped parameter model consisting of total arterial compliance (C), total peripheral resistance (R), aortic characteristic impedance (Z0), and the inertia of blood in the systemic arteries (L). The model directly yields LV and aortic pressures and aortic flow (Qao).
Heart function is described by a time-varying elastance model[16] [17] and is coupled to a 4-element, lumped-parameter Windkessel model representing the arterial load.[18] The systemic arterial model parameters are total peripheral resistance (R), total arterial compliance (C), total inertance (L), and aortic characteristic impedance (Z0). Time-varying elastance is calculated as E(t) = PLV/(VLV − Vd). Cardiac parameters are the slope (Emax) and
intercept (Vd) of the end-systolic pressure-volume relation, the slope of the diastolic pressure-volume relation
(Emin), and LV end-diastolic pressure (Ped), heart rate (HR), and the time to reach maximal elastance (tEmax). The
mitral valve is simulated as a frictionless, perfectly closing device. To allow for aortic regurgitation simulations, the aortic valve is modeled as a linear resistor with a low resistance value (0.005 mm Hg·s/mL) during forward flow and a value for the leak resistance (RL,ao) that will be determined for the different subgroups. When the
LV-aorta pressure difference is positive, the forward valve resistance is used in the computations, whereas RL,ao is
used when this difference becomes negative. The model is programmed in Matlab 5.3 (The Mathworks, Inc, Natick, Mass) and runs on standard PC configurations.
Estimating cardiac and arterial properties and aortic valve leakage in the 3 subgroups Cardiac parameters
Values for all heart-related parameters for the 3 subgroups, obtained or calculated from the published clinical study by Devlin et al,[13] are given in Table I. The time to reach Emax (tEmax) was estimated as 35% of the cardiac
cycle. With Emax = Pes /(Ves − Vd) and LV end-systolic pressure (Pes) and volume (Ves) given, this equation can be
solved for Vd by using appropriate values for the 3 subgroups, yielding Vd = 16, −37, and 26 mL in groups I, IIa,
and IIb, respectively. Emin is calculated from the data as Ped /(Ved − Vd), with Ved the LV end-diastolic volume. Arterial parameters and aortic valve leakage
The report by Devlin et al[13] contains no data allowing a direct calculation of the arterial parameters of the 4-element Windkessel model. Therefore, these data must be estimated in an indirect way. Fixed values are
assumed for L (0.005 mm Hg·s2 /mL) and Z0 (0.033 mm Hg·s/mL),[15] 2 parameters that have been shown to
have limited impact on pressure and flow.[14] It is further assumed that total arterial compliance does not differ between the subgroups, being 1.15 mL/mm Hg, a value that we have found in another study for age-matched hypertensive patients.[15] The impact of total arterial compliance on hemodynamics will be further assessed. Thus, at this stage, all parameters are known, except total peripheral resistance (R) and aortic valve leak resistance (RL,ao). We then performed model simulations by use of different combinations of R and RL,ao and
calculated LV systolic blood pressure (Ps,sim), cardiac output (COsim), and regurgitation index (RIsim) from the
data, with RIsim calculated as SV/(Vfwd − Vbwd), with Vfwd and Vbwd being the forward and backward flow
volumes through the aortic valve during one cycle, respectively. The (R, RL,ao) parameter combination yielding
the closest match between measured and calculated values for LV systolic pressure (Ps), CO, and RI, evaluated
as ∆ = ([Ps − Ps,sim]/LVSP)2 + ([CO − COsim]/CO)2 + ([RI − RIsim]/RI)2 , is taken as the optimal parameter set. Contribution of total peripheral resistance, aortic leak resistance, and total arterial compliance to Ea, Ea/Emax
stroke work, and LV pump efficiency
We further assessed the effect of isolated changes in total peripheral resistance or valve leak severity (as sort of sensitivity analysis) on hemodynamics and derived parameters such as Ea, stroke work, or pump efficiency. To
study, for instance, the impact of R in group I, we first performed a “reference” simulation for this subgroup (ie, using all reference model values for group I) and 2 extra simulations with new values for R, being the values that were found for groups IIa and IIb. The impact of RL,ao in group I is studied in a similar way, and these
procedures are repeated to study the impact of R and RL,ao in groups IIa and IIb.
In all 3 subgroups, additional simulations are done with all respective reference model parameters, except for total arterial compliance, which is given a value 50% lower (0.57 mL/mm Hg) or higher (1.72 mL/mm Hg) than the assumed reference value.
For all these simulations, Ea is calculated as Pes/SV, whereas heart-arterial coupling is characterized by Ea/Emax.
Stroke work (SW) is calculated as the area enclosed by the LV pressure-volume loop, and the pressure-volume area (PVA) is defined as the area enclosed by Emax, the diastolic pressure-volume curve (Emin), and the systolic
portion of the pressure-volume loop. The ratio of SW/PVA is then calculated as a surrogate of LV pump efficiency.[5][6]
Results
Estimating cardiac and arterial properties and aortic valve leakage in the 3 subgroups
An overview of directly derived and estimated cardiac and arterial model parameters is given in Table I. The effect of R and RL,ao on LV systolic pressure, cardiac output, and regurgitation index for the data of subgroup IIb
is shown in Figure 2.
Fig. 2. To assess the values for total peripheral resistance (R) and aortic valve leak resistance (RL,ao), the R-RL,ao parameter space is scanned and the combination of R and RL,ao yielding the best agreement between measured and predicted LV systolic pressure (A), regurgitation index (B), and cardiac output (C) is taken as the optimal parameter set. For patient group IIb, the best solution (indicated by arrows) is obtained for R = 0.85 and RL,ao = 0.2 mm Hg·s/mL.
For a given aortic leak resistance, an increase in total peripheral resistance yields a higher systolic pressure, higher regurgitation index, and lower cardiac output. For a given R, an increase in RL,ao, that is, a less severe
leak, yields higher Ps, lower RI, and higher CO. For subgroup IIb, optimal parameters that fit the measured data
are R = 0.85 mm Hg·s/mL and RL,ao = 0.2 mm Hg·s/mL, giving ∆ = 0.001. For subgroups I and IIa, ∆ is 0.016
and 0.00007, respectively. Values for all model parameters are given in Table I; comparison between measured (reported by Devlin et al[13]) and simulated systolic pressure, cardiac output, and regurgitation data is given in Figure 3.
Fig. 3. Comparison between measured and predicted LV systolic pressure (A), regurgitation index (B), and cardiac output (C) for the 3 patient subgroups. See Tables I and II for model parameter values.
Hemodynamic impact of R, C, and aortic valve leakage
Data showing the impact of isolated changes in total peripheral resistance, total arterial compliance, and valve leak resistance are given in Figure 4 and in Table II.
Table II. Overview of simulations using the computer model
Group R RL,ao C CO SV RI SBP DBP MAP
I 1.9 0.35 1.15 3.7 140.9 2.94 160.5 63.3 116.5 I 0.6 0.35 1.15 7.7 140.6 1.47 112.8 32.8 75.7 I 0.85 0.35 1.15 6.2 137.8 1.77 126.7 42.3 88.1 I 1.9 0.05 1.15 2.0 133.7 5.58 114.3 20.9 62.6 I 1.9 0.20 1.15 3.0 148.4 3.89 145.9 41.6 96.9 I 1.9 0.35 0.57 3.4 107.8 2.45 181.9 33.6 105.7 I 1.9 0.35 1.72 3.9 157.4 3.14 152.8 82.4 123.3 I 1.9 - 1.15 6.5 80.9 1.00 228.5 178.0 205.3 IIa 0.6 0.05 1.15 6.3 200.2 2.53 137.1 12.9 61.8 IIa 0.85 0.05 1.15 4.6 193.3 3.33 141.2 13.3 63.8 IIa 1.9 0.05 1.15 2.1 182.9 7.04 146.4 13.6 66.7 IIa 0.6 0.20 1.15 8.1 195.6 1.88 146.3 24.4 81.0 IIa 0.6 0.35 1.15 9.2 188.2 1.59 151.4 36.7 91.4 IIa 0.6 0.05 0.57 6.7 146.6 1.71 170.0 11.7 66.7 IIa 0.6 0.05 1.72 6.1 239.3 3.14 117.6 15.4 59.8 IIa 0.6 - 1.15 12.2 154.6 1.00 166.2 78.3 121.5
Group R RL,ao C CO SV RI SBP DBP MAP IIb 0.85 0.20 1.15 6.6 176.2 2.26 156.2 39.3 93.0 IIb 0.6 0.20 1.15 8.6 183.8 1.79 148.8 33.8 85.9 IIb 1.9 0.20 1.15 3.3 165.2 4.13 168.5 49.0 104.7 IIb 0.85 0.05 1.15 5.0 183.8 3.12 144.3 23.4 69.9 IIb 0.85 0.35 1.15 7.4 162.8 1.85 160.5 54.2 104.2 IIb 0.85 0.20 0.57 5.9 123.7 1.77 172.2 23.8 83.3 IIb 0.85 0.20 1.72 7.2 211.2 2.45 151.9 56.6 101.4 IIb 0.85 - 1.15 9.9 116.0 1.00 176.2 103.9 138.0
SBP, Systolic arterial pressure; DBP, diastolic arterial pressure; MAP, mean arterial pressure.
Fig. 4. A through C, Effect of isolated changes in total peripheral resistance (R) on simulated pressure-volume loops in the 3 subgroups. The 3 simulations for group I (A), for instance, are obtained using (1) all reference model parameters for group I (as given in Table I) and (2) the same parameters except for R that is given the values of groups IIa and IIb, respectively. Similarly, D through F show the impact of the severity of the aortic leak for all subgroups. G through I illustrate the effect of a change in total arterial compliance on the pressure-volume loops.
For all groups, an increase in resistance leads to higher systolic pressures and a rightward shift of the P-V loops, but the effect is most outspoken for group I, that is, the subgroup with the less severe aortic leak (Figure 4, A-C). Increasing resistance lowers cardiac output and increases regurgitation index (Table II).
An increase in total arterial compliance (Figure 4, D-F) yields lower LV systolic pressure and a rightward shift of the P-V loop with a large increase in stroke volume. Effects are most outspoken for subgroup IIa, that is, the subgroup with the most severe aortic leak. A higher compliance leads to higher mean arterial pressures in groups I and IIb (and thus higher cardiac output) but not in group IIa. RI increases in all groups (Table II).
The more severe the aortic leak is (ie, the lower its resistance RL,ao), the lower are systolic pressure (Figure 4, G-I) and end-systolic volume. Obviously, more severe leaks yield higher RI and lower cardiac output (Table IG-I).
Figure 4 (D-F) and Table II also contain no-leak simulations, which are hypothetical post-valve repair data, assuming that all cardiac and arterial properties remain constant, whereas RL,ao approximates infinity (no leak).
In groups IIa and IIb, valve repair would lead to high cardiac output (≥10 L/min) with only modest increases in systolic blood pressure. In contrast, cardiac output would be normalized in group I (6.5 L/min), with a high increase in systolic pressure.
Contribution of R, C, and aortic valve leakage to arterial elastance
An increase in R, a decrease in C, and less severe aortic leaks (higher RL,ao) lead to higher Ea (Figure 5).
Comparing the reference simulations for the 3 groups with the hypothetical no-leak simulations, it follows from Figure 5 that repairing the aortic valve would instantly increase Ea from 1.14 to 2.81, from 0.69 to 1.08, and from 0.90 to 1.54 mm Hg/mL in groups I, IIa, and IIb, respectively.
Fig. 5. Contribution of total peripheral resistance (R), total arterial compliance (C), and leak severity to arterial elastance in conditions of aortic regurgitation and for identical cardiac and arterial conditions but with an intact aortic valve (closed symbols).
Mechanico-energetics and Ea/Emax
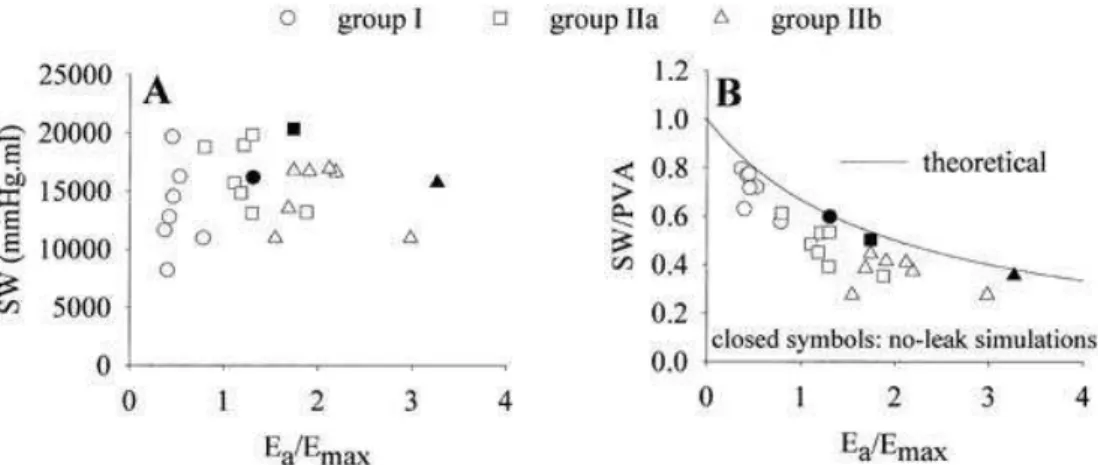
The relations between Ea /Emax and stroke work and between Ea/Emax and SW/PVA are depicted in Figure 6.
Within each subgroup, there is no obvious relation between SW and Ea/Emax. Concerning SW/PVA, all data
points are below the theoretical relation between pump efficiency and Ea/Emax, that is, SW/PVA = 1/(1 + 0.5
Ea/Emax), except for the hypothetical no-leak simulations for which the results adhere to this relation.
Fig. 6. Relation between Ea /Emax and LV stroke work (A) and between Ea/Emax and SW/PVA (B), a surrogate measure of LV pump efficiency for the 3 patient subgroups. B also shows the theoretical relation between Ea/Emax and SW/PVA. It is observed that the no-leak simulations are the only data points adhering to this theoretical relation.
Discussion
In this study, we explored hemodynamic data obtained from patients with chronic aortic regurgitation by means of a (relatively) simple computer model describing heart-arterial interaction. The 3 patient subgroups as defined by Devlin et al[13] on the basis of LV performance criteria show distinct values for total peripheral resistance and aortic leak severity. Ea is highest in group I (Emax ≥1 mm Hg/mL) due to the high total peripheral resistance (1.9
mm Hg·s/mL) and the less severe aortic leak (RL,ao = 0.35 mm Hg·s/mL). Group IIa (Emax <1 mm Hg/mL, EF ≥0.5) has the lowest Ea because of low R (0.6 mm Hg·s/mL) and a severe aortic leak (RL,ao = 0.05 mm Hg·s/mL).
Group IIb, which has the poorest LV performance (Emax < 1 mm Hg/mL, EF < 0.5) has intermediate values for
Ea (R = 0.85 and RL,ao = 0.2 mm Hg·s/mL).
Because direct data necessary to calculate arterial parameters or aortic leak resistances are lacking, such as time course of LV and aortic pressures and aortic flow, R and RL,ao had to be estimated in an indirect way, thereby
making use of a heart-arterial interaction model. All cardiac parameters used are obtained from Devlin et al[13] and are directly implemented in our model. Concerning the arterial model parameters, we assumed constant reference values for Z0 and L, parameters that have a negligible impact on blood pressure and cardiac output in
their physiological range,[14][19] as well as a constant compliance. We have done a coarse scan of the R-RL,ao
parameter space for the solution that yields the closest match between measured and predicted cardiac output, systolic pressure, and regurgitation index. This procedure yields distinct R-RL,ao combinations for the 3
subgroups, with the best results obtained in subgroup IIa (Figure 3). Possibly, other R-RL,ao combinations in the
vicinity of our solution may further improve the fitting results, but parameter values will not differ by >0.05 mm Hg·s/mL for R or RL,ao.
We have assumed identical total arterial compliance in the 3 subgroups (1.15 mL/mm Hg), with the value obtained from a study on hypertensive patients with the same age range as the patients in this study.[15] Another choice for the value of total arterial compliance would lead to different R-RL,ao solutions in the 3 subgroups. To
assess the impact of this assumption, extra simulations are done with all parameters kept constant, except that C is increased and decreased by 50%. On average, a 50% lower compliance decreases cardiac output by 4% and RI by 23%, but increases systolic pressure by 16%. The 50% increase in compliance leads to 4% increase in CO, 13% increase in RI, and 7% decrease in systolic pressure. Therefore, another choice of C within the physiological range would only minimally affect the obtained results and still maintain the clear discrepancy between the different subgroups.
The effect of arterial parameters (R and C) on arterial elastance is illustrated in Figure 5. It has been shown earlier that—assuming that mean arterial pressure approximates LV end-systolic pressure—Ea can be
approximated as R/T, with T the duration of the cardiac cycle.[6] In aortic regurgitation, this assumption is clearly violated, as apparent from Figure 5: increasing R only moderately increases Ea . The higher the valve leakage is
(group IIa), the lesser the effect of an increase in total peripheral resistance. To better illustrate this effect, we performed some extra simulations with a nonleaking aortic valve while also changing R (and C) over the same range as with the leaking valves (Table II). These data are represented by the filled symbols in Figure 5, where it can be seen that the relation is linear, as expected. Concerning total arterial compliance, the opposite is true. Whereas the contribution of total arterial compliance to Ea is only marginal, its effect is somewhat stronger in
aortic regurgitation, with higher compliances leading to lower Ea.
Having observed the relative insensitivity of Ea to R in aortic regurgitation, it is difficult to see Ea as an “active”
regulatory arterial property. Total arterial compliance is mainly a passive property of the large elastic arteries, and the major determinant of Ea, that is, aortic leak severity, is a given noncontrollable “property.” Thus, if
Ea/Emax is indeed a regulatory parameter, it can only be controlled through changes in cardiac contractility and
heart rate in aortic regurgitation.
In a theoretical study, it has been shown that for a given preload (Ved) and inotropic state (Emax and Vd) of the
LV, stroke work is determined by Ea/Emax and maximal when Ea/Emax = 1.[6] This relation was derived under the
assumption that SW can be approximated by the product of SV and end-systolic pressure, which, obviously, is an assumption violated in case of aortic regurgitation. The relation between SW and Ea/Emax for the aortic
regurgitation simulations is given in Figure 6, and it can be seen that there is no straightforward relation between Ea/Emax and SW, not even after normalization of the data, and SW is not maximal for Ea/Emax = 1. Note that
“violation” of the predicted theoretical relation between Ea/Emax and SW was also observed in experimental
studies with intact aortic valves. De Tombe et al[20] reported that Ea/Emax corresponding to maximal SW is <1,
whereas SW remains close to its maximum (>90% of optimal value) for a wide range of Ea/Emax ratios (0.3 to
1.3).
The efficiency of the heart as a pump is quantified by the ratio of total heart oxygen consumption and stroke work. It has been demonstrated that ventricular systolic pressure-volume area, PVA, is strongly correlated to myocardial oxygen consumption. [21] As such, SW/PVA is a surrogate index of cardiac pump efficiency that can
be calculated from the pressure-volume loop. Moreover, there is a theoretical relation between SW/PVA and Ea/Emax , given by SW/PVA = 1/(1 + 0.5 Ea /Emax).[6] In aortic regurgitation, however, this theoretical Ea/Emax
heart-arterial coupling framework does not hold, as illustrated in Figure 6, where the relation between SW/PVA and Ea/Emax for the simulated data is shown. The only data points adhering to the theoretical relation are the
simulations with the intact aortic valve. For all other cases, pump efficiency is lower than the theoretically predicted value based on Ea/Emax.
The use of effective arterial elastance and of Ea/Emax has been promoted by theoretical and experimental studies
linking Ea/Emax to LV mechanico-energetics.[3][4][6][10][12] Note, however, that Ea/Emax is mainly a “geometrical”
parameter related to ventricular volume. With Ea = Pes/SV and Emax = Pes/(Ved − SV − Vd) and assuming Vd small
enough so that it can be neglected, Ea/Emax = Ved/SV − 1 = 1/EF − 1.
For ejection fractions of 0.5 to 0.7, Ea/Emax is 1 to 0.42. In failing, dilated hearts, the EF decreases (mainly
because of the increase in Ved) and Ea/Emax thus increases. The validity of the relation between Ea/Emax and EF in
aortic regurgitation is confirmed by regression analysis on all simulated cases of Table II, which yields a regression equation 1/EF − 1 = 1.02 Ea/Emax − 0.02; r2 = 0.96.
The reason LV ejection fraction is around 0.5 (Ea/Emax = 1) in the normal heart can be argued on
mechanical-energetic grounds, but it has also been shown that this value is explicable on the basis of evolutionary arguments.[22] Also, the human body has no sensors or receptors being sensitive to stroke work or mechanical efficiency. It is therefore unlikely that there are control mechanisms maintaining constant Ea/Emax to operate at
optimal power or optimal efficiency. It seems more plausible that cardiovascular control mechanisms are based on (coronary perfusion) pressure, wall stress (or strain), or flow.
It should be emphasized that this is a mathematical model study with some inherent limitations. The heart and the arterial tree are simulated with linear models, thus neglecting nonlinear properties. However, it has been shown earlier that the combination of such linear models yields accurate predictions of cardiovascular hemodynamics. [14] [19][23] In addition, the aortic valve is simulated as a simple linear resistor. Incorporating a more complex nonlinear aortic valve model may generate patterns of aortic forward and regurgitant flow better matching in vivo observations, but we do not have the data necessary to derive better constitutive laws for the aortic valve. Also, total arterial compliance is given a constant value. With the large alterations of arterial pressure in aortic regurgitation, a nonlinear pressure-dependent compliance model would be a more accurate representation of the arterial system. It should, however, be stressed that the aim of this work is to illustrate the limitations of the conceptual Ea/Emax heart-arterial coupling framework in aortic regurgitation and not to
fine-tune the computer model for a perfect simulation of the human data, which is impossible with the data provided by the work of Devlin et al. To our knowledge, such data, which would consist of simultaneously measured LV pressure and volume and aortic pressure and flow, are currently not available.
There is a growing clinical interest in vascular properties in general and arterial stiffness in particular. Ea, being
termed arterial elastance and having stiffness units, appears to be an attractive parameter to characterize the arterial system,[1] [3][13] [24] especially in studies relating cardiac and arterial function (heart-arterial coupling). However, Ea is hardly related to arterial elasticity, and instead of an arterial parameter, it is a heart-arterial
coupling parameter in itself. In fact, the main determinants of Ea are total peripheral resistance and cardiac
frequency[5][6] and not arterial stiffness. Ea cannot be used as a substitute of arterial impedance,[5] which becomes
most obvious in aortic regurgitation where aortic leak severity is an important determinant of Ea.[25]
In particular in aortic regurgitation, the arterial system should be quantified by specific system properties (total peripheral resistance, total arterial compliance, valve leakage resistance) rather than by a global parameter such as Ea. The combined use of clinical data and computer models can help the clinician in this process of identifying
and quantifying the true mechanical properties of both the arterial system and the aortic leak, as illustrated in this study. Furthermore, these computer models allow to predict the impact of, for instance, vasodilator/vasoconstrictive drugs or valve repair on hemodynamics and cardiac load.
Though not numerous, there are several studies reporting Ea in aortic regurgitation.[13] [25][26] It is nevertheless
important to heighten the awareness of cardiovascular practitioners and researchers for the correct use of Ea, in
particular in aortic regurgitation. We have shown that aortic leak is an important modulator of Ea and that the
assumptions leading to the conceptual heart-arterial coupling framework linking Ea/Emax to mechanico-energetic
parameters are violated. As such, the use of Ea as an arterial function parameter and of Ea/Emax as a coupling
parameter in general or as a mechanico-energetic regulatory parameter in particular is questionable in these conditions.
References
1. Kelly R, Ting C, Yang T, et al. Effective arterial elastance as index of arterial vascular load in humans. Circulation 1992;86:513-21. 2. Saba PS, Ganau A, Devereux RB, et al. Impact of arterial elastance as a measure of vascular load on left ventricular geometry in hypertension. J Hypertens 1999;17:1007-15.
3. Chen C-H, Nakayama M, Nevo E, et al. Coupled systolic-ventricular and vascular stiffening with age: implications for pressure regulation and cardiac reserve in the elderly. J Am Coll Cardiol 1998;32:1221-7.
4. Sunagawa K, Maughan WL, Sagawa K. Optimal arterial resistance for the maximal stroke work studied in isolate canine left ventricle. Circ Res 1985;56:586-95.
5. Sunagawa K, Maughan WL, Burkhoff D, et al. Left ventricular interaction with arterial load studied in isolated canine ventricle. Am J Physiol 1983;245:H773-80.
6. Burkhoff D, Sagawa K. Ventricular efficiency predicted by an analytical model. Am J Physiol 1986;250:R1021-7.
7. Ishihara H, Yokota M, Sobue T, et al. Relation between ventriculoarterial coupling and myocardial energetics in patients with idiopathic dilated cardiomyopathy. J Am Coll Cardiol 1994;23:406-16.
8. Sasayama S, Asanoi H. Coupling between the heart and arterial system in heart failure. Am J Med 1991;90:14-8S. 9. Starling MR. Left ventricular-arterial coupling relations in the normal human heart. Am Heart J 1993;125:1659-66.
10. Asanoi H, Sasayama S, Kameyama T. Ventriculoarterial coupling in normal and failing heart in humans. Circ Res 1989;65:483-93. 11. Nitenberg A, Antony I, Loiseau A. Left ventricular contractile performance, ventriculoarterial coupling, and left ventricular efficiency in hypertensive patients with left ventricular hypertrophy. Am J Hypertens 1998;11:1188-98.
12. Arnoult F, Loiseau A, Aptecar E, et al. Ventriculoarterial coupling and left ventricular efficiency in heart transplant recipients. Transplantation 1997;64:617-26.
13. Devlin WH, Petrusha J, Briesmiester K, et al. Impact of vascular adaptation to chronic aortic regurgitation on left ventricular performance. Circulation 1999;99:1027-33.
14. Stergiopulos N, Meister JJ, Westerhof N. Determinants of stroke volume and systolic and diastolic pressure. Am J Physiol 1996;270:H2050-9.
15. Segers P, Stergiopulos N, Westerhof N. Quantifying the contribution of cardiac and arterial remodeling to hypertension. Hypertension 2000;36:760-5.
16. Suga H, Sagawa K, Shoukas AA. Load independence of the instantaneous pressure-volume ratio of the canine left ventricle and effects of epinephrine and heart rate on the ratio. Circ Res 1973;32:314-22.
17. Suga H, Sagawa K. Instantaneous pressure-volume relationships and their ratio in the excised, supported canine left ventricle. Circ Res 1974;35:117-26.
18. Stergiopulos N, Westerhof B, Westerhof N. Total arterial inertance as the fourth element of the windkessel model. Am J Physiol 1999;276:H81-8.
19. Segers P, Steendijk P, Stergiopulos N, et al. Predicting systolic and diastolic aortic pressure and stroke volume in the intact sheep. J Biomech 2001;34:41-50.
20. De Tombe PP, Jones S, Burkhoff D, et al. Ventricular stroke work and efficiency both remain nearly optimal despite altered vascular loading. Am J Physiol 1993;264:H1817-24.
21. Suga H, Hayashi T, Sirahata M. Ventricular systolic pressure volume area as predictor of cardiac oxygen consumption. Am J Physiol 1981;240:H39-44.
22. Elzinga G, Westerhof N. Matching between ventricle and arterial load: an evolutionary process. Circ Res 1991;68:1495-500. 23. Latson TW, Hunter WC, Burkhoff D, et al. Time sequential prediction of ventricular-vascular interactions. Am J Physiol 1986;251:H1341-53.
24. Saba PS, Roman MJ, Ganau A, et al. Relationship of effective arterial elastance to demographic and arterial characteristics in normotensive and hypertensive adults. J Hypertens 1995;13:971-7.
25. Razzolini R, Ramondo A, Isabella G, et al. Analytical expression of effective afterload in aortic and mitral regurgitation. Jpn Heart J 1999;40:295-309.
26. Haessler R, Madler C, Klasing S, et al. Propofol/fentanyl versus etomidate/fentanyl for the induction of anesthesia in patients with aortic insufficiency and coronary artery disease. J Cardiothorac Vasc Anesth 1992;6:173-80.
![Table I. Hemodynamic data as reported by Devlin et al [13] and calculated and estimated computer model parameters for the 3 subgroups of aortic regurgitation data](https://thumb-eu.123doks.com/thumbv2/123doknet/5827073.140942/2.892.108.790.382.894/hemodynamic-reported-calculated-estimated-computer-parameters-subgroups-regurgitation.webp)