Array of Microsystems for Live Monitoring
of High Voltage Power Lines
L.Renson, Cl.Jamar, S.Guerard, J.L.Lilien, J.Destine
Abstract
Recent research, development and testing on a high voltage power lines health monitoring microsystems array highlight significant results on the determination of the status of the monitored power lines. The system has been designed to give access to real time data, allowing then to determine possible malfunctions of a high voltage power line network section.
Specific algorithms have been developed to extract the state of the monitored line from the stream of raw data. A radio connection to the ground station has been adapted to the application, for instance by designing an antenna shape that withstands “corona effect” and indirect lightning, and the data transfer to ground has been made compatible with the latest techniques of remote access including Internet via cable or wireless protocol. A dedicated autonomous power supply has been developed to be able to continuously store, process, receive and transmit informations from and to the base station.
The Ampere Capacity (Ampacity) determination is a key factor for all countries, especially for the high voltage lines (150 kV and over, up to 735 kV). The market liberalization seen in Europe and USA force the providers to have real time information on the trunk lines of their power networks. The trend is now to protect the network against the most credible contingencies in a preventive way. Knowing the network status, dependable and secure corrective actions may then take place to deal with the more severe disturbancies.
In a deregulated market environment, this preventive control could be felt as a brake upon business, just to maintain security margins against hypothetical events. Moreover power systems in european regions as well as north american ones will be operated closer to their limits, since there are increasing difficulties to build new infrastructures while, at the same time, the demand in power keeps growing in most countries.
Under the above described stressed conditions, thermal overloads are pointed out as major threats to system operation. Knowing these overloads occur when currents exceed the thermal capacities of the line (these last are in direct connection with conductor's sag/temperature), the isolation of these line sections, by dedicated protective devices or operators, weakens the system, with the associated risk of cascade trippings.
Still as a prototype, the system under development has proven to be very effective in determining the mechanical/thermal properties of the line. The results obtained from a first test campaign started in June 2004 are presented, compared and discussed with results from other calibrated methods. Finally, as a conclusion, the validity of the approach is demonstrated.
_______________________________________________________________________________ L.Renson, Cl.Jamar: Centre Spatial de Liège Avenue du Pré-Aily, B-4031 Angleur, Belgium
phone : +32 4-3676668 fax : +32 4-3675613 email : [email protected] S.Guerard, J.L.Lilien, J.Destine: University of Liège Inst.Montefiore B28
1 Introduction
All electrical power transmission lines are governed by electric safety codes, like NESC in the USA, RGIE in Belgium or CSA in Canada. All these codes include deterministic, voltage-specific limits on clearances. Individual existing lines have widely different “templating” temperatures, some as low as 50°C or as high as 150°C, depending of the power network caracteristics. So the way to calculate line ratings is usually based on coincident high ambiant temperature, full solar radiation and effective wind speed of 0.6 m/s.
As a consequence, the allowable load is generally well over these design conditions so that large safety margins are available to increase the thermal load, but this is very much dependent on real time conditions (usually unknown). In order to increase the transmitted power along the line, several systems and methods have been developped to get information on the power network status. Various methods of line ampacity (ampere capacity) control are known, ranging from a conservative approach as described to more liberal line sag models and clearance warning methods. In the later methods, utility suppliers are adapting line ratings to actual monitored weather conditions, for example, thus operating and controlling power lines more dynamically. Another method uses the temperature-sag model. A line tension monitoring system comprising tension monitors for at least some of the ruling spans of the line, is used on the line to determine from tension measurements the sag and rate of sag change. Other methods use optical sag monitors, line temperature or thermal rate monitors. Unfortunately the installation and maintenance of these systems is most of the time difficult, time consuming and expensive.
In addition to this operational thermal aspect, power lines are subject to mechanical constraints, whose effects are also generally unknown over long period of time (fatigue, corrosion, ageing,…). As a consequence, the maintenance efforts and work given to maintain the appropriate optimal power delivery and network safety are still problematic and, as a result, quite expensive.
Figure 1: August 2003 black-out in the USA
Figure 2: overhead power transmission line strands break
Remember, as an example of thermal related problem, the August 2003 black-out in the USA, initiated by an increased conductor sag due to overheat (figure 1). On the other side, lines must be repaired or changed when showing evidence of mechanical problem (conductor strands break, for example, figure 2).
Knowing the situation as briefly explained, it appears that the need for a real time health monitoring system is evident and that it would considerably help operators to manage and maintain power networks.
2 Measurement Needs and System Definition
2.1 Needs and Objectives
Overhead power transmission lines are subject to electrical, thermal and mechanical constraints, which suggest the following investigations:
• ampacity measure, electrical/thermal transient phenomena and vibration phenomena, and then corresponding measurements:
• current or power flow,
• ambiant and conductor temperature,
• weather conditions (wind speed, solar radiation,…rain, snow), • low and high frequency 3D conductor movement.
From these measurements, computations are made using finite element models of the line to determine conductor tension, sag and corresponding clearance values. The real time status of the line is known and conclusions are given about the corresponding maximum allowable delivery power, as well as inspection, repair or maintenance needs to be planned.
2.2 Environmental Conditions
The environmental conditions are those of the countries where the network goes through. Some aspects should be remembered:
• conductor temperature is based on line thermal template design.
• thermal peaks occur when currents exceed the thermal capacities of the line.
• humid, saline, corrosive atmosphere; snow/ice loading generate a 10 to 20kg/m load. • lightning environmental conditions (reduced probability of direct stroke).
2.3 Electrical Phenomena
Ampacity is a key factor for service life of overhead line conductors. More or less all utilities
dealing with electrical lines have to solve that problem nowadays much more closely to real time evaluation than before (market liberalization, impossibilities to build new lines, increasing loads in the lines, etc…). It can be evaluated easily if conductor temperature is known (or even better if sag is known) at the dispatching level. Correlation with wind speed, ambiant temperature and solar radiation would be a marvelous information.
The ambiant air and the cable temperatures are continuously recorded, the sampling rate has to be set to at least one measurement every 15 minutes:
• extreme ambiant values may be measured in the vicinity of the line (at the closest base station for example) or are obtained from other database.
• conductor temperature usually ranges from -5 to 75°C (with exception including very cold temperature, -45°C, like in Siberia, up to very high temperature conductors, 200°C). The precision needed depends on the temperature/sag sensitivity which is dependant of the span length, conductor properties and sagging conditions, but roughly 1°C precision is enough. The conductor temperature is not constant over the whole conductor section and surface temperature is very much influenced by sun radiation, wind speed and possible ice or snow coating. These effects can vary from one place to another, so that several locations are needed to evaluate
appropriate value. It is reasonable to compare the measured value with a computed one based on current flow, wind, ice, ambiant temperature, solar radiation and cable emissivity.
The line current may be measured by the microsystem recorder installed on the line or directly obtained from the utility provider.
2.4 Vibration Phenomena
Overhead power transmission lines are subject to wind induced conductor motion in the form of aeolian vibration, wake induced oscillation and conductor galloping. These motions may cause extensive damage to components of the conductor support system or to the conductor itself, depending of wind conditions.
Break of strands in overhead conductors and fatigue failure of other line components such as armor rods, dampers and insulators, are the most common forms of damage resulting from aeolian vibrations. Aeolian vibrations may occur on all types of overhead transmission lines. The vibration is induced to the line at light and steady winds (1 to 7 m/s) due to alternating shedding of wind-induced vortices on the top and bottom sides of the conductor. The action creates an alternating pressure unbalance inducing the conductor to move up and down at right angles to the direction of airflow. The peak to peak amplitude is usually in the range of 0.01 to 1 times the conductor diameter. This phenomenon is permanently discussed in international groups because the complexity of the vibration is such that no method used nowadays can predict efficiently the vibration level (protection device system is overestimated or underestimated: many damper devices fall on the ground, sometimes with no clear explanations).
Wake induced oscillations are limited to lines with bundled conductors (steady wind velocity between 4 and 18m/s). The amplitude of the oscillations can be from 0.5 to 80 times the conductor diameter and can lead to conductor clashing.
Conductor gallop can occur in single or bundle conductors with asymmetrical ice load at high and steady wind velocities between 7 and 18m/s. Galloping appears very seldom, but is very serious because it may lead to failure in only a few hours. The peak amplitude can be from about 5 to 300 times the conductor diameter. The proper selection of ratio of vertical natural frequency to torsional frequency, sag ratio and support conditions are basic measures to reduce the effect from conductor galloping. There is no existing device able to measure in real time the galloping amplitude, except remote camera systems which are extremely expensive and difficult to manage.
These last subjects have been deeply studied by Montefiore Institute for the last 15 years. All these studies have solved the problem of physical understanding of the phenomena, evaluation of the appropriate analytical or numerical tools to study them and even one anti-galloping device has been developed.
2.5 Health Monitoring and Power Flow Determination
Using these recorded data, models and databases about the line health management (ageing, fatigue, mechanical/thermal status, maintenance) will be updated accordingly.
For the network operational aspects, the sag value and its sensitivity to other parameters are of prime importance for ground clearance computation and then ampacity prediction. New kind of
conductors (high temperature) have different behaviour compared to classical one, as they are partially using negative heating coefficient or multi-metallic cable with different temperature behaviour, so that over a certain value, the sag-tension relationship is changing its behaviour. The sag value is no more easily predictable. Based on temperature data and others, it is obviously complicated by multi-spans arrangement, which represent more than 80% of the network.
The sag sensitivity to conductor current flow variations is very important to know, in order to fix long term possible ampacity and also short term possibility (depending on the time constant related to the heating of the conductor due to a higher power flow).
The use of such an expertise in the field, including what to measure it, where to measure and how to process the data, is for sure an add in the way to develop, install and operate a power line health monitoring system in the form of a microsystems array.
3 Microsystems Network Specifications
3.1 Specifications
Is is obvious that the wireless technology would give the whole system its ease of use, just with microsensor systems beeing nodes and base stations relays to the central management office. The networking functionnality of the microsensor systems will be advantageously used to perform correlations between data from several nodes. As the cost of each node is expected to be low, the redundancy function is straightforward, enhancing then the expected reliability of the overall system. The target health monitoring product is made of the following components:
• the microsensors recorder placed on the overhead power transmission line, • fixed measurements units/repeaters placed on ground or on towers,
• a remote access gateway allowing two-way communication from anywhere in the world via Internet and the other wireless technologies,
• dedicated user software for analysing data and monitoring the transmission line, • appropriate technical software for configuring, troubleshooting and managing the
microsystems network, and has the following caracteristics:
• measure: temperature, current in the phase wire, wind speed and turbulence level, solar radiation, radius of cable curvature,
• microsensors node: include data pre-processing, autonomous in power, survive high electric and magnetic fields, maintenance free, low weight, low price,
• data transmission: antenna withstanding corona effect, remote via cable or wireless internet, • base station: run data processing, output cable parameters, report on cable exploitation and
maintenance,
The microsensors recorder is an autonomous device permanently installed on the live line. It is so small that it does not significantly change the apparent geometry of the conductor or add significant local mass. Its weight is small enough (<500gr) so that it does not disturb the vibration phenomena and may be installed in any places in-span.
Knowing by pre-analysis acting modes and mode shape of the span, as well as modal amplitude, the data coming out from the recorder help to rebuild all span movement in 3-D. The method is
based on Fourier analysis on each signal along the span to detect the actual modes in vertical and horizontal movements (frequency peaks help to get a very good approximation of the real time tension in the line, especially with low movements in ambiant conditions).
Mainly the two movements perpendicular to the cable in orthogonal position are needed, as well as inclination of the axes in two angles, to be able to reproduce any cable movement in a vertical plane at the location of the measurement. In fact longitudinal movements of the cable are very limited and these measurements are mainly observed to evaluate clearances with all other structures in the vicinity (trees, …).
Distances between two substations may be tenth up to extreme hundreds of kilometers in remote areas. Depending on location (very remote or not), some intermediate base stations may be helpful to transfer the information. So that the chain would be: conductor to tower, tower to other tower to reach the closest substation where Internet or other transmission media is accessible. The maximum network nodes talking to the base station depends on the frequency of data transmission (network topology is hybrid star-mesh).
3.2 Prototype Features
The microsensors system includes the following components:
• two 2-axis microaccelerometers
±
2g, ADXL202 (5mg resolution @60Hz bandwidth) [1], • temperature sensor,• low-voltage low-power microcontroller XEMICS XE88LC05 [2],
• RF transceiver for bi-direction communication RADIOMETRIX BiM2-433-64 [3], working at 433MHz (ISM frequency band to comply with local regulations),
• antenna lambda/4, communication range 400m line of sight, • Faraday cage metallic box package,
• autonomous power supply: current transformer (build in two parts, so as to make installation on the conductor simple and rapid) and batteries (back up in case of power failure, three lithium thionyl chloride batteries 3.6V, 19.0Ah)
Figure 3: the microsensors node inside an AWM
Figure 4: the base station
Electrical consumption during normal operation (accelerometer data acquisition, micro-processor running and radio transmission) reachs 19mA at 3.3V, 63mW. In sleeping mode the system consumption is as low as 10µA or 33µW.
The microsensors node (build as light as possible with reduced moment of inertia) has been placed on the line inside an AWM, Aircraft Warning Mass (figure 3: sphere 70cm diam., around 5kg). The base station (figure 4: laptop and Yagi antenna) is located on ground.
3.3 Test Campaign
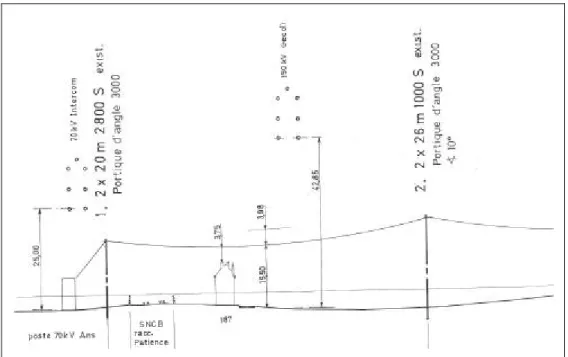
Figure 5: the overhead power transmission line setting-up
Line and conductor caracteristics: - length = 162m
- height diff. between anchorages pts = 4.75m - pylons in concrete
- mass = 0.627kg/m almélec - section = 2.28 e-4 m2
- external diameter = 19.6 e-3 m - number of strands : 37 - strand diameter = 2.8 e-3 m - Young modulus = 4.31 e10N/m2 - thermal coef. = 23 e-6 /K
- nominal rupture load = 73350 N Figure 6: recorded power spectral density - electr. resist. (20°C) = 0.147 Ohm/km
- current load: summer 75 to 150A, winter 125 to 250A; 600A max. in pertubed configuration. After the prototype has been fully tested in laboratory environment, two recorders were placed on a 70kV overhead power transmission line (June 21st, 2004; line power-down maintenance activity window; figure 5: distances from the anchor to the lower pylon d1=24.8m and d2=60.9m).
4 Results and Discussion
The installation of the system on-site run without any problem and the acquired data, sent from the base station to the office through internet, were in line with our expectations.
But the comparison between sag measured value and theoretical one (obtained from installation data) highlights some differences. The measure has been made on 13 dec 04, 10:30 AM. The ambiant temperature was -1.5°C, and the current flow was 190A. With these data, the thermal balance of the conductor gives a line temperature of 2.8°C with an hypothesis of a wind speed of 1.5m/s and a measured solar radiation level of 20W/m2. This is well in accordance with the recorded value of 3°C given by the temperature sensor directly placed on the line.
Using the acceleration values retrieved during the previous quarter of hour, the oscillation frequencies are deduced (figure 6). From these last ones, the geometry of the cable between the two anchorage points is obtained, and then tension t=5705N and sag value s=3.5m. Using the line installation data, it is possible to deduce the cable tension at 3°C and the corresponding sag value; which are found to be theoretically: t=11058N and s=1,8m.
As a check, the sag has been directly measured on site with an optical method (at the same time and at two different locations on the conductor, where Aircraft Warning Masses are located). Then the maximum sag has been computed and found to be less than 10% far from the value computed with the microsensor system transmitted data.
As a partial conclusion for this monitored line span, the effective clearance is much lower than the expected one. At 3°C, tension in the cable has been found 48% lower, and sag 94% higher than what was expected from installation data. These test campaign results look very promising and a first step in the demonstration of the validity and accuracy of the procedure used has been accomplished.
5 Conclusion
A microsystem array for determining the status of one or more overhead power transmission lines has been built and tested to monitor several spans of each line on a real time basis. The mechanical/thermal status of each monitored line span is determined by measuring the conductor temperature, line current, solar radiation, ambiant temperature and wind speed and direction. Some of these parameters are monitored by a microsensors unit clamped on the line conductor, including a radio transmitter to send data to a receiving base station. The others are monitored near the tower. All the data are processed to determine the maximum sag value, and then the current capacity or allowable power load of the corresponding span, and to provide usefull real time health monitoring information on the monitored power network.
6 References
[1] www.analog.com/en/prod/0,2877,ADXL202,00.html
[2] a.parsons.edu/~alina/thesis/ pdfs/microcontollers/xe88lc05_datasheet.pdf [3] www.radiometrix.co.uk/sales/guide.html