This is an author-deposited version published in: http://oatao.univ-toulouse.fr/
Eprints ID: 2263
To cite this document: ESPINOSA, Christine. ILYAS, Muhammad. LACHAUD,
Frédéric. SALAÜN, Michel. Dynamic delamination modelling using cohesive finite
elements. In: 9th International DYMAT Conference on the Mechanical and Physical
Behaviour of Materials under Dynamic Loading, 07-11 Sept 2009, Brussels,
Belgium.
Any correspondence concerning this service should be sent to the repository
administrator:
[email protected]
Dynamic delamination modeling using cohesive finite
elements
M. Ilyas, Ch. Espinosa
1, F Lachaud and M Salaün
Université de Toulouse - ISAE, 10 Avenue Edouard Belin, 31054 TOULOUSE Cedex 4, France
Abstract. In this paper we present a methodology for the prediction of impact induced damage in
aeronautical composite structures. Material under consideration is a carbon fiber and epoxy resin (T800S/M21) unidirectional laminate. Continuum damage mechanics is applied for plies and cohesive finite elements are used for delamination prediction. The numerical simulation results from finite element codes are compared with experimental results.
1. INTRODUCTION
The increasing use of composite materials in primary aeronautic structures requires the designers to understand phenomena of damage initiation and propagation which strongly influence the residual strength and therefore the certification process. Experiments and calculations are carried out to achieve this aim. To represent the mechanical behavior of laminates numerical models are principally based on the finite element (FE) method. Damage initiation and/or propagation are integrated in constitutive laws. Some of the delamination prediction methods are reviewed in ref [1]. The approach chosen here is the cohesive finite element model presented by Camanho & al [2], that was first used in an implicit finite element code, and further in an explicit finite element code by Iannucci [3] and Pinho & al [4]. The formulation is based on cohesive fracture mechanics and distinguish two constants (i) a stress threshold for damage to commence, and (ii) the critical energy release rate for the particular delamination propagation mode as referred to the cohesive fracture mechanics. We have being interested in using arising new numerical methods to model these damage related openings, with the special focus of the residual strength prediction for a wide range of impact loading rates. The presented work is devoted to delamination.
We present in the first part of this paper the cohesive model that has been developed and the data calibration based on mode I and mode II critical energy release rates measurements from DCB and ENF experimental tests. It is applied to an aeronautical composite that has shown a rate effect behavior [7] and as a first but not easiest modeling step to a middle range velocity impact behavior. A 10J impact case is chosen to compare simulations and experiments. Other parts of the present work dealing with damage or use of alternative numerical methods such as meshless ones for plies and structures modeling are presented elsewhere [6, 5].
2. COHESIVE MODEL CALIBRATION
2.1 Cohesive model implementation
Previous work done on the same composite laminate demonstrated that a simple bilinear cohesive model is appropriate to describe initiation and growth of delamination, for both mode I and mode II [8]. The developed model based on the traction separation law is very similar to a cohesive
1
model available in LS-DYNA (MAT138). The mixed-mode displacement generating rupture in a cohesive element is given by Equation 1.
(1)
(2)
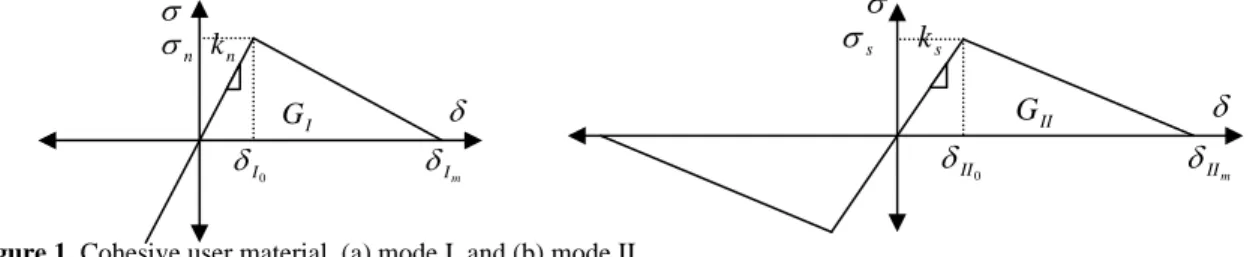
β is chosen at a specific value for pure mode decohesion. For combined modes, β is automatically computed as described in Equation 2. kn and kt are the normal and in plane stiffness, σn and σt the corresponding maximal tractions. The model is described on Figure 1.
Figure 1. Cohesive user material, (a) mode I, and (b) mode II.
2.2 Experimental testing and numerical data identification
Double cantilever beam (DCB) and end notch flexure (ENF) tests were carried out on a servo hydraulic machine under a constant displacement rate of 30m/min (Figure 2). Specimen dimensions for DCB were 120 mm × 25 mm × 3.1 mm and for ENF 100 mm × 25 mm × 3.1 mm, with pre-cracks of 45 mm and 25 mm respectively. Critical energy release rates (Gc) determined
from these tests are given in Table 1.
Figure 2. Mode I testing and opened sample. Table 1. Cohesive material parameters
Normal stiffness,kn (N/mm3) Tangential stiffness,ks, (N/mm3) Normal stress,σn, (MPa) Tangential, σs, (MPa) Mode-I critical strain energy release rate, GIc Mode-II critical strain energy release rate, GIIc
100 100 60 60 765 J/m2 1250 J/m2
The finite element models contain 8 node brick elements with 1 integration point for composite arms and zero thickness cohesive elements with 4 integration points (Figure 3). Both arms are zero degree UD with properties described in Table 2. A single element is used in the width. To insure a pure mode I, and the independency of the results on the numerical parameters, the model was studied in detail and comparisons were performed with results of the literature [9]. An element kill technique is used when the damage criterion based on the ultimate displacement value reached the value of 1 at least at one integration point.
Table 2. Orthotropic material parameters
E11 E22 E33 ν12 ν23 ν13 G12 G23 G13
157 GPa 8.5 GPa 8.5 GPa 0.35 0.35 0.53 4.2 GPa 2.7 GPa 4.2 GPa
1 2 2 0
2(1
)
n t.
r Ic IIck
k
G
G
β
β
δ
δ
−⎡
⎤
+
=
⎢
+
⎥
⎣
⎦
( ) (
)
2 0 0 0 2 2 0 0 0 01
II n s I II I II I n t II Ik
k
β
δ
σ
σ
δ
δ δ
β
δ
δ
δ
δ
βδ
+
=
=
=
=
+
σ δ 0 II δ m II δ II G s k s σ σ δ m I δ 0 I δ n k I G n σFigure 3. Numerical models (a) DCB and (b) ENF.
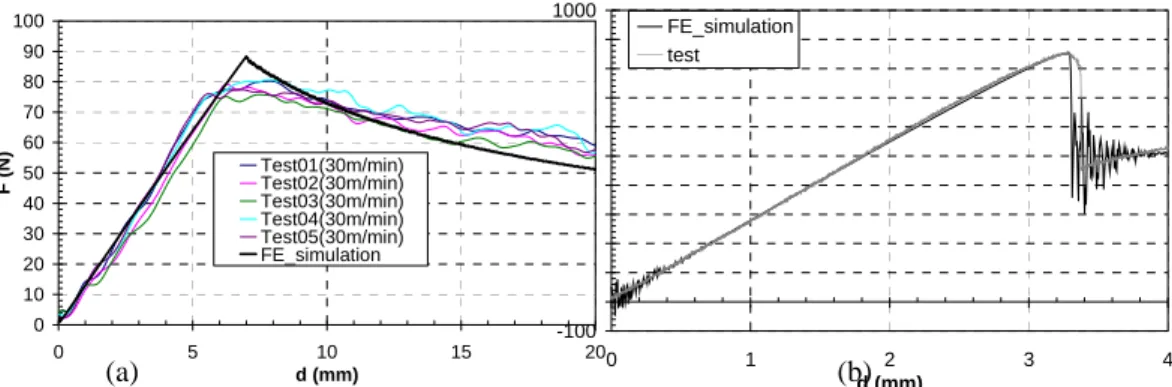
As can be seen on Figure 4, experimental and numerical force-displacement curves for DCB testing (a) and ENF testing (b) are very similar. The decreasing slope for mode I and the peak value of the force are slightly over estimated by the simulation. We can conclude that our mode I model is a bit too elastic.
-100 0 100 200 300 400 500 600 700 800 900 1000 0 1 2 3 4 d (mm) F (k N) FE_simulation test
Figure 4. Comparison of (a) DCB experiments and simulation, (b) ENF experiment and simulations.
3. APPLICATION TO IMPACT DAMAGE MODELLING
Several impact models have been tested to evaluate the ability of our model with different combination of opening modes. Results chosen are for a layering that is used in aeronautical parts in order to reduce the extent of delamination in the interfaces next to external faces. Indeed damages are confined in a more cylindrical through thickness zone around the impact point, instead of the “well known” helicoidally conical shape, essentially due to the external position of the [45/-45] interface. The 150 mm × 75 mm × 2.5 mm plate is simply supported on a metallic support with a rectangular opening of 150 mm × 75 mm. It is impacted by a rigid hemisphere of radius 8mm at 2.955m/s (about 10,3J) using a classical drop weight impact setup shown. Experimental and numerical results are the maximal force vs time and displacement vs time curves. C-Scan measurements for delamination estimation are compared to damage extent.
Eight nodes brick elements with 3ddls per node and 1 integration point have been used for the plies. Contact algorithms are defined between the plate and the support, and the plate and the hemisphere. The cohesive model and related data are the ones presented in the previous section, except the tangential maximal stress that was chosen at the lower value of 40 MPa in [45/-45] outer interfaces. The impact model, layering, and cohesive zones are presented on Figure 5.
Figure 5. ¼ view of 3D numerical mesh model (a) and cohesive zones localization and labels (b).
ux= uy= uz= 0 (a) (b) 0 10 20 30 40 50 60 70 80 90 100 0 5 10 15 20 d (mm) F ( N ) Test01(30m/min) Test02(30m/min) Test03(30m/min) Test04(30m/min) Test05(30m/min) FE_simulation (a) (b) 45 45 -45 -45 0 0 0 0 90 90 Cohesive Coh-1 Coh-2 Coh-3 Coh-4 Coh-5 Coh-6 (a) (b)
Adding the cohesive elements between the plies in the FE elastic model doesn’t change the global shape of the curves, neither the loading slopes, but the peak values and the time duration of the contact with the projectile showing the loss of stiffness during the loading phase of the impact. Compared to the experiment force curve, the cohesive model is too stiff. Surely this discrepancy is due to the lack of damage in the model. To quantify the inaccuracy part of the cohesive model, delaminated areas are compared with C-scan, and simulations with a damage model are done.
Figure 6. Comparisons of test and numerical rear face max deflections (a), impact forces (b) vs time.
Figure 7. C-Scan pictures of the impacted plate (a) recto view from top, (b) verso view from bottom.
The total delaminated area in tests is about 20 mm x 22 mm (Figure 7). Corresponding numerical delaminated areas are delimited by elements which damage parameters are in [0.9;1[, which surround elements killed with damage equal to 1 as in the calibration phase (Figures 8 and 9). Shapes and orientations of numerical delamination are consistent with the well known helicoidally through thickness repartitions: length along the lower ply orientation, and peanut shaped delaminations.
Figure 8. Delamination delimited by bands of elements which damage parameter is in [0.9; 1[ at 2.5 ms.
(a (b -5 -4,5 -4 -3,5 -3 -2,5 -2 -1,5 -1 -0,5 0 0 1 2 3 4 5 time (msec) d is p ( mm) experiment FE_without_cohesive elements FE_with_cohesive elements 0 1000 2000 3000 4000 5000 6000 7000 0 1 2 3 4 5 time (msec) F (N ) experiment FE_without_cohesive_elements FE_with_cohesive elements 20 mm 22 mm 30 mm 27 mm Coh-6 Coh-1 Coh-4 Coh-5 Coh-3 16 mm
Figure 9. Delamination extension through the thickness at 2.5 ms.
Figure 10. History of maximal stresses for mode II (A & B labels) and mode I (C label) in [-45/45] coh-1
bottom cohesive interface and [90/0] coh-3 cohesive interface.
The diameter of the contact area between the projectile and the plate has been measured in the simulations to be around 5 mm (Figure 9). This dimension is a typical length that can be measured in the center the coh-4, coh-5 and coh-6 delamination zones. As can be seen on Figure 8, cohesive elements have been killed or are almost fully damaged in those zones under the projectile, but the contact is closed between the adjacent layers. Thus, even if the total numerical delaminated area is higher than the experimental measure in the central [0/90] and [90/0] interfaces, they have dimensions similar to the experiment in the external interfaces (around 20mm length), and the physics of local punch and global flexion is well reproduced. To this observation, we have plotted on Figure 10 curves of mode II and mode I maximal stresses in one “correctly” approximated interface, and a “less correctly” one. Mode II curves in both cases show a global round shape corresponding to the global bending of the plate, and local oscillations during the loading phase of the impact. These oscillations are related to the wave propagation and go back in the thickness of the plate. In the coh-1 (bottom interface) where the delamination length is consistent with the experiment, it is clear that the signal has not been truncated by the maximal tangential stress of 40 MPa, as is not the case in the [90/0] coh-3 interface. Delamination could then have been initiated in this interface by a mode II cohesive failure generated by the impact induced wave.
Figure 11. History of maximal stresses for mode II (A & B labels) and mode I (C label) in [-45/45] coh-1
bottom cohesive interface and [90/0] coh-3 cohesive interface.
5 mm Coh-3 delamination 27 mm -5 -4.5 -4 -3.5 -3 -2.5 -2 -1.5 -1 -0.5 0 0 1 2 3 4 5 time (msec) di s p ( m m ) experiment FE_coh FE_coh_ply 0 1000 2000 3000 4000 5000 6000 0 1 2 3 4 5 time (msec) F ( N ) experiment FE_coh FE_coh_ply
To go deeper in the analysis of our model’s limits, we have compared on Figure 11, displacement vs time and force vs time curves obtained from experiment, from our model prediction, and from a simulation with a user material model that we have developed based on the model of Matzenmiller [10]. The latter model does not contain cohesive elements [6]. As can be seen, the through ply damage model gives a loading stiffness of the same order than the experimental one, and also global time duration for contact that is of the same order. The peak contact force is smaller with the damage- no cohesion model than it is with the elastic-cohesive one, but is still higher than the experiment. Further work will aim to mix the damage developed model with the cohesive model.
4. CONCLUSION
In this paper we have compared results of impact simulations using a developed bilinear cohesive model, with delamination and global force-displacement versus time curves, for a sample representative of composite material and layering typical of new aeronautical parts.
It has been shown that the computed delamination areas have the same shapes and dimensions in outer layers but are over estimated in the inner layers. This phenomenon is attributed to wave effects and loading rate effects that are not taken correctly into account by the existing model. As this point is crucial for higher velocity impacts, it will be the focus of further works especially for resin reach structures. A second point concern the part of the stiffness loss due to delamination and due to through ply damage. The developed models show that the contact time duration is well reproduced by the through ply damage model, and the delamination “only” makes the force peak diminish. Future works will aim to mix both the developed models: the through ply damage model, and the cohesive model which was the objective of the present paper.
Acknowledgments
The authors are grateful to Higher Education Commission of Pakistan for partial funding. Mr Michel Labarrere and Mr Nasir Shahzad are thanked for their contribution in experimental work.
References
[1] Elder D. J., Thomson R. S., Nguyen M. Q. and. Scott M. L., Review of delamination predictive methods for low speed impact of composite laminates. Composite Structures, 66:677– 683, 2004.
[2] Camanho P. P., Dávila C. G. and De Moura M. F., Numerical simulation of mixed-mode progressive delamination in composite materials. J. of Composite Materials, 37:1415–1438, 2003. [3] Iannucci L., Dynamic delamination modeling using interface elements. Computers and Structures, 84:1029–1048, 2006.
[4] Pinho S. T., Iannucci L. and Robinson P, Formulation and implementation of decohesion elements in an explicit finite element code. Composites : Part A, 37:778–789, 2006.
[5] Ilyas M., Limido J., Lachaud F., Espinosa Ch., Salaün M., Modélisation SPH 3D de l’impact basse vitesse sur plaque composite, Congrès Français de Mécanique, Marseille, 2009.
[6] Ilyas M., Lachaud F., Espinosa Ch. Salaün M., Dynamic delamination of aeronautical structural composites by using cohesive finite elements, 17th International Conference on Composite Materials, Edinburgh, 2009.
[7] Al Maghribi A., Contribution à l’étude du comportement de composites à fibres courtes soumis à des impacts basse vitesse, thèse de l’Université Paul Sabatier, ISAE, DMSM, 2008. [8] Prombut P., Caractérisation de la propagation de délaminage des stratifiés composites multidirectionnels, thèse de l’Université Paul Sabatier, ENSICA, DGM, 2007.
[9] Ilyas M., Lachaud F., Espinosa Ch. Salaün M., Simulation of dynamic delamination and mode I energy dissipation, 7th European LS-DYNA Conference, Salzburg, 2009.
[10] Matzenmiller A., Lubliner R.L., Taylor A., A constitutive model for anisotropic damage in fiber composites, Mechanics of Materials, vol. 20, pp 125-152, 1995.

![Figure 11. History of maximal stresses for mode II (A & B labels) and mode I (C label) in [-45/45] coh-1 bottom cohesive interface and [90/0] coh-3 cohesive interface](https://thumb-eu.123doks.com/thumbv2/123doknet/3724973.111338/6.892.168.742.899.1091/figure-history-maximal-stresses-cohesive-interface-cohesive-interface.webp)
