Institut National de la Recherche Scientifique Téléphone : 418-654-2585
Télécopie : 418-654-2600
Courriel : [email protected]
Development of SMAP Freeze/Thaw algorithms adapted for the Canadian tundra
Abstract
The seasonal Freeze/Thaw (F/T) cycle is a major phenomenon in the climate system and plays an important role in ecosystem functioning by influencing the rate of photosynthesis and respiration of the vegetation, reducing evaporation, reducing the penetration of water into the soil and altering surface runoff. Boreal and arctic regions form a complex land cover mosaic where vegetation structure, condition and distribution are strongly regulated by environmental factors such as soil moisture and nutrient availability, permafrost, growing season length and disturbance. In these seasonally frozen environments, the growing season is determined primarily by the length of the non-frozen period. Variations in both the timing of spring thaw and the resulting growing season length have been found to have a major impact on terrestrial carbon exchange and atmospheric CO2 source/sink strength in boreal regions. The frozen soil mapping can be improved by using the NASA SMAP instrument which includes both a Radiometer and a Synthetic Aperture Radar operating at L-band (1.20-1.41 GHz). In fact, SMAP will be able to monitor the frozen soil because of its capability to make coincident measurements of surface emission and backscatter, and with its ability to sense the soil conditions through moderate land cover. The accuracy, resolution, and global coverage of the SMAP mission should make possible a systematic updating of frozen ground maps and monitoring the seasonal F/T cycle. The main purpose of this project is to enhance the Canadian Plan for SMAP related F/T products by 1) supporting and augmenting an existing ground network in Northern Quebec as the main Cal/Val site related to F/T products in Canada and 2) developing and validating algorithms for the future SMAP mission to monitor F/T over the Tundra and the Boreal Forest using available time series of passive microwave and SAR L-band data. The Cal/Val site will provide field data for the development and validation of algorithms before and after the SMAP mission launch.
ISBN : 978-2-89146-887-9 (version électronique)
Dépôt légal - Bibliothèque et Archives nationales du Québec, 2017 Dépôt légal - Bibliothèque et Archives Canada, 2017
2
Table of Contents
Abstract ... 1 Table of Contents ... 2 List of Figures ... 2 1. INTRODUCTION ... 3 1.1 PROBLEM DEFINITION ... 3 1.2 SMAP MISSION ... 4 1.3 RESEARCH OBJECTIVES ... 5 2 RESULTS ... 62.1 INSTALLATION OF A CORE VALIDATION SITE ... 6
2.2 2014 FIELD CAMPAIGN ... 6
2.3 DEVELOPMENT AND VALIDATION OF F/T ALGORITHMS ... 9
3 2015-2018 RESEARCH ACTIVITIES ... 12
3.1 SAR L-BAND DATA ... 12
3.2 IMAGES PROCESSING ... 12
3.3 2015 AND 2016 FIELD CAMPAIGNS ... 13
4 CONCLUSION ... 13
REFERENCES ... 13
List of Figures
Figure 1 : Location of the surface probes (green dots) operational since 2012-2013, ... 7Figure 2 : Localization of the Sheldrake watershed with the 8 surveyed sites ... 8
3
1.
INTRODUCTION
1.1 PROBLEM DEFINITIONSeasonal terrestrial freeze/thaw (F/T) cycle is an important phenomenon in Earth’s climate system; it has a significant influence on ecosystem processes such as vegetation photosynthesis, soil respiration, evapotranspiration, soil water infiltration, surface runoff, frost heave, and annual ecosystem productivity (Lagacé et al., 2002, McDonald et al., 2004, Smith et al., 2004, Hayashi, 2013).
Boreal and arctic regions form a complex land cover mosaic where vegetation structure, condition and distribution are strongly regulated by environmental factors such as soil moisture and nutrient availability, permafrost, growing season length and disturbance. In these seasonally frozen environments, the growing season is determined primarily by the length of the non-frozen period. Variations in both the timing of spring thaw and the resulting growing season length have been found to have a major impact on terrestrial carbon exchange and atmospheric CO2 source/sink strength in boreal regions,
(McDonald et al., 2004, Kim et al., 2011). The timing of spring thaw in particular, can influence boreal carbon uptake dramatically through temperature and moisture controls to net photosynthesis and respiration processes (Jarvis and Linder, 2000). With boreal evergreen forests accumulating approximately 1% of annual net primary productivity each day immediately following seasonal thawing, variability in the timing of spring thaw can trigger total inter-annual variability in carbon uptake on the order of 30% (Kimball et al., 2004, McDonald et al., 2004). Temporal variations in the onset of frozen conditions in the fall are also significant but generally have less impact on annual productivity due to the increased importance of other controls on vegetation photosynthetic activity such as photo-period length (Kimball et al., 2004). An accurate characterization of the spatial and temporal soil freeze and thaw state, e.g. the timing of F/T transitions and the duration of the frozen season, contributes substantially to the understanding of ecosystem function in northern biomes (Lagacé et al., 2002, McDonald et al., 2004).
As conditions such as cloud cover and available sunlight do not influence the ability of satellite microwave remote sensing techniques to observe land surface properties, microwaves allow the potential for continuous, consistent acquisition of spatially explicit data that is useful for daily monitoring of the land surface properties, including soil conditions (e.g. humidity), vegetation water content and snow water equivalent at any time, day or night (Lagacé et al., 2002). Soil freezing refers to the process of the freezing of water in porous soil media. The water in the soil creates heterogeneity in electrical charge at the molecular level, which causes the molecule polarity. The soil freezing decreases the rotational energy of the molecule which has a positive linear relationship to the dielectric constant. Consequently, the soil dielectric constant is reduced as well as the backscattering energy. Frozen soil behaves like dry soil at the microwave frequencies.
Microwave sensors on board satellite are well adapted tools to monitor the F/T cycle over the Boreal and Arctic regions of North America (McDonald et al., 2004, Kim et al.,
4
2011). Previous F/T cycle studies with low spatial resolution passive microwave sensors like SSMI (Kim et al., 2011) or AMSR-E (Jones et al., 2007, Kalantari et al., 2009) have given encouraging results.
Active microwave sensors (SAR) can determine the state of the soil surface, either freezing or thaw (Rignot et al., 1994, Werner et al. 2003,Khaldoune, 2006). Already, SAR sensors operating in Ku, C and L band have been tested. Those high resolution data can be used also to validate and calibrate the mapping of frozen ground at lower resolution with passive or active instruments (Kalantari et al. 2009). The use of SAR images like PALSAR data allows more detailed information on the freezing ground depending on the land cover type and density and on the presence of dry snow. The determination of the snowmelt period could also be derived from SAR images (Royer et al., 2010).
The frozen soil mapping can be improved by using the NASA SMAP satellite who was launched in January 2015 and is equipped with both Radiometer and Synthetic Aperture Radar operating at L-band (1.20-1.41 GHz). SMAP has the capability of making coincident measurements of surface emission and backscatter at L-band, and this frequency has the ability to sense the soil conditions through moderate land cover.
1.2 SMAP MISSION
The SMAP instrument who includes both a Radiometer and a Synthetic Aperture Radar operating at L-band (1.20-1.41 GHz), will operate on a near-polar, sun-synchronous orbit approximately 680 km above the Earth surface, with a 6AM/6PM Equator crossing and a 8-day repeat ground-track. The swath width will be on the order of 1000 km, which will provide global coverage every 3 days at the Equator, and every 1-2 days at mid and high latitudes. The 6-m diameter deployable mesh antenna with 40° incidence angle will ensure a 40-km footprint for the radiometer and 30-km real aperture footprint for the radar. Range and Doppler discrimination combined with further processing will be used to obtain a 3 km spatial resolution for radar measurements, in synthetic aperture radar (SAR) mode, collected only on descending (AM) portion of orbit (Canadian Science Team, 2013).
The resolution and global coverage of the SMAP mission will make possible a systematic updating of frozen ground maps and monitoring the seasonal F/T cycle. The mission requirement is 80% classification accuracy over an annual cycle. This is actually not that stringent since most areas north of the 45 parallel are frozen for long continuous periods. Basic approach will be to use classification agreement: % agreement; % false hits; % omission.
The post-launch phase is scheduled to start right after In-Orbit Checkout (IOC), 3 months after launch (May 2015). Validation of L1 products including brightness temperatures and backscatters will last 6 months and will result in the delivery of validated L1 products to data centers at Launch + 9 months (October 2015). In contrast, the Cal/Val segment for L2 to L4 products will last 12 months and will end with delivery
5
of soil moisture, F/T state and carbon fluxes products at Launch + 15 months (May 2016). Cal/Val of F/T and carbon products involves both pre- and post-launch activities. The items to be evaluated and calibrated are (Canadian Science Team, 2013):
• L1C_TB: Low-resolution brightness temperatures with a 40-km spatial resolution and available on a 36-km Earth grid;
• L1C_S0_HiRes: High-resolution radar backscatters with a 1 to 3-km spatial resolution and available on a 1-km Earth grid;
• L3_F/T_A: Daily global composite of the F/T state based on active data, with spatial resolution of 1 to 3 km, available on a 3-km Earth grid;
Led by JPL researchers, SMAP FT algorithm requires reference backscatter values for frozen and thawed states. The challenge is to define these at 3 km resolution, pre-launch PALSAR provides high resolution measurements but spatial coverage is limited. The plan is to use Aquarius derived references for L3_F/T_A and update dynamically post-launch using SMAP measurements. This creates latency challenges in producing the L3 FT product during the Cal/Val period but also the importance to evaluate and calibrate the L1C_S0_HiRes product over Canada tundra and boreal forest. The post-launch Cal/Val segment will be followed by an extended monitoring phase that will last for the remainder of the SMAP mission.
1.3 RESEARCH OBJECTIVES
The main purpose of this project is to enhance the Canadian Plan for SMAP related to F/T products. The specific objectives are:
1. To support and enhance an existing ground network in Northern Quebec as the main Cal/Val site related to F/T products in Canada. This Cal/Val site will be use also after the SMAP launch (January 2015).
2. To develop algorithms for the future SMAP Mission to monitor F/T state over the Canadian tundra and boreal forest sites based on SMOS data.
3. To validate low resolution (40 km) F/T maps derived from SMOS data over the Canadian Tundra and the Boreal Forest using field data and high resolution SAR L-band data (potentially in combination with other sensors, like PALSAR). 4. Producing and validating PALSAR high resolution F/T products.
6
2
RESULTS
2.1 INSTALLATION OF A CORE VALIDATION SITE
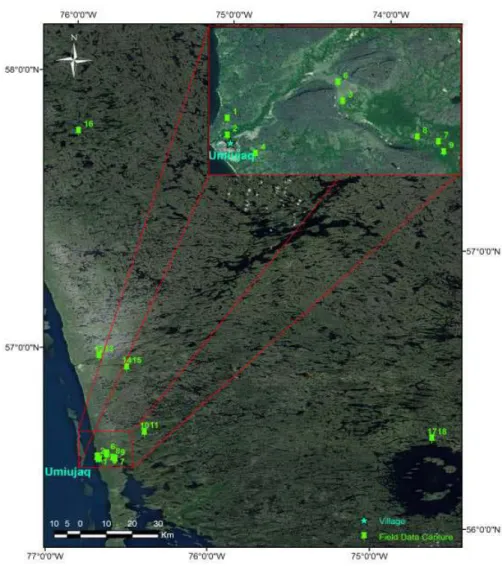
The validation site is located on the eastern shore of the Hudson Bay (QC) Canada in the Nunavik region (Fig. 1). It is a zone of discontinuous permafrost located at the tree line. This region has been the subject of more than 25 years of study by the Centre for Northern Studies (CEN) based mainly at Laval University in Québec City. It is characterized by a complex landscape, including lakes, wetlands, marine, coastal, riparian, permafrost, streams. Back in 2010, data loggers were installed by INRS researchers near the village of Umiujaq (56.55° N, 76.55° O), to measure the water content and soil surface temperature over a few years. The soil texture was analyzed and land cover was also identified for each probe location (#1 to 9).
In summer 2012, soil temperature and TDR sensors were installed in three additional subarctic environments (Fig.1), dominated by thermokarst lakes and hollows; the Boniface River basin (#16) (57.45°N, 76.10°O), the Nastapoka valley (#12-14) (56.55°N, 76.22°O) and the Sheldrake River (#10-11) basin (56.36°N, 76.12°O), as well as in an open black spruce forest near Clearwater Lake (#17- 18) (56.51°N, 74.26°O). To access those watersheds, a helicopter was rented. A total of 17 specific sites are monitored since the summer 2012. The sensors data were recovered in summer 2013 and 2014. We will recover the data and replaced some sensors if necessary in summer 2015, 2016 and 2017. Near Umiujaq, a total of five meteorological stations are operated by CEN, equipped with soil temperature probes for monitoring permafrost up to 20 m. Actually the recorded data are downloaded once a year during the onsite maintenance visit. In preparation of the launch of SMAP, a telecommunication system was installed in fall 2014 to transmit the measurements in real time (daily) in a permanent meteorological station where soil temperature probes are already in place. The equipment shall be functional for a few years and the maintenance will be done by the CEN.
2.2 2014 FIELD CAMPAIGN
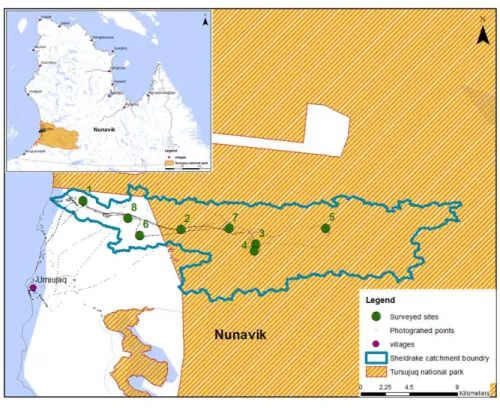
In September 2014, an INRS team of 3 persons did fieldwork in the Sheldrake river catchment, which is 9.5 km north of Umiujaq Village. This catchment is about 34 km long from its source in Sheldrake Lake to the shore of Hudson Bay. Fig. 2 shows the map of Tursujuq National Park and the Sheldrake river catchment boundary.
The purpose of this fieldwork was to get knowledge of landscape in Sheldrake river catchment, collect data about vegetation and soil properties, which will be used in a hydrological model to simulate water cycle in the subarctic region with climate changing condition. Eight (8) sites in all were surveyed during this campaign; five of them are inside the Tursujuq National Park. It is anticipated these sites could represent soil type and vegetation cover of one typical landscape. Helicopter was used to reach these surveyed sites. Their positions are marked with big green dots in Fig. 2 and detailed information is listed in Table 1. Small black dots in Fig. 2 give the locations of the photographs. These photos were mostly taken on the helicopter and several on the
7
ground. These photos will be used to understand landscape heterogeneity in catchment and used as reference for land cover classification from remotely-sensed images (ALOS).
Figure 1 : Location of the surface probes (green dots) operational since 2012-2013, Hudson Bay East Coast, Québec, CANADA.
8
Figure 2 : Localization of the Sheldrake watershed with the 8 surveyed sites
9
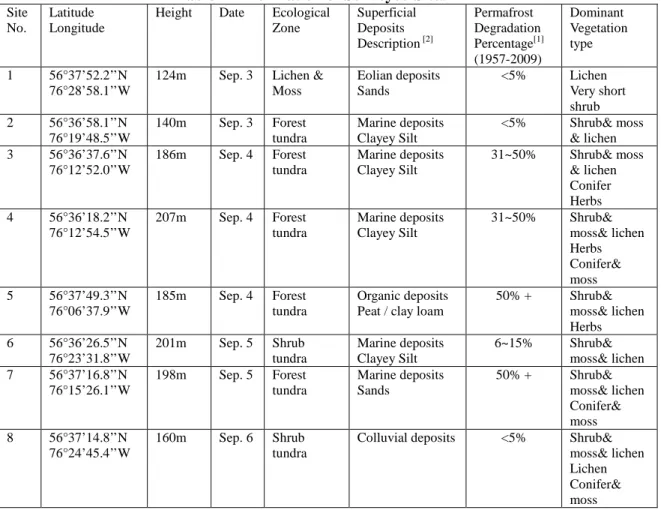
Table 1 Information of Surveyed Sites Site
No.
Latitude Longitude
Height Date Ecological Zone Superficial Deposits Description [2] Permafrost Degradation Percentage[1] (1957-2009) Dominant Vegetation type 1 56°37’52.2’’N 76°28’58.1’’W
124m Sep. 3 Lichen & Moss Eolian deposits Sands <5% Lichen Very short shrub 2 56°36’58.1’’N 76°19’48.5’’W 140m Sep. 3 Forest tundra Marine deposits Clayey Silt <5% Shrub& moss & lichen 3 56°36’37.6’’N 76°12’52.0’’W 186m Sep. 4 Forest tundra Marine deposits Clayey Silt 31~50% Shrub& moss & lichen Conifer Herbs 4 56°36’18.2’’N 76°12’54.5’’W 207m Sep. 4 Forest tundra Marine deposits Clayey Silt 31~50% Shrub& moss& lichen Herbs Conifer& moss 5 56°37’49.3’’N 76°06’37.9’’W 185m Sep. 4 Forest tundra Organic deposits Peat / clay loam
50% + Shrub& moss& lichen Herbs 6 56°36’26.5’’N 76°23’31.8’’W 201m Sep. 5 Shrub tundra Marine deposits Clayey Silt 6~15% Shrub& moss& lichen 7 56°37’16.8’’N 76°15’26.1’’W 198m Sep. 5 Forest tundra Marine deposits Sands 50% + Shrub& moss& lichen Conifer& moss 8 56°37’14.8’’N 76°24’45.4’’W 160m Sep. 6 Shrub tundra
Colluvial deposits <5% Shrub& moss& lichen Lichen Conifer& moss
[1] Permafrost degradation percentage number in table 1 is from article “Jolivel M, Allard M. Thermokarst and export of sediment and organic carbon in the Sheldrake River watershed, Nunavik, Canada. Journal of Geophysical Research: Earth Surface, 2013, 118(3): 1729-1745 ”.
2.3 DEVELOPMENT AND VALIDATION OF F/T ALGORITHMS
It was agreed that the emphasis for the second objective will be on the passive microwave data. After obtaining the SMOS images from the Canadian Archive at Environment Canada (Dorval), SMOS orbits covering the Nunavik between January 2011 and the end of the December 2012 were extracted and the data format was converted from binary format (BUFR) to text (ASCII). Then, SMOS Tb data related to
the study area was extracted. The second step involved filtering the dataset according to the angle of incidence (between 39.5° and 40.5°) as the SMAP instrument incident angle is 40 degree. The third step was the adaptation of the Seasonal Threshold Approach (STA) proposed by Kim et al. (2011) for SSM/I data (37GHz) to produce F/T maps to the SMOS Tb time series. This dynamic threshold was estimated daily, pixel by pixel, using
least-square linear regression between the Brilliance Temperature, Tb (x,t) and the air
temperature near the surface as the independent variable, instead of the NCEP-NCAR reanalysis – air temperature at 2 m data in Kim et al. (2011) model.
10
∆𝑻𝒃𝒑(𝒙, 𝒕) =𝑻𝒉𝒂𝒘𝑹𝒆𝒇(𝒙)−𝑭𝒓𝒐𝒛𝑹𝒆𝒇(𝒙)𝑻𝒃𝒑 (𝒙,𝒕)−𝑭𝒓𝒐𝒛𝑹𝒆𝒇 (𝒙) (1)
Tbp (x, t) (°K): Tbp time series derived from SMOS sensor at pixel (x),
temps (t), and polarization (p);
FrozRef(x) (°K): daily Tb average values, by pixel where temperature
less than 0 by NNR ((NCEP- NCAR) Reanalysis);
ThawRef(x) (°K): daily Tb average values, by pixel where temperature
more than 0 by NNR.
Then a dynamic threshold level was derived for each year, on a grid cell-by-cell basis,
using least square linear relationship between the surface temperatures (the independent variable) and Tb. The dynamic threshold levels for frozen and non-frozen landscape conditions in each EASE-grid cell were determined where ΔTbp (x, t) corresponded to an
air temperature equal 0 °C. In other words:
Dynamic threshold = T(x,t) where ΔTbp(x, t) corresponded to an Ts =0
Then, the SMOS landscape F/T status can be defined such that:
Frozen if : ΔTbp(x, t) <= T(x,t)
Non-frozen if : ΔTbp(x, t) > T(x,t).
The output is a dimensionless DEM binary state variable designated by zero for frozen (0) and (1) for not frozen conditions for each pixel. SMOS F/T results are also composed of no data entries (ND). The comparison of F/T maps with in-situ Ts data yields to a so-called Agreement factor. To validate this adapted algorithm, a study period, from October 20th to December 20th 2012 was chosen. However, the Agreement factor varied between 36 and 64%, which is not acceptable, the NASA target for the SMAP Mission being 80%. The low agreement factor could be related to lack of data on soil type as well as the presence of many lakes and rivers in the region. By introducing new parameters such as of the percentage of the lakes and ponds present in a given SMOS pixel, it is believed that more realistic estimations could be obtained.
Since water bodies causes a decrease in the Tb value of a given pixel. Then, to eliminate
error induced by water, the weighting factor (ai = P * MLRi) of the "lakes and reservoirs"
category for each pixel i was introduced. The slope of the linear regression of Tb vs.
water percentage (P) of the category of the lakes and reservoirs (MLR) on the analyzed
image is always negative even in the presence of ice. The estimated slope can be used for all pixels, but must be recalculated for each day. Then, the Corrected Tbp (x, t) (eq.2) was
calculated per day, pixel by pixel and was introduced in eq. 1 in place of Tbp (x, t).
Corrected Tbp = Tbp - ai (2)
After introducing the weighting factor (a) and processing separately the AM and PM data set, the Agreement Factor was improved to 75-80% for SMOS AM data set.
11
2.4 VALIDATION OF LOW RESOLUTION F/T MAPS DERIVED FROM SMOS The F/T maps derived from SMOS have been validated mainly with data from field temperature sensors and meteorological stations (2010-2012). MODIS products were also used for comparison. Only a few PALSAR images were acquired by ALOS-1 over the study area jointly with SMOS data.
2.5 PRODUCING AND VALIDATING PALSAR F/T PRODUCTS
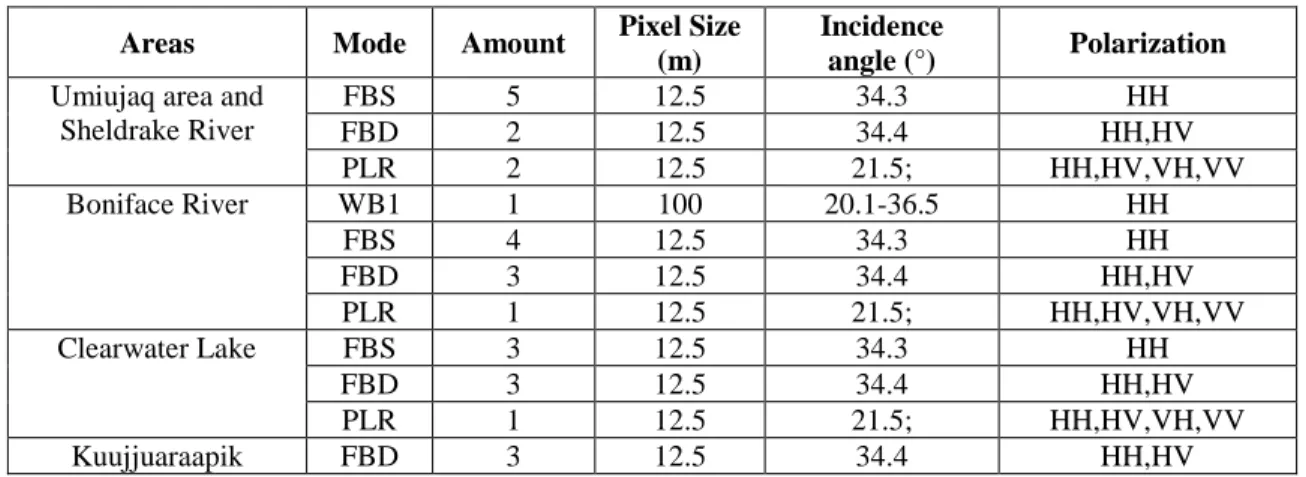
In order to validate the current threshold algorithms (Lagacé et al., 2002; Werner et al. 2003; Khaldoune, 2006) for the Canadian Tundra as well as the McDonald (2011) approach test in Alaska, we downloaded 28 ALOS-1 PALSAR data (L-band SAR, 1.4 GHz) covering the validation study site (Fig.1) and acquired in 2010, 2011 and early 2012. All the downloaded images (Table 2) have been co-registered.
To better understand the impact of soil moisture and vegetation type on the backscattering signal, we have digitized a geomorphologic map done in the eighties and integrated in the data base vegetation maps made with high resolution optical images and RADARSAT-2 polarimetric data. The next step is to extract the backscattering signal by homogenous area and this analysis will be done in April-July 2015 mainly by a new Ph.D. student hired in January 2015. Preliminary results should be available by the time of the SMAP Mission will be operational this summer and will be presented at the ASAR workshop in fall 2015.
Table 2: ALOS-1 PALSAR images characteristics acquired.
Areas Mode Amount Pixel Size
(m)
Incidence
angle (°) Polarization
Umiujaq area and Sheldrake River FBS 5 12.5 34.3 HH FBD 2 12.5 34.4 HH,HV PLR 2 12.5 21.5; HH,HV,VH,VV Boniface River WB1 1 100 20.1-36.5 HH FBS 4 12.5 34.3 HH FBD 3 12.5 34.4 HH,HV PLR 1 12.5 21.5; HH,HV,VH,VV Clearwater Lake FBS 3 12.5 34.3 HH FBD 3 12.5 34.4 HH,HV PLR 1 12.5 21.5; HH,HV,VH,VV Kuujjuaraapik FBD 3 12.5 34.4 HH,HV
12
The use of very high resolution SAR images (25m, 50m) allows more detailed information on the freezing ground depending on the land cover type and density and on the presence of dry snow. In conjunction with year-round ground truth measurements, this very high resolution F/T mapping will be used to specify the uncertainty of the retrievals SMAP SAR Product (1 km and 3 km) as well as low resolution passive data.
3
2015-2018 RESEARCH ACTIVITIES
3.1 L-BAND PASSIVE MICROWAVE F/T ALGORITHM
3.2 SAR L-BAND DATA
We will start to acquire and analyse SMAP SAR data (L1C_S0_HiRes, 1 km resolution) as soon as they will be available in summer/fall 2015. To evaluate the data quality and the accuracy of the F/T algorithms, we will use surface air temperature and soil temperatures as well as vegetation and geomorphologic maps and snow depth data. Geomorphologic maps and permafrost depth data are available for the Umiujaq-Sheldrake area (Lévesque et al., 1988), providing vital information about the type of deposits at a 1:50.000 scale, that will be used as landscape reference in the image analysis.
Also, PALSAR ALOS-2 data (50 m resolution) will be ordered starting in summer 2015 and up to summer 2016 over the Umiujaq-Sheldrake area to be coincident with SMAP data acquisition.
L3_F/T_A product (Daily global composite of the F/T state at 3km resolution) should be available in 2016 and will then be validated for the winter 2016-2017 and winter 2017-2018 up to January 2018 over the Canadian Tundra.
3.3 IMAGES PROCESSING
According with the results of the ALOS-1 PALSAR data F/T analysis, we will apply on PALSAR ALOS-2 and SMAP L1C_S0_HiRes of the Umiujaq-Sheldrake area the fixed threshold algorithms used by Lagacé et al. (2002) and Khaldoune (2006) or the McDonald (2011) dynamic seasonal threshold approach. We will compare the algorithms performance with the SMAP L3_F/T_A map product.
13
3.4 2015 AND 2016 FIELD CAMPAIGNS
Field campaigns with a minimum of 10 days each are planned for August 2015, April 2016 and August 2016. More sites being representative for typical local soil types, vegetation cover and snow cover properties will be selected in summer 2015 to serve as ground control points for image analysis (SMAP L1 and L2 products, PALSAR data and derived F/T maps) and point simulation results (using the geomorphologic maps as landscape reference). These sites will be re-visited in the April 2016 and August 2016 to monitor the evolution covering thermal cycles. In winter, snow cover properties will be measured.
4
CONCLUSION
Delays in the processing of the ALOS-1 PALSAR data were due to change in personal affectation over the last 12 months. All the research assistants were involved in a major CSA project. A new resource was affected to mitigate the delays in fall 2014: a part time research assistant was hired and started to digitize the geomorphologic map, but many technical problems (many small polygons) were accounted. A new Ph.D. student, Chaima Touati, was recruited last January but she needs some time to get familiar with the processing of L-band SAR data. She will adapt the F/T algorithms to PALSAR data (ALOS-1 and -2) and the tundra environment. She will validate SMAP L1C_S0_HiRes data (High-resolution radar backscatters with 1 to 3-km spatial resolution) to monitor F/T state at medium/high resolution over the Tundra and the Boreal Forest in Canada.
Finally, we learned on March 27, 2015 that INRS will get financial support to pursue this L-Band Freeze/Thaw monitoring project over the next 3 years. It is the motivation for asking an extension of the agreement with JAXA until the end of March 2018. The extension will also allow Chaima Touati to complete her doctoral thesis, to participate in ALOS workshops and to publish.
REFERENCES
Allard, M., Seguin, M. K. 1987. The Holocene evolution of permafrost near the tree line, on the eastern coast of Hudson Bay. Can. J. of Earth Sciences, 24(11): 2206-2222. Becker, B. R., Misra, A., Fricke, B. A. 1992. Development of correlations for soil
thermal conductivity. Int. Communications in Heat and Mass Transfer, 19(1), 59-68. Canadian Science Team and Community, 2013. Canadian Science And Applications Plan
for the Soil Moisture Active And Passive Mission, Oct. Environment Canada, 75 pp. Entekhabi, D., Njoku, E. G., Houser, P., Spencer, M., Doiron, T., Kim, Y., Smith, J.,
Girard, R., Belair, S., Crow, W., Jackson, T. J., Kerr, Y. H., Kimball, J. S., Koster, R., Mcdonald, K. C., O'neill, P. E., Pultz, T., Running, S. W., Shi, J., Wood, E. Van Zyl, J. 2004. The Hydrosphere State Satellite Mission: An Earth System Pathfinder for Global Mapping of Soil Moisture and Land Freeze/Thaw. IEEE TGRS, 42, 21842195. Hayashi, M. 2013. The Cold Vadose Zone: Hydrological and Ecological Significance of
14
Kalantari, P., M. Bernier, J. Poulin, (2009) Utilisation conjointe de données de micro-ondes passives et actives pour le suivi du gel saisonnier du sol de la toundra dans le nord du Québec. 30ième CSRS, 22-26 Juin, Lethbridge, Alberta, Canada, 12 pages. Khaldoune, J. 2006. Développement d'une méthode de mesure et de cartographie du gel
du sol en milieu agricole à l'échelle d'un bassin versant à partir d'images radar monopolarisées, multipolarisées et polarimétriques, [Québec], INRS.
Kim, Y., Kimball, J. S., Mcdonald, K. C. Glassy, J. 2011. Developing a Global Data Record of Daily Landscape Freeze/Thaw Status Using Satellite Passive Microwave Remote Sensing. IEEE TGARS, 49, 949-960.
Kimball, J. S., Mcdonald, K. C., Keyser, A. R., Frolking, S. Running, S. W. 2001. Application Of The Nasa Scatterometer (Nscat) For Determining The Daily Frozen And Nonfrozen Landscape of Alaska. Remote Sensing Of Environment, 75, 113-126. Kimball, J. S., Mcdonald, K. C., Running, S. W. Frolking, S. E. 2004. Satellite Radar
Remote Sensing of Seasonal Growing Seasons For Boreal and Subalpine Evergreen Forests. Remote Sensing of Environment, 90, 243-258.
Jolivel M, Allard, M. 2013. Thermokarst and Export of Sediment and Organic Carbon in the Sheldrake River Watershed, Nunavik . J.Geophysical Res.: Earth Surface, 118(3). Jones, L. A., J. S. Kimball, 2007. "Satellite Microwave Remote Sensing of Boreal and
Arctic Soil Temperatures from AMSR-E." IEEE TGARS 45(7).
Kane, D. L., K. M. Hinkel, D. J. Goering, L. D. Hinzman, And S. I. Outcalt, 2001: Non-Conductive Heat Transfer Associated with Frozen Soils, Global Planetary Change,29. Lagacé, C., Bernier, M, Gauthier, Y. 2002 : Cartographie du gel saisonnier du sol en zone
de taïga à partir d'images RSO de RADARSAT-1 et SSM/I. Télédétection, 2,161-175. Lévesque R, Allard M, Seguin M K. 1988. Le pergélisol dans les formations quaternaires
de la région des rivières Nastapoka et Sheldrake, Collection Nordicana.CEN. 51. Mcdonald, K. C., Kimball, J. S., Njoku, E., Zimmermann, R. & Zhao, M. S. 2004.
Variability In Springtime Thaw In The Terrestrial High Latitudes: Monitoring A Major Control On The Biospheric Assimilation Of Atmospheric Co(2) With Spaceborne Microwave Remote Sensing. Earth Interactions, 8.
Mcdonald, K. C., 2011, Mapping Global Wetlands And Boreal Freeze/Thaw With ALOS Palsar Science Team Meeting #16 – Phase 3 Kick-Off, Jaxa, Tsukuba/Tokyo, 17-21. Rignot, E., Way, J. B., Mcdonald, K., Viereck, L., Williams, C., Adams, P., Payne, C.,
Wood, W. Shi, J. 1994. Monitoring of Environmental Conditions in Taiga Forests Using ERS-1 SAR. Remote Sensing of Environment, 49, 145-154.
Royer, A., Goïta, K., Kohn, J. & De Sève, D. 2010. Monitoring Dry, Wet, and No-Snow Conditions From Microwave Satellite Observations. Ieee Grs Letters, 7, 670-674. Smith, N. V., Saatchi, S. S. & Randerson, J. T. 2004. Trends in High Northern Latitude