HAL Id: hal-00620213
https://hal.archives-ouvertes.fr/hal-00620213
Submitted on 7 Sep 2011
HAL is a multi-disciplinary open access
archive for the deposit and dissemination of
sci-entific research documents, whether they are
pub-lished or not. The documents may come from
teaching and research institutions in France or
L’archive ouverte pluridisciplinaire HAL, est
destinée au dépôt et à la diffusion de documents
scientifiques de niveau recherche, publiés ou non,
émanant des établissements d’enseignement et de
recherche français ou étrangers, des laboratoires
Detecting design trends using perceptive tests based on
an interactive genetic algorithm
Emilie Poirson, Jean-François Petiot, Julien Bénabès, Ludivine Boivin, David
Blumenthal
To cite this version:
Emilie Poirson, Jean-François Petiot, Julien Bénabès, Ludivine Boivin, David Blumenthal. Detecting
design trends using perceptive tests based on an interactive genetic algorithm. IDETC 2011, Aug
2011, Washington, United States. pp.DETC 2011/DTM-47923. �hal-00620213�
Proceedings of the 23th International Design Engineering Technical Conferences & Conference on Design Theory and Methodology IDETC/DTM 2011 August 28-31, 2011, Washington, DC, USA
DETC 2011/DTM-47923
DRAFT: DETECTING DESIGN TRENDS USING PERCEPTIVE TESTS BASED ON AN
INTERACTIVE GENETIC ALGORITHM
Poirson Emilie IRCCyN Nantes, France Petiot Jean-François IRCCyN Nantes, France Bénabès Julien IRCCyN Nantes, France Boivin Ludivine Renault Guyancourt, France Blumenthal David AgroParitech Massy, France ABSTRACT
To avoid flops, the control of the risks in product innovation and the reduction of the innovation cycles require valid and fast customer’s assessments. An Interactive Genetic algorithm is proposed for eliciting user’s perceptions concerning the shape of a product, in order to stimulate creativity and detecting design trends. Interactive users’ assessment tests are conducted on virtual products, for capturing and analyzing users’ responses. The IGA is interfaced with a CAD software (CATIA V5) and allows the creation in real time of a set of parameterized designs, which are presented iteratively by a graphical interface to the user for evaluation.
After a description of the IGA, we present a study on the convergence of the IGA, according to the tuning parameters of the algorithm and the size of the design problem. An experiment was carried out with a set of 20 users on a
particular product, table glasses. We describe the
implementation of the perceptive tests and an analysis of the results. These results show how the IGA can be used to elicit user perception and detecting design trends.
Keywords: interactive genetic algorithms, shape design,
convergence, perceptive tests
INTRODUCTION
In automotive design, fitting with the expectations of the users is a crucial issue. These expectations can be functional or can concern subjective aspects (sensory or semantics). In particular, the external form of a product is an important variable in the success or the failure [1], as it conditions the ergonomics, the aesthetics but also the product semantics [2].
When industrials address a new specific semantic dimension, such as a need of "innovative dashboard", the challenge for the company is to clearly understand what does the verbatim "innovative" mean for the users, if it means the same thing for everybody and how translate it in design attributes. On the one hand, consumers know what they want (and what they don’t) but they generally are not able to formulate precisely their need in technical terms or to justify their choices according to design attributes [3]. On the other hand, companies develop competences in product design but they encounter difficulties to anticipate precisely the consumer's acceptance. Therefore, a key challenge in product design is to analyze consumer's evaluation to extract useful information for product innovation [4]. Many research works concerning form design are dedicated to the integration of users’ response in the design process [5], [6]. In Japan, Kansei engineering is a powerful approach to product design involving user’s perceptions [7] [8]. In engineering, the MultiAttribute Utility Theory (MAUT) has become the basic theory to express an objective function including consumers’ perceptions and preferences [9] [10]. For example, support vector machine [11] or Interactive Genetic Algorithms (IGA) are proposed for capturing aesthetics intention of users [12]. Interactive evolutionary computation (IEC) has been motivated by the need to entrain knowledge and subjectivity into evolutionary optimization [13] where qualitative evaluation of evolutionary outcomes is vital, such as fields of art and design. IGAs are based upon the idea of involving a human as an evaluator in an evolutionary process. The concept is that human interaction with potential designs can be useful when the traditional fitness evaluation used in normal Genetic Algorithms is difficult or impossible to describe with an explicit expression [14]. In [15]. Brintrup et al use the IGA to handle qualitative criteria and prove that a
multiobjective algorithm is more efficient than a sequential one. The products are there doubling evaluated, qualitatively and quantitatively. In our case, the aim is not to find a compromise but to guide the design by the perception. Only perceptive evaluations have sense.
Our work is in this context. We propose to use interactive user assessments in order to extract design attributes corresponding to a specific semantic dimension of a particular product. The main objective is to detect design trends concerning the form of products, by conducting interactive evaluation tests on virtual products. The method is based on an iterative selection process by the use of representative models of the product, defined by their CAD model. The choices of the user are interpreted by an Interactive Genetic Algorithm (IGA). The work presented in this paper belongs to a more important project concerning the semantic of car dashboards, proposed by the French company Renault. Previous papers [16], [17] and [18] are dedicated to this study and in particular to the definition of the CAD models of the dashboard. In this paper, we propose to describe the general framework for the interactive users’ assessments, and to illustrate the method with subjective tests involving a panel of subjects, on a simple product, a table glass.
This paper is organized as follows. After a short background on GA, Section 2 describes the implementation of the IGA used in this study. The following section presents the process proposed to set up the parameters of the IGA, used for the subjective tests. According to the parameters and the size of the design problem, defined in this section, the IGA is tested with a panel of subjects on three perceptive tests. These problems and the analysis of the results using HAC obtained for each test are presented in section 4. The last section concludes this paper.
IMPLEMENTATION OF THE IGA
Background on Genetic algorithms
Genetic algorithms are evolutionary optimization methods [19]. The principle of genetic algorithm is based on iterative generations of population of individuals, converging step by step toward solutions which are adapted to the problem. Based on the principle of Darwin’s natural evolution theory, the algorithm proceeds to a selection of parents, which will spread in the next generation their genetic dominant heritage, suitable for a desired objective.
Classically, the fitness evaluation of the individuals is numerically calculated, ignoring the user. A particular category of GA, Interactive Genetic Algorithms (IGA) introduces the user in the optimization loop to assess the fitness. At each iteration, the user selects solutions (products) that he/she considers as the most interesting for the desired objective. After a number of iterations (convergence loop), the method may converge toward solutions that satisfy the objective desired by the user. These algorithms are used for example to
explore design spaces and to encourage creativity [20] [21] [22]. They have the advantage to not require an explicit and unique formulation for all users of the fitness function, given that the user plays this role. For some applications, this advantage is crucial.
IGA in contexts
The key point of the methodology is that the user’s assessments are iterative (the user navigate in a virtual design space) and that the IGA may lead to the convergence of the navigation toward “representative” designs. A computational framework is proposed for the capture of the user’s response to a set of “virtual” designs (Fig.1). Our IGA uses discrete-valued variables, in order to fit with the industrial constraints of the car dashboard. It is based on the following stages:
1. Definition of the design variables: entities that drive the
CAD model,
2. CAD modelling. Each product is represented with the CAD
software (CATIA) by a parameterized model
3. Interactive user’s tests. An interactive and iterative
assessment test is proposed to a set of users. From a population of products, the user has to select the ones which are the most representative of the considered semantic dimension (knowing that this particular fitness function is unknown). The IGA generates new population of products, which are iteratively proposed to the user for evaluation.
4. Analysis of the results. The final choices of each user are
analyzed in order to uncover common properties and representative attributes of the subjective dimension studied. Although the industrial study is applied to car dashboards (study still in progress), we will describe the method on a simpler product. The application chosen for reasons of complexity and confidentiality is a simple, single material product, for which the design is very influential on the image connotations: a wine glass.
Encoding of the design variables
Each design variable of the glass can take different values defined in advance (called “levels”) (). A particular design is represented by a chromosome containing one level for each variable.
The interactive user test is in fact an optimization problem represented by:
-Optimization variables: the control points of the sketch, driving the form of the glass,
-an objective function: the distance between what a user has in mind as an “elegant glass of wine” and the representations that are showed. This function has to be minimized.
A particular design is represented by a chromosome of variables, each variable having a particular number of levels. A variable is represented by a binary string where the length of the string depends on the number of allowed levels for the
variables. The following subsection presents the mechanism of the IGAs implemented and describes the input parameters.
IGA process
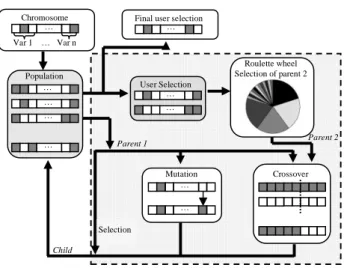
Figure 2 presents the general mechanism of the IGAs. The IGA creates an initial population of designs and presents them to a user, who then selects a subset of these individuals. The number of individuals per generation does not depend on the IGA methodology. It is chosen according to the number of variables and levels and the comparison capacities of the users. Thanks to a roulette method, the selected individuals are
favoured to be parents of the next population. A new population is thus created and the hand is given to the user to select again their “favourite”. This cyclic method runs till the maximum of generation is reached.
As in the MOGA-II algorithm (see [23]), each chromosome of the population is a parent of the following generation, that gives robustness to the algorithm. Furthermore, the use of directional crossover helps the fastness of the convergence.
List of design variables 1. Definition of variables Set of Products 2. CAD Modelling 3. Interactive user’s tests 4. Analysis of the results Parameterized product space Selected products Design constraints
Figure 1 SYNOPTIC OF THE METHODOLOGY AND DEFINITION OF THE DIFFERENT STAGES.
Figure 2 SYNOPTIC OF THE IGA PROCESS [24].
The efficiency of the IGA is ruled by its 3 operators and by the values of the following parameters:
-crossover - crossover rate Rc and roulette wheel rate
Rw for the selection of the second parent,
-mutation - mutation rate Rm, -selection - selection rate Rs.
The crossover rate (Rc), mutation (Rm) or selection (Rs) are real values chosen between 0 and 1 so as Rc + Rm + Rs = 1. Concerning the creation of the next generation (the grey square in dotted line on Fig.2), each individual of the current population is chosen one after one. The operation to apply to this individual (selection, mutation or crossover) is chosen
randomly. An indicator rand(i) is randomly chosen between 0 and 1 with a uniform distribution.
-if rand (i) < Rc, the operation is a crossover, -if Rc≤rand (i)≤Rc+Rm, the operation is a mutation, -if rand (i)> Rc+Rm, the operation is a simple selection
(copy of the individual).
Crossover
The crossover is a classical operator of reproduction which allow to accelerate the convergency. It is a single point crossover. This operation needs a second parent, selected randomly in the other individuals, according to the roulette wheel parameter. For the selection of the second parent, the individuals selected by the users have a percentage of chance to be chosen multiplied by Rw. The point of crossing is also randomly chosen between the variables, and the binary strings are cut at that point. The two head pieces are swapped to create two new individuals. One of them is randomly selected in our case.
Mutation
The mutation is an operator that ensures diversity from one generation to the next. If this operator is selected, one of the variables, randomly chosen, is randomly mutated. It means that another level of the variable is used for the new individual.
Selection
The individual selected is directly introduced in the new population, without change (recopy).
Population Chromosome Var 1 … Var n User Selection Mutation Crossover Roulette wheel Selection of parent 2 Selection
Final user selection
Parent 1 Parent 2 Child … … … … … … … … … …
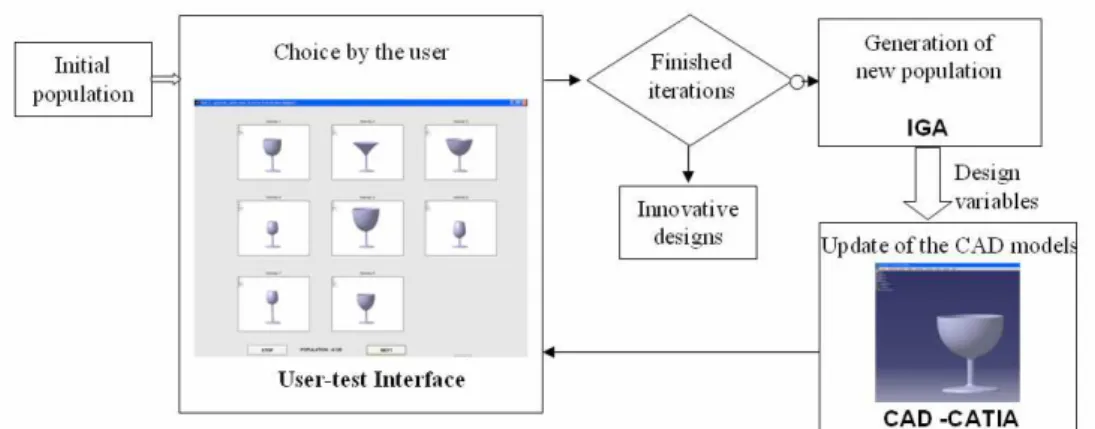
Interface links with the CAD software CATIA
The IGA were implemented with Matlab and fully interfaced with the CAD software CATIA. For each iteration, the updates of the designs variables, generated by the IGA, are automatically transferred to the parameters table of the CAD model. A 3D model of each design is created, and transferred back as a picture to the main interface program. The iterative test includes the following stages ():
-an initial population of 8 individuals, chosen randomly, is proposed to the user,
-the user selects 0, 1 or 2 designs which are suitable to represent the particular semantic attribute defined in advance (“elegant” glass of wine in this study),
-from the choices of the user, the IGA generates a new population of designs, defined by their genome (vector
of design variables),
-for each new design, the CAD system updates the mockup, defined by its design variables. The pictures of the designs are stored and transferred to the user-interface for a new assessment,
-this process continues iteratively until the maximum number of iterations is reached,
-the final choices of the user and the historic of the user’s choices are stored.
Before carrying out the perceptive tests, the IGA internal parameters should be adequately chosen. It is clear that the performance (number of generations needed to reach the target) of an IGA on a specific problem can be enhanced with a fine tuning of its parameters.
Figure 3 FRAMEWORK OF THE ITERATIVE USER-TEST.
PROCESS FOR THE TUNING OF THE IGA
PARAMETERS
Our IGA process can be run in two modes:
-the manual mode: a real user evaluates the products of each generation and makes choice,
-the automatic mode, where the user is simulated. To simulate a user, we arbitrarily choose a target product in the design space, and compute a distance function between the individuals and the target, in order to simulate at each generation the choices of a user. Calling this algorithm IGA is a misnomer since the algorithm is no longer interactive but for better understanding, automatic mode for IGA will be kept. To tune the parameters of the IGA, we used it in automatic mode, in order to be able to launch several simulations (runs) in the same conditions, and to have an average estimation of the convergence. This process will also allow us to define the reasonable size of the design space (number of variables and number of levels) that can be addressed in manual mode, given that the number of generations that can be assessed by a subject is inevitably bounded.
The input variables of the tuning process are: - The size of the problem:
-Number of variables (nvar) of the product
-Number of levels (nlev) for each variable (how many values can take each variable)
- The parameters of the IGA:
-Wheelrate Rw: weight given to a selected individual
-Crossrate (0≤Rc≤1)
-Mutrate (0≤Rm≤1-Rc)
-Selection rate Rs (Rs=1-Rc-Rm)
The objective of this process is to evaluate the minimum number of generations of the IGA necessary to converge toward the target. For obvious reasons of users fatigue, we need to find the parameters which minimize the numbers of generations. For a specific problem size (number of variables, number of levels), and a specific set of IGA parameters, the IGA is run N times. The initial population, with 8 individuals, is randomly initialized. For each iteration of the algorithm, the distance
d
j between each individualj
and the target is computed. This distance is defined by the 1-norm between the ranks of the variables of the individual and the ranks of the variables which define the target. For each simulation of the IGA, the target is defined by:] ,..., , [t1 t2 tnvar = t (1)
For each individual
j
, the distanced
j is defined by:d
j=
rankx
ij−
rankt
ii=1
n var
∑
(2)with: rankti: rank of the level of the variable ti
rankxij: rank of the level of the variable i for individual j Then, for each iteration of the IGA, the two individuals which minimize this distance are automatically selected. These individuals are considered as the closest individuals to the target. According to this selection, the IGA generates a new population of individuals.
The convergence of the IGA is defined by:
2
)
min(
8 1≤
=jd
j (3)We arbitrarily consider that the IGA converges and then stops the process if the distance between an individual, generated by the IGA, and the target is lower than 2 (difference of 2 ranks). For each set of IGA parameters (setparam(j)), the IGA process is simulated N =10 times and the number of generations (n_geni) realized by the IGA is measured. The mean value of
these numbers of generations is computed:
mean _ gen
setparam( j )=
(
n _ gen
i) / N
i=1N
∑
(4)When all the IGA parameters have been tested, the minimum value of the generations is computed, for a given problem size:
min_ gen
size−problem=
min(mean _ gen
setparam( j ))
(5)The corresponding set of IGA parameters is finally selected. This process is run for each set of IGA parameters and for each size of problem. A systematic exploration of the variables of the process is carried out, according to the following intervals of variation:
-
1
≤
n var
≤
8
, with a step of 1 -2
≤
nlev
≤
6
, with a step of 1 -4
≤
R
w≤
16
, with a step of 4 -0.2
≤
R
m≤
0.8
, with a step of 0.2-
0
≤
R
c≤
1
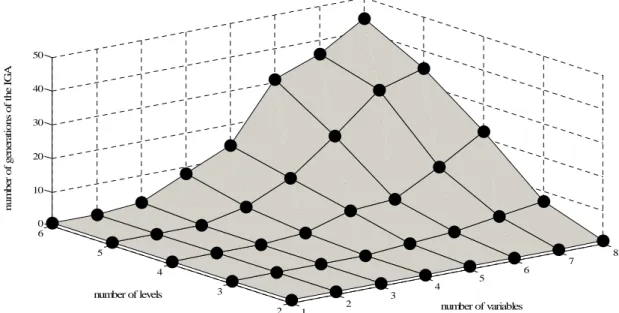
, with a step of 0.2Consequently, this global automatic process, previously described, generates a cartography with, on the X axis, the number of variables, on the Y axis, the number of levels and on the Z axis the number of generations min_gensize-problem of the IGA. This cartography is illustrated in Fig.4.
1 2 3 4 5 6 7 8 2 3 4 5 6 0 10 20 30 40 50 number of variables number of levels n u m b er o f g en er at io n s o f th e IG A
Figure 4 CARTOGRAPHY OF THE IGA IN AUTOMATIC MODE.
This cartography allows us to know the size of the design problem which is reasonable to tackle with “real” user
selections (manual mode), and also the values of the IGA parameters.
We estimated around 20 the number of generations which can be supported by a subject before fatigue. Consequently, we decided to select a size of problem defined by 5 variables and 5 levels for each variable for the rest of the study (the IGA, in automatic mode, needs 10 generations to converge for this size of problem). The best set of IGA parameters, for the size of problem, defined by 5 variables and 5 levels, is:
R
w=16,m
R =0.2 and Rc=0.8.
PROTOCOL AND RESULTS OF THE PERCEPTIVE TESTS
The IGA framework has next been used with users on particular perceptive tests. The objective is to know in which extend the method is suitable to provide trends to a designer, concerning the shape of a given product. Three tests were proposed to a panel of 20 subjects (age between 22 and 25), students at Ecole Centrale de Nantes.
For the 3 following tests, the following information were unchanged:
-the values of Rw =16, Rc =0.8, Rm = 0.2 -20 generations maximum were allowed,
-possibility for the subject to stop the test before the 20th generation, if he/she estimates having fulfilled the task, -at the end of the process, the subject had to give a score
between 0 and 10 for the selected product. The details of each test are given in the next subsections.
Test 1: goal-seeking task
This test can be considered as a warm-up for the users involved. It is a way to help them to familiarize with the interface, and for us to estimate the level of performance of the method.
A simple revolution solid, made of 5 cylinders of decreasing diameters (Fig.5 Figure 5a a), was modeled in advance with the CAD software. This solid constitutes the target of the test. This very simple solid has been chosen in order to avoid the problem of just noticeable differences between the different forms (the 5 distinct cylinders, arranged by order of size, are considered as distinguishable among all the other solids of the design space).
The design space has 5 variables (the diameters of the cylinders), with 5 different levels. In this first test, the task of the subject was to select the individual the most similar to the target, showed by its picture during all the test.
The objective was to test whether subjects were able to make the IGA populations converge toward a given goal.
Figure 5a “TARGET” OF
TEST1.
Figure 5b: GRAPH OF CONVERGENCE (MEAN DISTANCE TO THE TARGET) OF
SUBJECT 18 .VS. NUMBER OF GENERATIONS.
The session lasted an average duration of 9 minutes, which is reasonable for a perceptual test.
The first result is that 55% of subjects found the target, quitting the test before the end and scoring 10/10 to their last choice. A second group is composed of 25% of subjects: they didn’t found the target exactly but were much close to. Indeed, the product finally selected was composed of 4 variables whose level was correct, and one variable whose level was adjacent to the target (difference of one rank). Few generations might have allowed these subjects to reach the target. This proves that the IGA can converge, that is to say, to find the target, a small number of assessments over the product space is possible.
To illustrate the improvement of the quality of the populations, Figure 5a Fig.5b shows, for a particular subject, the evolution of the average distance to the target of the current population (Euclidian distance), according to the number of generations. In this first test, the product is very simple and with easily “readable” forms. The next question was to know how the IGA behaves with a product where the variables and differences between the levels are less marked.
Test 2: goal-seeking task
The second test is an exact replication of test 1, except that the target is a picture of a CAD model of a French real life product: a wine glass. This glass, permanently visible on the interface, is defined by 5 variables with 5 levels.
Figure 6 DEFINITION OF THE 5 VARIABLES TO
PARAMETRIZE THE GEOMETRY OF THE GLASS. The test lasted about 8 minutes in average, as for test 1. The calculation time for the update of the population with the CAD system is the same as test 1, because the problem has of the same size. The “target” needed in average 16.75 generations to appear, compared to 8 in the first test. The first result is that the convergence was in average longer for test 2 than for test 1, because the form is not so easily “readable” as in test 1.
The second result is that nobody found the target. In other words, nobody selected the glass with the exact level of the target for each variable. More interesting, we noticed that quite half of the subjects stopped the algorithm before the end, meaning that they thought they have reached the target under the hypothesis that the test was not too difficult, meaning that the subjects did see the difference between products.
To estimate the variability of the choices of the subjects, for each variable Vj, the following standard deviation σj was computed:
σ
j=
1
S
(rank v
ij−
rank v
target, j)
2
i=1
S
∑
(6)with S: number of subjects
rankvij: rank of the level of variable Vj, chosen by
subject i
rankvtarget,j: rank of the level of variable Vj, for the
target
To avoid a scale effect due to the amplitude of variation of the variables, the standard deviation was computed on the rank of the level of the variables, instead on the value of the variable. This standard deviation σj estimates, for each variable, the degree of consensus of the subjects (e.g. σj = 0 if all the subjects chose the same level for the variable Vj).
Table 1 shows the standard deviation for each variable between the target and the final choice of the subjects.
Table 1. STANDARD DEVIATION OF THE FINAL CHOICE FOR EACH VARIABLE. THE POP 1 GROUPS THE SUBJECTS WHO THOUGHT TO HAVE FOUND THE TARGET AND POP.TOT IS THE FULL POPULATION OF SUBJECTS.
V1 V2 V3 V4 V5
Σ(Pop 1) 0 0.33 0 0.89 0.44
Σ(Pop. Tot.) 0.6 1.22 0.39 1.1 1.02 For example, 0 for V1 for the Pop1 means that every member of Pop1 stopped the simulation by selecting a product with the same value of V1 than the target. The more important is the value, the less consensual is the panel.
Results of SEQ Tab. 1 show that the 5 variables chosen don’t have the same influence on the results. For the Pop 1, everybody chose a target with the exact level for V1 and V3. We can conclude that the variations of these variables on the form are easy to perceive. The indicator shows that there is a big variability between the subjects for V4 (height of the point controlling the form of the glass) for example. The differences are not perceptible in the same way for all variables. It can be because people didn’t see the different levels of this variable, the choice of the levels being under the just noticeable difference.
We noticed differences in the influence of the variables on the perception of the form by the subjects. A score/weight of influence can be associated to each variable, depending on the results of Tab.1. We propose to weight the importance of the variables in the perception by the coefficient 1/σj. A perceptive distance can be proposed, which will be used in the next section.
Test 3: “elegant” glass task
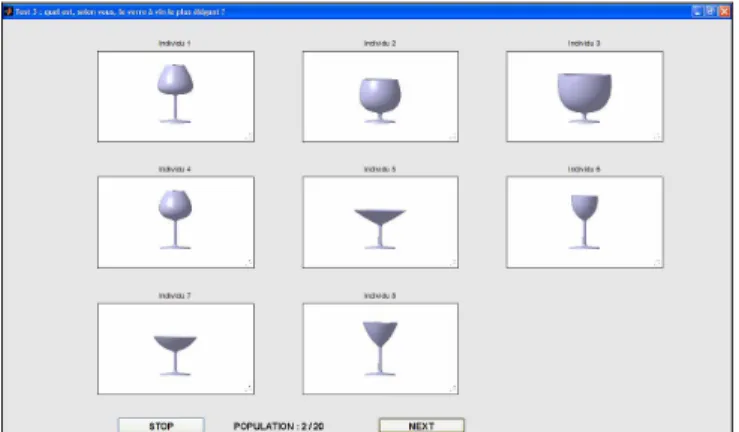
In this test, no target is shown anymore. The task of the subject is to select the most “elegant” wine glass, according to his/her personal opinion. A maximum of 20 iterations is proposed. At the end of the process, the subject has to select one glass, and to give a rating of this glass on a scale from 0 (not at all elegant) to 10 (perfectly elegant). In the same way than for the previous tests, the subject may stop the process and make his/her single final choice before the 20th iteration. The interface of the test is presented on Fig.7.
V1 V2 V3 V4 V5 V1 V2 V3 V4 V5
Figure 7 SCREENSHOT OF THE INTERFACE OF TEST 3,
FOR THE SELECTION OF THE MOST “ELEGANT” WINE GLASS.
The aim of test 3 is to:
- know in which extent the process converges toward a satisfying glass for the subjects, - know if design trends, concerning the “elegance”
of a glass”, can be extracted from the results of the test. In other words, the problem is to uncover relevant information about the “elegance”, if any, concerning the design variables of the form,
- estimate the variability of the results concerning the semantic dimension “elegance”, and to show how to use this information for product design
Results
Among the 20 subjects, 8 stopped the test before the 20th generation, giving a mark of 10/10 to the selected product. We conclude that these 8 subjects were perfectly satisfied of their choice.
For the 12 other subjects, the average satisfaction score of their chosen glass is 8.3/10. This relatively high score and the low standard deviation let us think that the subjects found satisfying glasses, and that 20 generations are sufficient to converge toward the desired product.
Concerning the “final” glass chosen by the subjects, the results show that only 2 subjects chose exactly the same glass. A great diversity in the final glass was noticed, that could be estimated by an analysis of the matrix X of the subjects final choice, with subject i in row (i = 1 to 20) and the value of the variable j in column (j = 1 to 5).
Univariate analysis
Let us focus first on an univariate analysis of the matrix X. We noticed that for each variable, the 5 possible levels are present in matrix X. To estimate the variability of the choices of the subjects, for each variable, the following standard deviation σ’j was computed:
σ
j '=
1
S
(rank v
ij−
rank v
_ j)
2 i=1 S∑
(7)where S: number of subjects
rankvij: rank of the level of variable Vj, chosen by subject i
rank v
j=
rankv
ij i=1S
∑
average rank of the variableVj, for all the subjects.
This standard deviation σ’j estimates, for each variable, the degree of consensus of the subjects (e.g. σ’j = 0 if all the subjects chose the same level for the variable Vj). The results are given in Tab.2.
Table 2. VALUE OF THE STANDARD DEVIATION OF EACH VARIABLE, FOR THE FINAL PRODUCT SELECTED BY THE SUBJECTS.
V1 V2 V3 V4 V5
σ'j 1.27 1.19 1.18 1.48 1.28
The results show that no variable is subjected to a great consensus concerning the “elegance” of the glass: the variability is of the same order for each variable, and no particular level can be considered as representative of the “elegance”.
Multivariate analysis
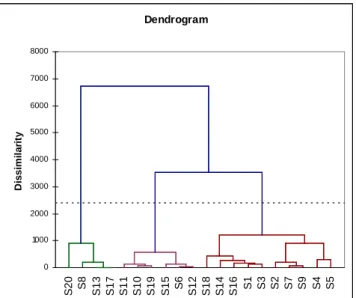
In order to provide a partition of the glasses and to define groups, similar from a perceptual point of view, a hierarchical ascendant classification (HAC) [25] has been done on matrix
X.
The principle of HAC is to build a hierarchical tree (dendrogram, Fig.8), which shows the level of each aggregation according to the dissimilarity between the products. The parameters of the method are the definition of the distance for computing the dissimilarities, and the linkage rule. The choice of the distance is not an easy task and several distances can be proposed. Nevertheless, given that our goal is to cluster the glasses according to a “perceptive dissimilarity”, we decided to take into account the results of test 2 for the definition of the distance. We assume that the importance of the variables Vi (i = 1 to 5) in the perception is inversely proportional to the standard deviation given in Tab.2. We chose as distance in the HAC a weighed Euclidian distance, with weights for each variable equal to 1/σj, and the Ward’s criterion as the linkage rule. The corresponding dendrogram is given Fig.8.
Dendrogram S 5 S 4 S 9 S 7 S 2 S 3 S 1 S 1 6 S 1 4 S 1 8 S 1 2 S 6 S 1 5 S 1 9 S 1 0 S 1 1 S 1 7 S 1 3 S 8 S 2 0 0 1000 2000 3000 4000 5000 6000 7000 8000 D is s im il a ri ty
Figure 8 DENDROGRAM OF THE GLASSES OBTAINED
BY HAC.
Three groups can be considered in this dendrogram (high variance jump). The composition of the 3 groups is given in Fig.9 (S13 and S17 chose the same product).
Figure 9 FORMS OF THE DIFFERENT GLASSES IN THE
3 GROUPS.
Figure 9 shows a rather consistent classification (perceptual similarities can be noticed for the glasses of the same group). A more quantitative analysis can be made to understand the groups and to determine the main features which characterize them. Instead of using the V-test for nominal variables (which requires relative strong assumptions concerning the sample size – approximation of the hypergeometric distribution by a Gaussian), we propose to simply compare the abundance of a given modality in a group w.r.t its abundance in the total population [26]. This is given by the following criterion γkij (eqn 8). n n n n j k kj k ij / / =
γ
(8)where nkj: number of products with modality j for variable i in
group k
nk: number of products in group k
nj: number of products with modality j in the population
n: number of products in the population
The computation of this criterion for all the modalities and all the groups may reveal a typology. Table 3 gives, for each group, the modality Vij for which the γkij score is greater than 1.5. A more tangible interpretation, concerning the form of the glass, is also provided.
Table 3. INTERPRETATION OF THE GROUPS OF GLASSES.
group 1 group 2 group3
Over-represented modalities V15 V22 V34 V35 V43 V15 V25 V41 V13 V54 Interpretation of design trends long foot V_shape Large opening long glass long foot flat bottom average foot relative large opening The main result here is that the semantic dimension of “elegance” is more subjective that one can imagine. There are at least 3 “elegance” types among only 20 students and on a total population of 55 glasses.
A company could decide what type of “elegance” it wants for its glasses. That decision cannot be taken by IGA methodology, it is a strategic choice according to the target values of the company.
To terminate the design process, candidates’ glasses can be proposed from the data of this study. Let’s imagine that we wish to provide recommendations to a company that manufactures glasses. In an industrial perspective, it’s of course not reasonable to manufacture as much glasses as ideal glasses provided by the survey (19 in our case). At the opposite, manufacturing only one glass would generate a important dissatisfaction of the customers. This general problem is subjected to several publications in marketing and engineering, and also on the links between these two disciplines [27] [28]. A tradeoff between the costs supported by the company and the dissatisfaction of the customers can be found by maximizing the profit (or the market share), after a modeling of the customer demands and preferences.
This study is of course beyond the scope of this paper. Nevertheless, if we assume that the dissatisfaction of a subject is proportional to the distance of the target glass to its ideal, if
we chose as distance a weighed Euclidian distance, with weights for each variable equal to 1/σj, if we suppose that 3 products have to be designed (3 segments), this can be done by minimizing the global dissatisfaction function w.r.t the design variables of the 3 glasses:
Diss
=
P
ik1
σ
j(vt
kj−
v
ij)
2 j=1 5∑
i=1 S∑
k=1 3∑
(9)where S: number of subjects
σj : standard deviation of variable Vj (cf. test 2)
vtkj: optimization variable (coordinate of the target
product of segment k on variable Vj)
vij: coordinate of the ideal product of consumer i on variable Vj
Pik = 1 if consumer i belongs to segment k, 0 otherwise
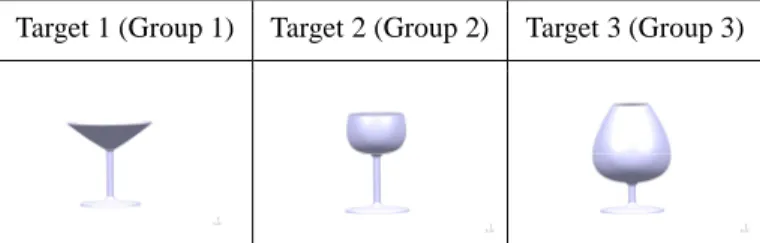
The dissatisfaction function has been optimized with a genetic algorithm. The representation of the three target products is given Fig.10 for information. We noticed that in this case, the segments correspond to the groups of the HAC.
Target 1 (Group 1) Target 2 (Group 2) Target 3 (Group 3)
Figure 10. FORMS OF THE 3 PROPOSED GLASSES, MINIMIZING THE DISSATISFACTION.
One can also observe that the users have to be representative of the company’s target. For example, the target of group 1 is certainly questionable for the form of glass for wine.
This test has of course to be considered as a pilot study, the number of subjects being weak, and the product relatively simple. This test allows the description of the method and of the statistical data analysis, which will be used on a more substantial study with a more complex product (car dashboard).
CONCLUSION
In this paper, we described the general process for detecting design trends using Interactive Genetic Algorithms and user-tests. These tests are used to enhance innovation and to understand which design features are representative of a given semantic dimension.
We described first the mechanism of the IGA implemented. Second, to study the convergence of IGA, we defined problems of different size, according to the number of design variables and their corresponding levels. In order to adjust the tuning parameters of the IGA, the fitness evaluation of the IGA has been simulated using computed distances to a given predefined target. This paper showed the process of simulated evaluations and the results of the most suitable values of the
input parameters of the IGAs. The process gave also the size of the design problem which can be reasonably addressed, for expecting convergence in a number of generations adapted to interactive user-tests (5 variables with 5 levels). Given that the IGAs must be used in perceptual tests, a relatively small number of generations (<20) must be proposed, so as to not fatigue the user. Perceptual tests with 20 subjects were realized to demonstrate the validity of the approach and the analysis of the results. Two goal-seeking tests were carried out and give an estimation of the convergence abilities of the IGA, and reveal also the problem of just noticeable differences for the perception of forms. A last study on the semantic dimensions “elegant” of a table glass was realized, to show how the results can be analyzed and how to deal with inter-individual differences among users.
A strong point of our study concerns the interfacing of the IGA with a parametric digital modeller (CATIA). The interface is functional, the computation time for updating the model is reasonable (less than 8 seconds between 2 generations for the case of the table glass). The interface with the CAD software is a significant advantage: with our system, it is possible to apply the IGA to a wide variety of products, defined by a parameterized model. The setting up of a study is fast and requires only the definition of a CAD model.
This works belong to a more consequent project concerning innovation in the car industry, in particular for dashboards. Studies are in progress to estimate how such complex products can be assessed with IGA, and how design features, representative of a particular semantic dimension of the design brief, can be extracted from user-tests.
The perspectives of this work are to test different settings of the algorithm. For example, the way to select the parents is typical from MOGA. The NSGA (Non-dominated Sorting Genetic Algorithm), which do not require each individual to be parent, could be tested. In the same way, different changes in the definition of mutation could be tested (restrict the mutation to the neighbouring elements). We envisage also to work on the definition of a perceptive distance for the analysis of the results.
Concerning the analysis of the results of the tests, we are going to work on the use of generalized symbolic marking for the interpretation of classes in clustering, and also to use the information concerning the glass shown, but not chosen by the subjects.
ACKNOWLEDGMENTS
Acknowledgments to the students of the Marketing Design class of Ecole Centrale de Nantes for their help in the realization of the tests.
REFERENCES
[1] Bloch P. Seeking the ideal form: Product Design and Consumer Response. Journal of Marketing, 56(3), pp 16-29.
[2] Krippendorff K. and Butter R. “Product semantics: Exploring the symbolic qualities of form” The Journal of the Industrial Designers Society of America, Spring, 1984, pp.4-9. [3] Hsu S.H., Chuang M.C., Chang C.C., 2000. A semantic differential study of designers’ and users’ product form perception. International Journal of Industrial Ergonomics 25, 375-391.
[4] Hsiao S.W., 2002. Concurrent design method for developing a new product International Journal of Industrial Ergonomics 29, 41-55.
[5] Orsborn, S., Boatwright, P., and Cagan, J., 2009, “Quantifying Aesthetic Form Preference in a Utility Function,” ASME J. Mech. Des., 131,6, p. 061001
[6] MacDonald, E., Lubensky, A., Sohns, B. and Papalambros, P.Y.,
2009, "Product Semantics in Wine Portfolio
Optimization," International Journal of Product Development, 7(1/2), pp. 73-98.
[7] Nagamachi M. (1995). Kansei engineering: a new ergonomic consumer-oriented technology for product development. International Journal of Industrial Ergonomics, 15, 3-11.
[8] Yoshida, S., Aoyama, H. Basic study on trend prediction for style design. DETC2008-49574. 2008 ASME International Design Engineering Technical Conferences, Brooklyn, New York, USA.
[9] Lewis K., Chen W., Schmidt L., eds, Decision making in Engineering Design, ASME Press, 2006.
[10] Yannou B., Dihlmann M., Awedikian R. Evolutive design of car silhouettes. DETC2008-49439. Proceedings of IDETC/CIE 2008, August 2008, Brooklyn, NY, USA
[11] Ren Y., Papalambros P. Y. Design preference elicitation, derivative-free optimization and support vector machine search. DETC2010-28. Proceedings of IDETC/CIE 2010, August 2010, Montreal, Quebec, Canada.
[12] H. Takagi, Interactive evolutionary computation: fusion of the capabilities of EC computation and human evaluations, Proceedings of the IEEE 89 (9) (2001) 1275–1296.
[13] Gu Z., Tang M.X., Frazer J.H. Capturing aesthetics intention during interactive evolution. Computer Aided Design 38 (2006), 224-237.
[14] Hee-Su Kim, Sung-Bae Cho. Engineering Application of interactive genetic algorithm to fashion design. Applications of Artificial Intelligence 13 (2000) 635-644.
[15] Brintrup A.M., Ramsden J., Tiwari A.,An interactive genetic algorithm-based framework for handling qualitative criteria in design optimization
[16] E. Poirson, J-F. Petiot, T. Leroy, E. Aliouat, L. Boivin, D. Blumenthal. Intégration d'évaluations clients pour favoriser l'innovation - Application au design de planches de bord
automobile. Proceedings of CONFERE’09 - 02 – 03 juillet 2009, Marrakech, MAROC.
[17] E. Poirson, J-F. Petiot, E.Aliouat, L. Boivin and D. Blumenthal. Interactive user tests to Enhance innovation ; application to car Dasboard Design. International conference on kansei engineering and emotion research KEER2010, PARIS, March 2-4, 2010.
[18] Poirson E., Petiot J-F., Aliouat E., Boivin L. and Blumenthal D. Study of the convergence of Interactive Genetic Algorithm in iterative user’s tests: application to car dashboard design. Proceedings of IDMME - Virtual Concept 2010 Bordeaux, France, October 20 – 22, 2010.
[19] Goldberg, D.E., Genetic Algorithms in search,
optimization & machine learning, Addison-Wesley Publishing
Company, 1989.
[20] Kelly J., Papalambros P., Wakefield G. « The Development of a Tool for the Preference Assessment of the Visual Aesthetics of an Object Using Interactive Genetic Algorithms » 9th Generative Art Conference GA2005
[21] Kelly J. Interactive genetic algorithms for shape preference assessment in engineering design. PhD Thesis, University of Michigan, 2008.
[22] Qian L., Ben-Arieh D. Joint pricing and platform configuration in product family design with genetic algorithm. DETC2009-86110. Proceedings of IDETC/CIE 2009, August 2009, San Diego, CA, USA .
[23] Poles S., Rigoni E. and Robic T. MOGA-II performance on noisy optimization problems. Proceedings of the International Conference on Bioinspired Optimization Methods and their Applications, pp. 51–62. Jozef Stefan Institute, Ljubljana, 2004.
[24] Kelly, J., Papalambros, P. Y., and Seifert, C. M., "Interactive Genetic Algorithms for Use as Creativity Enhancement Tools", the Proceedings of the AAAI Spring Symposium, Stanford, CA, March 26-28, 2008, pp. 34-39. [25] Hair J.F., Tatham R.L., Anderson R.E., Black W. Multivariate Data Analysis (5th Edition), Prentice Hall, 1998. [26] Giordano G., Gettler-Summa M., Verde R. Symbolic interpretation in a clustering strategy on multiattribute preference data. In Statistica Applicata, pp 473-495, 2000. [27] Michalek J., Ceryan O., Papalambros P.Y., Koren Y. Balancing Marketing and Manufacturing Objectives in Product Line Design. J. Mech. Des. 128, 1196 (2006).
[28] Wassenaar H.J., Chen W. An Approach to Decision-Based Design With Discrete Choice Analysis for Demand Modeling.