HAL Id: hal-01286555
https://hal.archives-ouvertes.fr/hal-01286555
Submitted on 26 Sep 2017
HAL is a multi-disciplinary open access
archive for the deposit and dissemination of
sci-entific research documents, whether they are
pub-lished or not. The documents may come from
teaching and research institutions in France or
abroad, or from public or private research centers.
L’archive ouverte pluridisciplinaire HAL, est
destinée au dépôt et à la diffusion de documents
scientifiques de niveau recherche, publiés ou non,
émanant des établissements d’enseignement et de
recherche français ou étrangers, des laboratoires
publics ou privés.
the anatomical fat location
Florence Gondret, Annie Vincent, Magalie Houée-Bigot, Anne Siegel,
Sandrine Lagarrigue, David Causeur, Isabelle Louveau
To cite this version:
Florence Gondret, Annie Vincent, Magalie Houée-Bigot, Anne Siegel, Sandrine Lagarrigue, et al..
Molecular alterations induced by a high-fat high-fiber diet in porcine adipose tissues: variations
according to the anatomical fat location. BMC Genomics, BioMed Central, 2016, 17 (1), pp.120.
�10.1186/s12864-016-2438-3�. �hal-01286555�
R E S E A R C H A R T I C L E
Open Access
Molecular alterations induced by a high-fat
high-fiber diet in porcine adipose tissues:
variations according to the anatomical fat
location
Florence Gondret
1,2*, Annie Vincent
1,2, Magalie Houée-Bigot
3, Anne Siegel
4, Sandrine Lagarrigue
1,2,
Isabelle Louveau
1,2and David Causeur
3Abstract
Background: Changing the energy and nutrient source for growing animals may be an effective way of limiting adipose tissue expansion, a response which may depend on the genetic background of the animals. This study aims to describe the transcriptional modulations present in the adipose tissues of two pig lines divergently selected for residual feed intake which were either fed a high-fat high-fiber (HF) diet or an isocaloric low-fat high-starch diet (LF).
Results: Transcriptomic analysis using a porcine microarray was performed on 48 pigs (n = 12 per diet and per line) in both perirenal (PRAT) and subcutaneous (SCAT) adipose tissues. There was no interaction between diet and line on either adiposity or transcriptional profiles, so that the diet effect was inferred independently of the line. Irrespective of line, the relative weights of the two fat depots were lower in HF pigs than in LF pigs after 58 days on dietary treatment. In the two adipose tissues, the most apparent effect of the HF diet was the down-regulation of several genes associated with the ubiquitin-proteasome system, which therefore may be associated with dietary-induced modulations in genes acting in apoptotic and cell cycle regulatory pathways. Genes involved in glucose metabolic processes were also down-regulated by the HF diet, with no significant variation or decreased expression of important lipid-related genes such as the low-density lipoprotein receptor and leptin in the two fat pads. The master regulators of glucose and fatty acid homeostasis SREBF1 and MLXIPL, and peroxisome proliferator-activated receptor (PPAR)δ and its heterodimeric partner RXRA were down-regulated by the HF diet. PPARγ which has pleiotropic functions including lipid metabolism and adipocyte differentiation, was however up-regulated by this diet in PRAT and SCAT. Dietary-related modulations in the expression of genes associated with immunity and inflammation were mainly revealed in PRAT.
Conclusion: A high-fat high-fiber diet depressed glucose and lipid anabolic molecular pathways, thus counteracting adipose tissue expansion. Interaction effects between dietary intake of fiber and lipids on gene expression may modulate innate immunity and inflammation, a response which is of interest with regard to chronic inflammation and its adverse effects on health and performance.
Keywords: Adipose tissue, Dietary fiber, High-fat diet, Gene module, Multiple factor analysis, Transcriptome, Upstream regulators
* Correspondence:Florence.gondret@rennes.inra.fr
1INRA, UMR1348 Pegase, F-35590 Saint-Gilles, France 2Agrocampus-Ouest, UMR1348 Pegase, F-35000 Rennes, France
Full list of author information is available at the end of the article
© 2016 Gondret et al. Open Access This article is distributed under the terms of the Creative Commons Attribution 4.0 International License (http://creativecommons.org/licenses/by/4.0/), which permits unrestricted use, distribution, and reproduction in any medium, provided you give appropriate credit to the original author(s) and the source, provide a link to the Creative Commons license, and indicate if changes were made. The Creative Commons Public Domain Dedication waiver (http://creativecommons.org/publicdomain/zero/1.0/) applies to the data made available in this article, unless otherwise stated.
Background
White adipose tissue (AT) has a central role in various physiological processes related to lipid metabolism and energy homeostasis in mammals [1, 2] and is considered to be a significant contributor to systemic low-grade in-flammation [3]. Adipose tissue development is triggered by the imbalance between energy intake and expenditure and most related studies have exploited high-fat hyper-caloric diets to generate adipose tissue expansion and document molecular alterations [4–6]. The nutrient source is also important in determining adiposity. Noticeably, dietary fibers, which are poorly digested by monogastric animals, are associated with energy dilution of the diet, hence reducing the adiposity that accompan-ies the chronic intake of high levels of fat [7, 8]. This re-duction results from a lower food intake, enhanced insulin sensitivity, increased energy expenditure, and changes in expression levels of some genes involved in lipid anabolism and fatty acid β-oxidation, in different organs [7, 9]. However, the diversity in molecular path-ways in AT which can be altered by a high-fat high-fiber diet remains still to be clarified, together with the ways by which these changes relate to adiposity variations. The pig is recognized as an experimental model to in-vestigate genetic and mechanistic aspects of human dis-ease such as obesity [10–12], and is a leading source of animal protein in human diets. The introduction of more fiber to cereal-based diets formulated for pigs has regained interest due to both economic considerations and the potential benefits on health and welfare [13]. While, the addition of fat to a fiber-rich diet is also re-quired to retain a dietary energy value compatible with good animal performance [14]. Therefore, the primary objective of this study was to decipher the transcrip-tomic changes that take place in AT when pigs received either a high-fat high-fiber diet or an isocaloric low-fat high-starch diet, thus changing energy source and nutri-ents rather than energy content in diet. The availability of pig lines divergently selected for residual feed intake (RFI), a measure of feed efficiency, offers an additional opportunity to consider line-associated differences in basal metabolism and energy expenditure [15, 16] when reasoning body composition and dietary responses. Both independent and possible interaction effects between diet and line on the AT transcriptional profiles have then to be considered.
The anatomical location of AT is also important when analyzing the molecular responses to diet. In many species [17, 18] including pigs [19, 20], differences in adipogenic factors, responses to hormones, metabolic properties or secretion of inflammatory cytokines have been observed between subcutaneous AT and visceral ATs which are located within the abdominal cavity. Whereas subcutaneous fat grows at the same rate as
total body fat, perirenal (visceral) fat grows faster in pigs; thus, the distinction between these two anatomical fat sites is also economically important. Hence, similarities and particularities in the molecular responses to diet of subcutaneous and perivisceral ATs are worthy of investi-gation. It has recently been shown that AT expansion was reduced at the subcutaneous and perirenal locations when growing pigs of two divergent RFI lines were fed a high-fat high-fiber diet as compared with pigs fed an isocaloric low-fat high-starch diet [21]. Molecular mech-anisms and processes associated with both diet and line in the dorsal subcutaneous and perirenal ATs are ex-plored in the present study. Pathways common to both ATs and also specificities within each AT in the re-sponses to diet, are highlighted using dedicated inte-grated statistical methods.
Results
Summary of phenotypic data
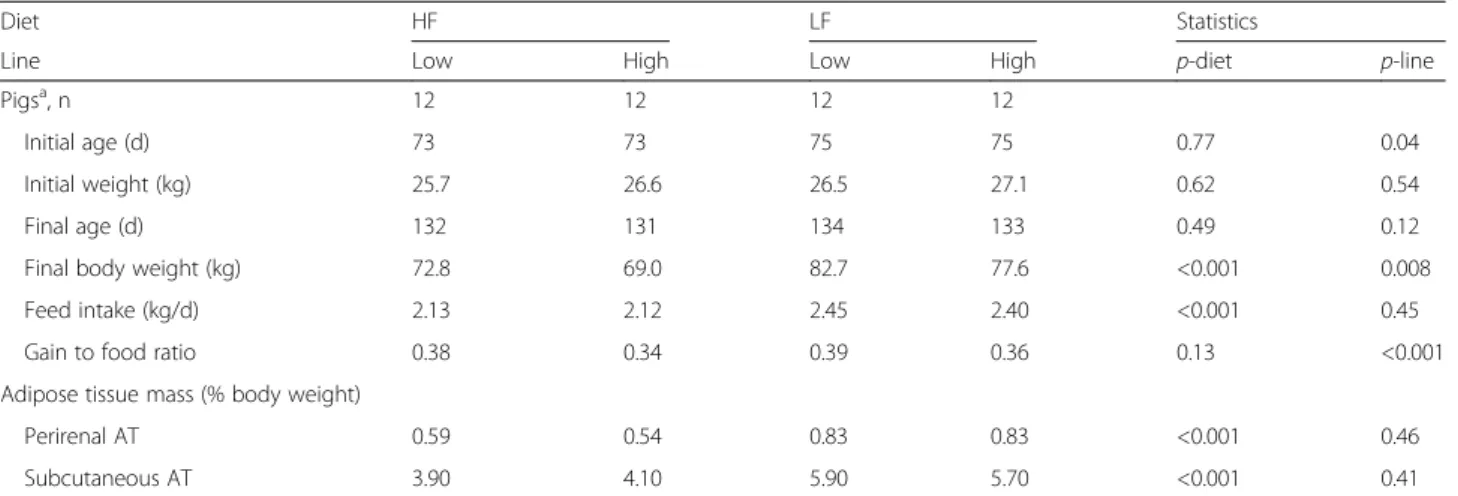
Forty-eight growing pigs of two lines divergently selected on RFI, a measure of feed efficiency, were fed diets for-mulated at isocaloric and isoproteic bases but differing in energy source and nutrients (lipids and fibers vs. starch). Full description of performance of experimental pigs (n = 12 per line and per diet) after 58 days of dietary treatment can be found in an associated paper [21] and are briefly summarized here. Importantly, there was no interaction between diet and line on performance and body composition. Irrespective of RFI line, pigs fed the high-fat high-fiber (HF) diet ate 12 % less (p < 0.001) than pigs fed the low-fat low-fiber starch-based (LF) diet during the trial and they developed less body fat, as illustrated by 1.4-fold lower proportions of ATs at the perirenal (%PRAT) and dorsal subcutaneous (%SCAT) locations. The differences between diets were significant when the adiposity data was corrected for individual daily feed intake, indicating that AT development was triggered not only by differences in feed intake between pigs but also by the nutrient composition. Irrespective of diet, divergent selection for RFI did not affect AT weights in this experiment (Table 1).
Diet markedly affected adipose tissue molecular profiles
Microarray analyses were separately performed in PRAT and in SCAT from the 48 experimental pigs. After normalization, the signal intensity was found to be above background noise for 38,142 spots in PRAT and 38,987 spots in SCAT, respectively. The linear model to analyze the log2-transformed signals revealed no significant interaction (p > 0.01) between diet and line on the ex-pression levels of the molecular probes in the two ATs, so that diet and line effects could be inferred independ-ently. The global effects of diet and of line on the num-ber of differentially-expressed probes (DEP) were more
pronounced in PRAT than in SCAT (Fig. 1). In the two ATs, diet had also a more pronounced effect on the tran-scriptome than did the line. Thus, only data related to dietary effects are further considered in this manuscript. By using cut-offs of fold-change between diets > |1.1| and p-value < 0.01, while ensuring Benjamini-Hochberg (BH) multiplicity correction of the p-values for a control of the FDR at level < 0.08, a total of 3,313 DEP in PRAT
and of 2,107 DEP in SCAT were found as over-expressed by HF diet. These corresponded to 1,251 unique differentially-genes (DEG) up-regulated in PRAT and to 825 unique DEG up-regulated in SCAT. Con-versely, 4,820 DEP corresponding to 2,440 unique DEG in PRAT, and 2,689 DEP corresponding to 1,279 unique DEG in SCAT were under-expressed by HF diet. Altogether, 1,330 DEG were commonly affected by diet across the two ATs (Fig. 1), which corresponded to 36 % of the DEG in PRAT and 63 % of the DEG in SCAT, respectively.
Similarities in the molecular responses to diet across two adipose tissues
Multiple Factor Analysis (MFA) was performed to derive a common framework of molecular responses to diet and identify the communalities across AT. The basic interest of MFA as a data integration procedure [22] was to ensure that each tissue influence was equally weighed in a manageable number of comprised factors, which can then be related to external phenotypic characteris-tics. Figure 2 shows the diagnostic MFA plot. The first dimension (Dim1) of the MFA accounted for 31 % of the variation, and correlated significantly to variations in AT weights (r = 0.78 with %PRAT, and r = 0.76 with %SCAT, p < 0.001), so that pigs fed the HF diet and pigs fed the LF diet were oppositely represented along Dim1. The second dimension of the MFA (Dim2) explained 8.2 % of the variation and did not clearly separate the data ac-cording to diet or adiposity phenotypic traits.
As illustrated (Fig. 2), the two first comprised variables synthesizing the molecular information of the originally-distinct data tables (dim_1_PRAT and dim_1_SCAT, re-spectively) were projected together along Dim1 in the MFA plot. This means that large similarities between
Table 1 Growth and adiposity as affected by diet and line
Diet HF LF Statistics
Line Low High Low High p-diet p-line
Pigsa, n 12 12 12 12
Initial age (d) 73 73 75 75 0.77 0.04 Initial weight (kg) 25.7 26.6 26.5 27.1 0.62 0.54 Final age (d) 132 131 134 133 0.49 0.12 Final body weight (kg) 72.8 69.0 82.7 77.6 <0.001 0.008 Feed intake (kg/d) 2.13 2.12 2.45 2.40 <0.001 0.45 Gain to food ratio 0.38 0.34 0.39 0.36 0.13 <0.001 Adipose tissue mass (% body weight)
Perirenal AT 0.59 0.54 0.83 0.83 <0.001 0.46 Subcutaneous AT 3.90 4.10 5.90 5.70 <0.001 0.41
a
Pigs were fed a high-fat high-fiber diet (HF) or a low-fat high-starch diet (LF). Duration of the feeding trial was 58.5 ± 0.5 days for all pigs. Two divergent pig lines that have been selected over eight generations for residual feed intake (RFI), a measure of feed efficiency, were used. Pigs selected for low RFI were the most efficient in the conversion of food to weight gain. There was no significant interaction (p > 0.10) between diet and line on performance and adiposity traits. At the end of the trial, weights of perirenal and dorsal subcutaneous adipose tissues (AT) were used as surrogates of body adiposity
Fig 1 Number of differentially-expressed probes and corresponding unique genes in adipose tissues as affected by diet and line. Microarray data obtained in subcutaneous (SCAT) or in perirenal (PRAT) adipose tissues were separately analyzed for the main effects of diet (HF: high-fat high-fiber vs. LF: low-fat high-starch), line (low RFI: residual feed intake below the average; high RFI: residual feed intake above the average), and the interaction between diet and line. Molecular probes were declared as differentially-expressed between diets or between lines according to cutoffs for fold-change between conditions > |1.1| andp < 0.01 (Benjamin-Hochberg adjusted p-value < 0.08). Venn diagrams illustrate the number of differentially-expressed probes in each experimental group for SCAT and for PRAT. The corresponding number of differentially-expressed unique genes is indicated into brackets
ATs could be inferred by focusing on the DEP that con-tributed mainly to Dim1. A total of 1,128 DEP showing the highest correlation with Dim1 (r > |0.70|; p < 0.001) were thus commonly regulated by diet across the two ATs. The identity of these DEP together with their fold-changes between HF and LF diets are listed in Additional file 1: Table S1 for PRAT and for SCAT, respectively; as indicated in this additional file, all these DEP were altered by diet (BH adjusted p-value < 0.05 in PRAT and BH adjusted p-value < 0.08 in SCAT). They cor-responded to 436 unique differentially-expressed genes (DEG). This statistical approach was thus useful in redu-cing the number of DEG commonly regulated by diet across the two ATs to those having the strongest correl-ation with varicorrel-ations in AT weights.
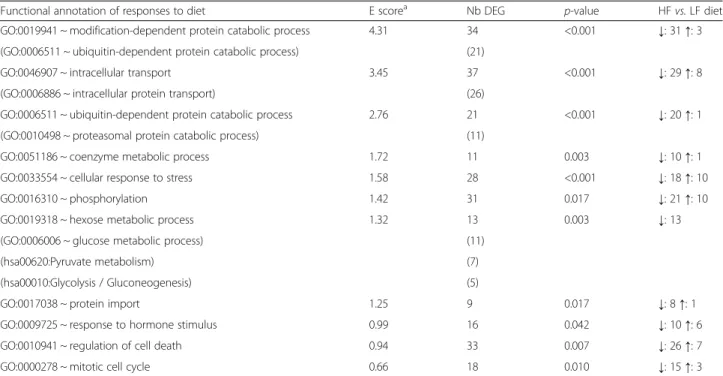
A functional analysis was performed to understand the biological meaning behind this subset of 436 DEG, by using automatic functional annotation tools to identify biological gene ontology (GO) terms and clustering re-dundant annotation terms in enriched biological path-ways. Enrichment (E) score≥ 1.3 and p-value < 0.5 were used to select the top-enriched clusters among these DEG. As indicated in Table 2, the modification-dependent protein catabolic process, intracellular pro-tein transport, coenzyme metabolic process, cellular response to stress, phosphorus metabolic process and hexose metabolic process were the top-enriched bio-logical pathways in the common molecular responses of ATs to diet. The detailed list of genes included in these clusters can be found in Additional file 2: Table S2. To have details on fold-change of these genes between diets, one may also consult Additional file 1: Table S1.
Among protein catabolic process, the ubiquitin-dependent proteolysis was the most represented pathway with a total of 20 genes encoding ubiquitin-conjugating enzymes, different ubiquitin ligases, vari-ous ubiquitin-like proteins and different proteasome complex subunits responsible for the degradation of polyubiquitinated proteins, which were down-regulated by the HF diet (Table 2). Similarly, the glucose metabolic process assembled 13 genes, all down-regulated by the HF diet, and coding for en-zymes acting in the first step of glucose use (HK2), catalyzing glycogen synthesis (GSK3B, GYS2, UGP2)
or linking glycolysis and tricarboxylic acid cycle (PDK1, PDHA1, PDHA2, DLAT). Different factors in coenzyme metabolic processes such as those related to the synthesis of cytosolic acetyl-CoA (ACLY) and lipid anabolic process (ME1, HMGCR) were also all down-regulated by the HF diet, with the noticeable exception of glutathione S-transferase kappa 1 (GSTK1) which functions in cellular detoxification. Conversely, cellular responses to stress included some genes up-regulated in the HF diet (e.g.; IFI16 and JMY, two genes known to interact with p53 in regulating cell cycle pro-gression) as well as genes that were down-regulated by the same diet (e.g.; CDKN1A, another regulator of cell cycle progression). Other gene groups with a lower enrichment score (E < 1.3) but p < 0.05 could be also regarded as po-tentially interesting in deciphering the molecular mecha-nisms modulated by the diet, i.e. the response to hormone stimulus, regulation of cell death and cell mitotic process (Table 2). Indeed, although dietary-modulated transcripts in ATs were not primarily enriched in lipid metabolism, individual genes clustered in the response to hormone stimulus had known relationships with lipid metabolic process: the cytosolic enzyme malic enzyme (ME1) that generates NADPH for fatty acid biosynthesis and which was down-regulated > 2 fold (BH-p value < 0.01) by the HF diet, the leptin (LEP) coding for a protein secreted in ATs to regulate food intake and energy expenditure and which exhibited > 1.5-fold reduction in its expression level in HF pigs (BH-p value < 0.001), the low-density lipopro-tein receptor (LDLR) reduced by > 1.4-fold (BH-p < 0.001) by HF diet, and the adiponectin receptor (ADIPOR2) that mediates lipid oxidation and was also significantly lowered (BH-corrected p < 0.001) for pigs fed the HF diet. Conversely, IGF1R coding for the insulin-growth factor 1 receptor binding IGF-I, a well-known regu-lator of cell development, and which was first listed in the significantly-enriched phosphorus metabolic process, was also included in the less enriched clus-ters corresponding to the response to hormone stimulus and the regulation of cell death; this gene was one of the top genes being up-regulated by HF diet. Altogether, different genes were thus listed in more than one of these pathways, suggesting that these various biological processes were at least in part, inter-connected.
(See figure on previous page.)
Fig 2 Multi-way datasets analysis: consensus in microarray data relative to dietary effect across two adipose tissues. The first two synthetic variables obtained for the perirenal (Dim_1_PRAT) and subcutaneous adipose tissue (Dim_1_SCAT) transcriptomes were projected in the correlation circle of the multiple factor analysis (MFA), an integrated statistical method used to reveal communalities across separate datasets. Large similarities across adipose tissues can be deduced from molecular variables contributing to the first dimension (Dim1) of MFA (Fig. 1a). Relative weights of perirenal fat (%PRAT) and subcutaneous fat (%SCAT) were superimposed on the plot, showing strong correlation between the molecular probes contributing to Dim1 and adiposity variations. Pigs were represented on the scatter MFA plot (Fig. 1b) and colored following the diet they received (HF: high-fat high-fiber; LF: low-fat high-starch). This shows a well-defined partition of pigs between diets along Dim1
Particularities of perirenal adipose tissue response to diet
To provide another representation of the transcriptional changes in ATs response to diet, the Weighed Gene Cor-relation Network Analysis (WGCNA) was used to cap-ture strong relationships between transcripts in modules of interconnected genes [23]. In each module, the eigen-gene (the weighed mean of the transcripts providing the best univariate summary of the within-module variabil-ity) was calculated to relate transcriptional changes to external phenotypic traits and to deduce the biological meaning of the module. Four distinct network modules were thus obtained (Table 3).
The first two big modules represented 48 % and 20 % of the DEP, respectively. The first module (turquoise)
included a higher number of DEP from PRAT than from SCAT, and the second one (blue) had almost an equal number of DEP from the two adipose tissues. Eigengenes in the turquoise and blue modules were highly corre-lated to the first comprised dimension Dim1 in MFA (data not shown), suggesting that these modules in-cluded not much more supplementary biological mean-ing than that deduced from Dim1. Two smaller network modules represented 11 % and 7 % of the DEP data set, respectively. The brown module corresponded mainly to a co-expression network in DEP from SCAT; however, most of these DEP were also found in PRAT including gene transcripts related to protein catabolic process, protein transport, pyruvate metabolism and cell respir-ation. The pattern of expression in the yellow module was mainly assigned to PRAT; only 4 % of the DEP in this module were also listed as differentially-expressed in SCAT in response to diet. In addition, the eigengene of this yellow module was not highly correlated with %PRAT (r =−0.25; p = 0.09), suggesting that molecular mechanisms unrelated to adipose expansion were pre-dominant in this module. Thus, biological particularities at the PRAT location in the dietary-associated responses can be revealed by further examining the interconnected genes in the yellow module.
A total of 973 DEP corresponding to 411 unique DEG were listed in the yellow module. Most of the DEP (969 out of 973) were up-regulated by the HF diet (see
Table 3 Co-expressed gene networks in adipose tissues in response to diet
Inter-dependent modules
Number of DEP in each module
Total Of PRAT Of SCAT Turquoisea 6,720 5,302 1,418 Blue 2,738 1,416 1,322 Brown 1,238 79 1,159 Yellow 973 931 42
a
Five co-expressed gene network modules were deduced from the dataset of differentially-expressed probes (DEP) in response to diet (high-fat high-fibervs. low-fat high starch) and obtained in perirenal (PRAT) and subcutaneous (SCAT) adipose tissues. The total number of DEP included within each module and the number of DEP from each tissue in the module were indicated
Table 2 Enriched biological processes commonly regulated by diet across adipose tissues
Functional annotation of responses to diet E scorea Nb DEG p-value HFvs. LF diet GO:0019941 ~ modification-dependent protein catabolic process 4.31 34 <0.001 ↓: 31 ↑: 3 (GO:0006511 ~ ubiquitin-dependent protein catabolic process) (21)
GO:0046907 ~ intracellular transport 3.45 37 <0.001 ↓: 29 ↑: 8 (GO:0006886 ~ intracellular protein transport) (26)
GO:0006511 ~ ubiquitin-dependent protein catabolic process 2.76 21 <0.001 ↓: 20 ↑: 1 (GO:0010498 ~ proteasomal protein catabolic process) (11)
GO:0051186 ~ coenzyme metabolic process 1.72 11 0.003 ↓: 10 ↑: 1 GO:0033554 ~ cellular response to stress 1.58 28 <0.001 ↓: 18 ↑: 10 GO:0016310 ~ phosphorylation 1.42 31 0.017 ↓: 21 ↑: 10 GO:0019318 ~ hexose metabolic process 1.32 13 0.003 ↓: 13 (GO:0006006 ~ glucose metabolic process) (11)
(hsa00620:Pyruvate metabolism) (7) (hsa00010:Glycolysis / Gluconeogenesis) (5)
GO:0017038 ~ protein import 1.25 9 0.017 ↓: 8 ↑: 1 GO:0009725 ~ response to hormone stimulus 0.99 16 0.042 ↓: 10 ↑: 6 GO:0010941 ~ regulation of cell death 0.94 33 0.007 ↓: 26 ↑: 7 GO:0000278 ~ mitotic cell cycle 0.66 18 0.010 ↓: 15 ↑: 3
a
The most important genes in the common dietary-related responses across perirenal and subcutaneous adipose tissues and correlating with adiposity variations were considered to list enriched functional clusters. For each cluster based on gene ontology (GO) terms for biological processes and Genomes (KEGG) biological pathways, the enrichment (E) score, the number (Nb) of differentially-expressed genes (DEG) and associatedp-value were provided. The direction of changes in gene expression levels by the HF diet was symbolized (↑: up-regulated; ↓: down-regulated) together with the number of unique genes concerned by each change
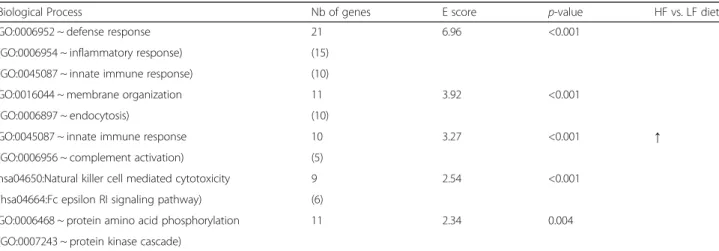
Additional file 3: Table S3). Altogether, 207 DEP corre-sponding to 91 unique DEG, all up-regulated by the HF diet, were highly correlated to the eigengene of the yellow module (r > |0.70|, p < 0.001), so that they could be considered as very relevant for the biological meaning of this module. Functional clustering of these 91 DEG revealed defense response including inflammatory and innate immune responses, membrane organization, natural killer cell mediated cytotoxicity, and protein amino-acid phosphorylation as the top-enriched bio-logical processes (Table 4); the detailed list of genes within each cluster can be found in Additional file 4: Table S4.
Intra-modular connectivity can measure how con-nected a gene is to the other genes of its module. Intra-modular connectivity values pointed the following genes as among the 20 first most important nodes in the yellow module (Table 5): the cytokine interleukin-10 (IL10) and its receptor (IL10RA) which are involved in anti-inflammatory response, three q sub-components of the complement component 1 system (C1QA, C1QB, C1QC) and the cytochrome b-245 (CYBB, CYBA) which are involved in reactions participating to innate immun-ity, arrestin beta-2 (ARRB2) causing specific dampening of cellular responses to stimuli, and a member of the VAV gene family (VAV1) as a natural killer playing role in T-cell and B-cell development.
Upstream regulatory candidates
The two above-described analyses have clearly shown that different biological pathways were involved in re-sponses to diet; therefore, it is important to identify upstream regulators which coordinate these molecular changes in porcine ATs. For this purpose, the transcripts of genes identified as differentially-expressed by diet
Table 4 Biological meaning of co-expressed genes in perirenal adipose tissue of pigs
Biological Process Nb of genes E score p-value HF vs. LF diet GO:0006952 ~ defense response 21 6.96 <0.001
↑ (GO:0006954 ~ inflammatory response) (15)
(GO:0045087 ~ innate immune response) (10)
GO:0016044 ~ membrane organization 11 3.92 <0.001 (GO:0006897 ~ endocytosis) (10)
GO:0045087 ~ innate immune response 10 3.27 <0.001 (GO:0006956 ~ complement activation) (5)
hsa04650:Natural killer cell mediated cytotoxicity 9 2.54 <0.001 (hsa04664:Fc epsilon RI signaling pathway) (6)
GO:0006468 ~ protein amino acid phosphorylation 11 2.34 0.004 (GO:0007243 ~ protein kinase cascade)
a
Unique annotated genes being highly correlated (correlations > |0.70|) to the eigengene of the yellow small module (Table3) were inferred for their gene ontology (GO) terms for biological processes. Functional clusters having enrichment (E) score > 2 and modified Fisher exactp-value less than 0.01 were indicated. All genes were up-regulated (↑) in perirenal adipose tissue when pigs were fed a high-fat high-fiber (HF) diet compared with a low-fat high-starch (LF) diet
Table 5 Most important genes participating to particularities in response to diet of perirenal adipose tissue
Gene symbol Full name Connectivitya
IL10 Interleukin 10 205.8 C1QB Complement component 1, q
subcomponent, B chain
204.9 CYBB Cytochrome b-245, beta polypeptide 201.9 C1QC Complement component 1, q
subcomponent, C chain
201.9 C1QA Complement component 1, q
subcomponent, A chain
199.2 ARRB2 Arrestin, beta 2 195.2 CYTH4 Cytohesin 4 194.8 CYBA Cytochrome b-245, alpha polypeptide 194.7 NCKAP1L NCK-associated protein 1-like 193.9 FCER1G Fc fragment of IgE, high affinity I,
receptor for gamma polypeptide
193.3 VAV1 Vav 1 guanine nucleotide exchange
factor
192.9 FOLR1 Folate receptor 1 191.6 CD53 CD53 molecule 190.9 VSIG4 V-set and immunoglobulin domain
containing 4
190.6 IL10RA Interleukin 10 receptor, alpha 189.2 CFP Complement factor properdin 188.8 VSIG4 V-set and immunoglobulin domain
containing 4
188.2 CADM1 Cell adhesion molecule 1 188.1 NCF4 Neutrophil cytosolic factor 4, 40 kDa 187.8 F13A1 Coagulation factor XIII, A1 polypeptide 187.7
a
The first 20 genes were ranked according to their connectivity value within the yellow module, which assembled a total of 411 unique genes in perirenal adipose tissue, all up-regulated by a high-fat high-fiber diet. The higher is the connectivity value, the stronger is the evidence that the gene is part of the module
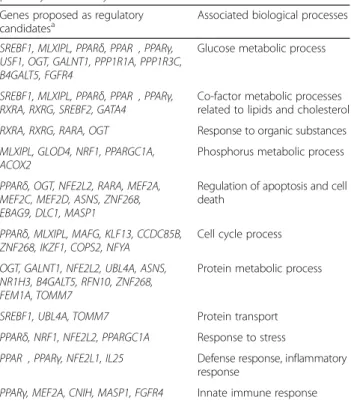
within each AT were submitted to a dedicated algorithm (http://keyregulatorfinder.genouest.org/) which matches the lists of DEP to a causality graph of reactions and reg-ulations built from Transpath® database information, and ranks upstream candidates in accordance to their ability to regulate significant numbers of the DEP. The obtained candidates were listed in Additional file 5: Table S5 for PRAT and in Additional file 6: Table S6 for SCAT. A biological post-prioritization in these candi-dates was manually made by adding GOBP terms. Only a summary of the most relevant candidates was given in Table 6, but more background information on the bio-logical processes in which the candidates may play a role is provided in Additional file 5: TableS5 and Additional file 6: Table S6.
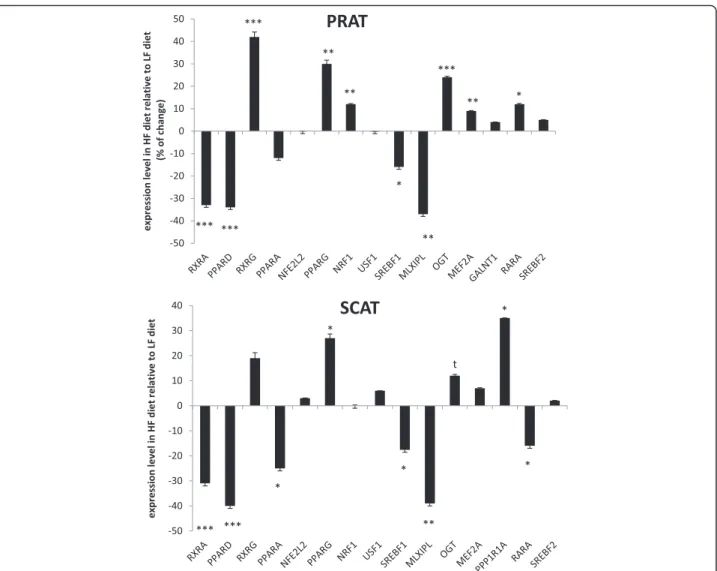
Dietary-related changes in expression levels of 16 genes were studied by qPCR in the 48 samples of PRAT and the 48 samples of SCAT to provide a func-tional validation among the graph driven-hypothesis upstream candidates. In the two ATs, the majority of the examined candidates were significantly affected by diet (Fig. 3).
This included the under-expression by the HF diet of the MLX interacting protein-like MLXIPL (alias ChREBP) and the sterol-regulatory binding protein-1 (SREBF1), two transcriptional factors known to regulate glucose and lipid metabolism. The peroxisome proliferator activated recep-tor delta (PPAR)δ and the retinoic X receprecep-tor alpha RXRA forming heterodimers to bind promoters of target genes in energy metabolism and apoptotic process were also down-regulated by the HF diet in the two ATs; however, PPARα isotype was confirmed as under-expressed (p < 0.05) only in SCAT. PPARγ, the last isotype of the PPAR family having pleiotropic func-tions in lipid metabolism and adipocyte differentiation was conversely up-regulated by the HF diet in the two ATs. It is noteworthy that the direction of change in PPARγ mRNA levels between HF and LF diet by qPCR was inconsistent with the sign of variation pre-dicted by the algorithm (Additional file 5: Table S5), so that PPARγ was regulated by diet in a way oppos-ite to the two other PPAR isotypes. The O-linked N-acetylglucosamine transferase OGT regulating protein ubiquitination and cell death and the protein phos-phatase 1 regulatory subunit 1A (PPP1R1A) known to regulate glycogen metabolism were also confirmed as being up-regulated by the HF diet. Surprisingly, the retinoic acid receptor alpha (RARA) involved in apop-totic process was regulated in an opposite manner be-tween the two ATs. Specificities for PRAT were further enlightened for three upstream candidates that were over-expressed in HF pigs, without any signifi-cant variations in their expression levels compared with LF pigs in SCAT: RXRG involved in mediating the anti-proliferative effects of retinoic acid, the nu-clear respiratory factor NRF1 involved in cell response to stress, and the myocyte enhancer factor MEF2A in-volved in innate immune response. Finally, the rela-tive expression levels of USF1, SREBF2, NEF2L2 and GALNT1 did not differ between diets in the two por-cine ATs. Except for GALNT1 in PRAT and NFE2L2 in SCAT, this was in agreement with microarray data (Additional file 5: Table S5 and Additional file 6: Table S6) which indicated no significant variations in these gene transcripts when pigs were fed HF or LF diets. We observed that sirtuin 1 (SIRT1) was not proposed as an upstream regulatory candidate of the AT transcriptomes, although this gene currently at-tract much attention in the literature; a detailed examination of the list of DEG revealed its up-regulation by the HF diet notably in PRAT (x1.25 fold as compared with LF diet, BH-adjusted p < 0.03).
Discussion
Irrespective of species, there are still a limited number of studies which have deciphered the effects of changing
Table 6 Candidates for upstream regulatory roles in functional pathways altered by diets
Genes proposed as regulatory
candidatesa Associated biological processes
SREBF1, MLXIPL, PPARδ, PPARα, PPARγ, USF1, OGT, GALNT1, PPP1R1A, PPP1R3C, B4GALT5, FGFR4
Glucose metabolic process
SREBF1, MLXIPL, PPARδ, PPARα, PPARγ,
RXRA, RXRG, SREBF2, GATA4 Co-factor metabolic processesrelated to lipids and cholesterol RXRA, RXRG, RARA, OGT Response to organic substances MLXIPL, GLOD4, NRF1, PPARGC1A,
ACOX2 Phosphorus metabolic process PPARδ, OGT, NFE2L2, RARA, MEF2A,
MEF2C, MEF2D, ASNS, ZNF268, EBAG9, DLC1, MASP1
Regulation of apoptosis and cell death
PPARδ, MLXIPL, MAFG, KLF13, CCDC85B,
ZNF268, IKZF1, COPS2, NFYA Cell cycle process OGT, GALNT1, NFE2L2, UBL4A, ASNS,
NR1H3, B4GALT5, RFN10, ZNF268, FEM1A, TOMM7
Protein metabolic process
SREBF1, UBL4A, TOMM7 Protein transport PPARδ, NRF1, NFE2L2, PPARGC1A Response to stress
PPARα, PPARγ, NFE2L1, IL25 Defense response, inflammatory response
PPARγ, MEF2A, CNIH, MASP1, FGFR4 Innate immune response
a
The lists of differentially-expressed genes in porcine perirenal (PRAT) or subcutaneous (SCAT) adipose tissues in response to diet were automatically confronted to the academic information on regulations and reactions in mammalian cell signaling. Genes that were able to regulate a significant number of the differentially-expressed genes were proposed as upstream regulatory candidates. The biological processes in which these genes could be involved were indicated as referenced in the gene ontology (GO) Entrez database. The complete lists of candidates are given in Additional file5: Table S5 for PRAT and Additional file6: Table S6 for SCAT
dietary energy source rather than dietary energy level on gene expression levels in AT [7, 24, 25]. A recent study on Iberian pigs revealed only minor influences of dietary energy source (sunflower oil and fiber opposed to carbo-hydrates) on dorsal subcutaneous fat transcriptome [26]. In the present study, feeding pigs a diet rich in lipids (rapeseed and soybean oils) and fibers (insoluble wheat-straw) during 58 days led to 1.4-fold reduction in adiposity as opposed to pigs fed a ration characterized by starch as the main energy source. Large numbers of genes in perirenal AT and, to a lesser extent in sub-cutaneous AT, exhibited dietary-related changes in ex-pression levels. Complementary integrative statistical methods and functional bioinformatics tools were thus used on the transcript data sets to identify the most im-portant metabolic pathways accounting for dietary-related variations adiposity across the two ATs.
Depressed catabolic protein process and lower glucose use for anabolic pathways were primarily associated with reduced body adiposity by a high-fat high-fiber diet
Among the 436 unique genes which exhibited close-similar dietary-induced variations in their expression levels across the two ATs, protein catabolic process was suggested as the top- down-regulated pathway acting in adiposity variation by diet. Down-regulation of the ubiquitin-mediated proteolysis and proteasome pathway has been previously reported in the liver for a specific strain of mice fed a high-fat diet compared with a carbo-hydrate chow diet [27]. In the present study, it is possible that molecular changes related to protein catab-olism have also resulted from the introduction of insol-uble fiber in the pig diet, which may have compromised dietary protein digestibility and nitrogen retention [28]. The finding of lower plasma level of lysine, an
Fig. 3 Expression levels of transcription factors examined by qPCR as affected by diet in adipose tissues. The %variation ratio in expression level of each target gene was shown for HF diet (high-fat high-fiber) relative to LF diet (low-fat high-starch) for perirenal (PRAT) and subcutaneous (SCAT) adipose tissues. When a gene was down-regulated by the HF diet, the value was preceded by a minus sign. ***p < 0.001; **p < 0.01, *p < 0.05,t0.05 <
indispensable amino-acid, in pigs fed the HF diet as compared with pigs fed the LF diet in our associated study [29] supports this hypothesis. Although the relationships between potential changes in the ubiquitin-proteasome system and AT development cannot be fully elucidated, roles in the regulation of proteins involved in cell division, cell death and signal transduction [30] could be inferred. Indeed, dietary-related modulations in groups of genes regulating apoptosis and cell cycle progression were ob-served across ATs in the present study. Altogether, finding reduced expression of genes coding for proteasome sub-units in ATs of the leanest HF pigs is consistent with data in murine 3 T3-L1 adipocytes showing that proteasome inhibition led to impaired adipocyte differentiation and decreased lipid content [31].
Considering the differences in lipid and starch con-tents between HF and LF diets, the modulation of sev-eral gene transcripts related to glucose metabolism in the two ATs was expected. Different glucose anabolic pathways were suggested to be repressed by the HF diet, likely due to the down-regulation of hexokinase 2 (HK2) which catalyzes the first step in glucose metabolic path-ways [32]. Even though AT contain only traces of glyco-gen, finding depressed transcriptional levels of different genes related to glycogen synthesis in HF pigs suggests that variations in glycogen metabolic enzymes may be produced by nutritional treatments in porcine AT as previously observed in the rat [33]. It is reasonable to speculate relationships between glycogen metabolism in AT and adiposity variation, considering recent findings showing that knocking-down glycogen synthase kinase 3 beta (GSK3B) inhibits preadipocyte differentiation [34]. The lower expression levels of the pyruvate kinase and different members of the pyruvate dehydrogenase com-plex, which were observed in the two ATs of HF pigs, suggest that the outflow from the glycolytic pathway to mitochondria might be also reduced in these pigs. At the molecular level, these observations fit with the depressed basal activity of pyruvate dehydrogenase reported in AT of rats adapted to a high fat diet compared with rats fed a high glucose diet [35]. In contrast with human and rats, the porcine AT is considered the main lipogenic site [36], so that glucose utilization and de novo lipid synthesis are inextricably intertwined in pig ATs. There-fore, the down-regulations of genes participating to co-factor metabolic processes such as ATP-citrate lyase (ACLY) responsible of cytosolic acetyl-CoA production and malic enzyme (ME1), the rate-limiting enzyme in de novo lipogenesis in the pig [37], suggest that lipid syn-thesis from carbohydrates was reduced in ATs when feeding pigs the HF diet. Less obvious, the down-regulation of 3-hydroxy-3-methylglutaryl-CoA reductase (HMGCR) may reduce cholesterol synthesis in ATs of HF-fed pigs. In agreement, interactive effects between
dietary fat and dietary fiber have been reported with re-gard to cholesterol-related traits in pig AT [38].
No reciprocal stimulation of lipid metabolism occurred in ATs when lipids and insoluble fibers were included in the diet
Usually, inhibiting lipogenesis does not disrupt AT growth if extracellular lipids are available. In the present study, we did not find any specific enrichment in lipid-related pathways among genes regulated by diet. How-ever, the low-density lipoprotein receptor (LDLR), which can directly internalize triglyceride-rich lipoprotein rem-nants as whole-particles into adipose cells [39], was down-regulated by the HF diet. Due to the wheat-straw-derived fiber consumption, part of the dietary lipids may have been sequestrated into the viscera and subsequently reduced quantities are readily to provide energy to sus-tain fat development in HF pigs. An increase in the weight of the digestive tract and increased hepatic lipid content in HF pigs compared with LF pigs support to this hypothesis [21]. Furthermore, the LEP gene encod-ing leptin, an adipokine secreted by ATs to regulate food intake and energy expenditure, was found down-regulated in ATs of HF pigs, an observation which was in agreement with the reduced circulating concentration of leptin reported in our associated study on the same pigs [29]. Finally, due to the down-regulation of its re-ceptor (ADIPOR2) in ATs of HF-fed pigs, it is tempting to speculate that there is an alteration to adiponectin signaling, another adipocyte-related protein that may fa-cilitate adipose expansion in situation of extra-nutrients supply [40]. Direct measurements of circulating adipo-nectin concentrations and of ADIPOR1/2R in skeletal muscle and liver are however needed to unravel the sig-nificance of this change with regard to the control of carcass fat and insulin signaling.
Upstream transcriptional factors were suggested to act on metabolic flexibility in ATs in response to contrasted dietary nutrients
As each gene can participate in more than one biological pathway and because many biological processes are highly inter-connected, it is of interest to decipher the main upstream regulators in the molecular pathways participating in the observed limitation of fat expansion by the HF diet. The influence graph-driven qPCR valid-ation provides evidence for the carbohydrate responsive element binding protein ChREBP also known as MLX-interacting protein-like (MLXIPL), as a pivotal transcrip-tional mediator down-regulated by the HF diet in porcine ATs. This was expected considering that this gene is conversely activated in response to high glucose (like in LF diet) to up-regulate several genes involved in the metabolic conversion of glucose to fat in the rodent
liver [38]. Moreover, glucose-related stimulation of lipo-genic gene expressions through ChREBP has been re-cently demonstrated in porcine primary adipocytes [41]. Another classically-recognized gene regulator controlling the expression of nearly all genes integral to glucose use for anabolic purpose [42, 43] is the sterol-regulatory element binding protein-1 (SREBF1), which was lesser expressed in ATs when pig were fed the HF diet. Down-expression in SREBF1 Down-expression by an increased dietary fat intake irrespective of the type of fibers included in diet was similarly revealed in porcine subcutaneous AT [7]. This gene is responsive to increased insulin levels as-sociated with consumption of high carbohydrate diets, so that its reduced expression in ATs was in agreement with the reduced insulinemia in the HF pigs reported in our associated study [29]. Conversely, finding an over-expression of O-GlcNAc transferase (OGT) in the two ATs of HF pigs is worthy of interest. Indeed, this gene encodes the enzyme responsible for adding O-linked-β-N-acetyl-glucosamine to proteins, thus affecting ubiqui-tination and subsequent protein degradation. Increased OGT mRNA expression has been reported in response to glucose starvation in mammals [44], a nutritional situation that is partly comparable to feeding a HF diet. Finally, differential regulation of PPARs binding fatty acids and their derivatives were suggested in the present study. PPARs are nuclear hormone receptors expressed in three isoforms (α, γ, δ) and each PPAR forms a het-erodimer with RXR. While PPARα is highly expressed in tissues with a high rate of fatty acid oxidation, PPARγ is considered as an adipocyte predominant transcription factor and PPARδ is ubiquitously expressed. In the two pig ATs, the variations observed in HF vs. LF diet were opposite to those reported in mice AT where the con-sumption of fibers induced rather than decreased PPARδ expression [24] and decreased rather than increased PPARγ-activated processes [45, 46]. In support to the present results, short-chain fatty acids such as butyrate however enhance PPARγ expression in the stroma vas-cular fraction isolated from porcine AT [47]. Similarly to our results, pigs fed a diet enriched in oil and fibers also exhibited up-regulation in RXRG, a molecule narrowly related to PPARγ expression, when compared with pigs fed carbohydrate-based diet [26]. Because of their pleio-tropic functions in the regulation of glucose and lipid metabolism, oxidative stress and inflammation, the rea-sons why PPARδ and PPARγ may be oppositely regu-lated by the diet in porcine AT deserve further studies.
Adiposity-unrelated modulation in inflammation and innate immune responses by a high-fat high-fiber diet was underlined in the perirenal fat
The composition of fatty acids (unsaturated or satu-rated) in ATs of pigs generally reflects the dietary fatty
acid pattern when fed a high-fat diet and de novo lipo-genic intensity when fed a low-fat high-starch diet [21, 26]. The nature of fatty acids together with other food compounds may contribute to immune activation and chronic inflammation, irrespective of adiposity varia-tions. In the present study, a module of interconnected dietary-regulated genes that were poorly related to adi-posity mass variation but with clear links to defense mechanisms, including immunity and inflammation, was strengthened in PRAT. Among these genes, CYBA/ CYBB genes coding for chains of the oxidase system, a significant contributor to the pathogenic effects of high-fat diets [48], were up-regulated by the HF diet. Con-versely, many up-regulated transcripts in PRAT of HF pigs encoded proteins with anti-inflammatory properties, such as interleukin-10 (IL10) and its receptor IL10RA. This observation is in agreement with another study in human AT showing of IL10 activation after ingestion of purified dietary fibers [49]. The mRNA levels of C1QA/ B/C genes were also higher in HF pigs. Because the complement C1q is generally protective [50], this may be an argument to support a positive modification in the outcome of inflammation by the HF diet. Similarly, VAV1, a key negative regulator of macrophage-derived pro-inflammatory cytokine production [51], was up-regulated in PRAT of HF pigs, suggesting that this bene-fit may have concerned infiltrated macrophages rather than adipocytes. Altogether, these observations suggest that dietary fat and fiber had antagonistic actions on in-flammatory and anti-inin-flammatory pathways in PRAT. In support, fiber-rich food consumption attenuated the inflammation induced by the intake of a high-fat diet in the liver [52]. In AT, the downregulation of genes related to inflammation and immune response has been re-ported in response to the intake of a diet rich in fat and viscous non-fermentable soluble dietary fiber [25]. The modulations in inflammation and immune pathways were the most striking example of contrasting transcrip-tional adaptation to diets between PRAT and SCAT, as the above-mentioned genes were unchanged in SCAT. In agreement with this finding, porcine visceral AT has previously been shown to be enriched in miRNAs asso-ciated with immune and inflammation responses when compared with subcutaneous AT [20]. Of interest in this study, the nuclear respiratory factor 1 (NRF1) was up-regulated by the HF diet in PRAT only. While this target is involved in a wide range of processes including prolif-eration, oxidative stress, apoptosis and innate immune response, long-term NRF1 overexpression in 3 T3-L1 adipose cells stimulated cytokine expression such as clusters of differentiation attracting macrophages [53]. The graph-driven identification of upstream regulatory candidates did not propose SIRT1, a master transcrip-tional regulator of both metabolism and inflammation in
response to states of energetic excess and high-fat feed-ing [54]. Because SIRT1 was found up-regulated in PRAT by HF diet, its role in the protection against pro-inflammatory molecular responses might have been con-founded by processes related to PPARs [55]. Moreover, not all changes take place at a transcriptional level, so that functional studies are needed to clarify the role of SIRT1 protein in porcine AT. Altogether, the side effects of the HF diet on the modulation of the inflammasome in PRAT may be important to consider in conditions where chronic inflammation plays an important mitigat-ing role and is contrary to optimal health and growth performance.
Conclusion
This study presents novel findings on the molecular modulations related to dietary energy source and nutri-ents in two adipose tissues of growing pigs. Particular-ities in the dietary responses for immunity and inflammation features are again enlightened at the peri-visceral location.
Methods
Ethic statement
The care and use of pigs were performed following the guidelines edited by the French Ministries of High Education and Research, and of Agriculture and Fish-eries (http://ethique.ipbs.fr/sdv/charteexpeanimale.pdf ). The protocol was approved by the local Ethics Committee in Animal Experiment of Rennes, France (Comité Rennais d’Ethique en matière d’Expérimentation Animale, CREEA, http://ethique.ipbs.fr/creeapresent.html; agreement N°R-2012-07). All pigs were reared and killed in compliance with national regulations and according to procedures ap-proved by the French Veterinary Services at INRA Pegase experimental facilities.
Animals and diets
Data from a total of 48 pigs (pure Large White breed) were considered in the present study. These pigs origi-nated from two lines divergently selected over eight gen-erations for residual feed intake (RFI) as a measure of feed efficiency [56]. The RFI index was typically calcu-lated as the difference between actual and predicted feed intakes, so that low RFI value signified better efficiency in the conversion of food to weight gain. In this experi-ment, barrows originated from the selection herd (INRA GeneSI, Le Magneraud, France) were transferred after weaning (pig age: 28 days) at INRA Pegase (St-Gilles, France). From 74 d ± 0.3 d of age onwards, pigs were randomized by line in two dietary groups (n = 12 per diet and per line): a high-fat high-fiber diet (HF) or a low-fat high-starch diet (LF). All pigs had free access to its experimental regimen during 58.5 ± 0.5 days. The
diets were formulated in two formulas distributed during the growing and finishing periods, respectively, and for which nutritional composition (protein content and en-ergy values) followed recommendations for an optimal growth during these two periods. Importantly, the HF and LF diets included similar crude protein contents (17 % and 13 % for growing and finishing formulas, re-spectively) and digestible essential amino acids (lysine, methionine and threonine). Starch derived from cereal grains (wheat and barley) in the LF diet was partially re-placed by rapeseed and soybean oils in the HF diet and crushed wheat straw (insoluble fiber) was included as a di-luent of dietary energy in this diet, so that LF and HF diets can be formulated at an isocaloric basis (12.9 MJ/kg metabolizable energy). This strategy resulted in large vari-ations between HF and LF diets in their nutritional com-position (as fed basis): respectively, 33.5 % vs. 45.5 % of starch, 7.2 % vs. 2.2 % of fat, 18 % vs. 12.1 % of neutral-detergent fiber and 8.2 % vs. 3.6 % of acid-neutral-detergent fiber. Full composition of diets has been detailed elsewhere [21]. At 132.5 d ± 0.5 d of age, pigs were euthanized by elec-tric stunning and exsanguinated. Samples were immedi-ately collected at the dorsal subcutaneous adipose tissue (SCAT) location (last rib level) by an incision made along the dorsal right side of the body. After opening the abdominal cavity by a ventral incision, the perirenal adipose tissue (PRAT) was totally collected and weighed. It was immediately cut in small pieces, which were fro-zen in liquid nitrogen and stored at−70 °C until analysis. The day after, the dorsal SCAT was entirely removed from the left side of the carcass and weighed. Weights of PRAT and SCAT were expressed as relative to pig live weight (%PRAT and %SCAT, respectively).
RNA isolation and reverse transcription
Total RNA was extracted from ATs (80 to 100 mg each) by homogenization in Trizol reagent (Invitrogen, California, USA) and then, purified using a silica-membrane technology under vacuum (Nucleospin® 8 RNA kit, Macherey-Nagel, France). The method included a DNase digestion step to remove contaminating DNA. The total RNA was eluted in 50μl of RNase-free water and stored at −70 °C. The quantification of RNA was performed by using a NanoDrop® ND-1000 spectrophotometer (Thermo Scientific, Illkirch, France). Ratios of A260/280 and A260/ 230 were greater than 1.7 in all samples, denoting good purity. The RNA quality was verified using the Agilent RNA 6000 Nano kit and an Agilent 2100 Bioanalyzer (Agilent Technologies France, Massy, France). Average RNA integrity number was 8.3 ± 0.5.
RNA labelling and microarray hybridization
The custom porcine microarray (8 × 60 K, GPL16524, Agilent Technologies France, Massy, France) used contain
60,306 porcine probes derived from the Agilent commer-cial 44 K microarray (V2:026440, GPL16571) and enriched with immune system, muscle and adipose tissue genes. About 57,387 probes are annotated. It is important to consider that annotations are being constantly improved and that annotations of all cited genes were carefully checked.
Each sample was labeled with Cy3 dye using the Low Input Quick Amp Labeling kit (Agilent Technologies) following the manufacturer’s instructions. Briefly, a two-step procedure generates fluorescent complementary RNA (cRNA) by using T7 RNA polymerase, which sim-ultaneously amplified target and incorporated cyanine-labeled CTP. Samples were then purified with an RNeasy Mini kit (Qiagen, Hilden, Germany). Microarray hybrid-izations were carried out in Agilent’s hybridization chambers containing 600 ng of Cy3-labeled cRNA sample per hybridization. Hybridization reactions were performed at 65 °C for 17 h using Agilent’s Gene Expression Hybridization Kit. After washing, microar-rays were scanned at 3 μm/pixel resolution using the Agilent DNA Microarray Scanner, and images were ana-lyzed with Agilent Feature Extraction Software (Version 10.7.3.1, protocol GE1_107_Sep09).
Microarray analyses were performed using the R software version 2.10.0 [57]. Raw spots intensities were first submitted to quality filtration based on 4 criteria: intensity, uniformity, saturation and outliers detection. Intensities of filtered spots were transformed into log2(Cy3), and data were normalized by median cen-tering, i.e. subtracting the median value across all probes from all raw values for each sample in order to obtain ex-perimentally consolidated gene expression values. Micro-array selected data have been deposited in NCBI’s Gene Expression Omnibus (GEO) and are accessible through GEO subseries accession number GSE70836 (http:// www.ncbi.nlm.nih.gov/geo/query/acc.cgi?acc=GSE70836) for SCAT and GSE70837 (http://www.ncbi.nlm.nih.gov/ geo/query/acc.cgi?acc=GSE70837) for PRAT.
Statistical analyses
In each AT, the data were first analyzed by a two-way analysis of variance (ANOVA) with diet (HF vs. LF), line (low vs. high RFI) and the interaction between diet and line as the main effects. A raw p-value < 0.01 and fold-change between conditions > |1.1| were considered as cut-offs [58] in a heuristic way to retain differentially-expressed probes (DEP). Data were also submitted to the Benjamini-Hochberg (BH) multiplicity correction of the p-values for a control of the FDR at level 0.08 [59], prov-ing strprov-ingent control of statistical errors. Within each AT, the lists of DEP, one for diet and one for line, were thus edited. Venn diagrams representing the number of DEP in the two ATs as affected by diet or by line were produced.
Second, to derive a common framework that might be more convenient to highlight communalities across the two ATs, the Multiple Factor Analysis (MFA) was used as a data integration statistical method [12] under the FactoMiner package in R software. Briefly, two principal component analyses (PCA) were first performed from the DEP dataset obtained in each adipose tissue (one for PRAT, one for SCAT). Each variable identified by the probe name was weighed by the first eigenvalue in PCA. Then, the analysis consisted in realizing a meta-PCA by using these weighed variables as new entries, so that each tissue influence was equally represented. The first two MFA components (Dim1; Dim2) were linked to the three first axes of the two separate PCA (Dim_i_PRAT and Dim_i_SCAT with i = 1 to 3) by calculating the cor-relations between MFA and PCA components. This al-lows building a MFA diagnostic plot to study the relationship between the observations, the variables and the tables, and which facilitates the description of com-munalities. Adiposity phenotypic traits (%_SCAT and %_PRAT, respectively) were superimposed on the plot to relate variations in transcriptomic profiles to changes in body fat. Calculating the correlations between each DEP and MFA dimensions (Dim_1; Dim_2) allows decipher-ing the DEP that were mainly responsible for commu-nalities in molecular responses between the two ATs; the threshold r > |0.70| (p < 0.001) was retained to list these main contributors.
Third, global gene co-expression networks were con-structed from the dataset joining the DEP of the two ATs, with the main goal to find modules of genes with similar transcriptional profiles [23]. The WGCNA pack-age in R software, which has been described as one of the methods that performed the best for describing the correlation patterns among genes, was used. As recom-mended [60], a power (s, β = 6) was retained to strengthen the separation between low and high correl-ation in gene expression levels within the modules. Clus-tering methods were implemented on the adjacency matrix (encoding the connection strength between pairs of nodes) to extract network modules of co-expressed genes. A single virtual gene expression termed the eigen-gene can be calculated to summarize the eigen-gene expres-sion profile within the cluster. An equivalent definition can be given where the module eigengene is defined as the first principal component in PCA [23]. To have a measure of how closely related a particular actual gene is to the eigengenes, a correlation coefficient was calcu-lated between each individual gene in the module and the eigengene. In the present experiment, only DEP highly correlated (r > |0.70|; p < 0.001) to the eigengene in each module were further considered to deduce its biological meaning. Intra-modular connectivity was used as an additional network concept; the higher is the
connectivity value, the stronger is the evidence that the gene is a central node of the module. Finally, eigengenes of the different clusters were used to explore the associa-tions between each module and MFA dimensions, and between each module and adiposity phenotypic traits (%PRAT, %SCAT).
Functional pathways analysis
The most important DEP (r > |0.70|) participating in the comprised MFA dimensions or in the WGCNA modules were considered for functional analyses. The corres-pondence between DEP and its official gene symbol was first made, when applicable. The gene ontology (GO) terms for biological processes were then automatically searched, using the Database for Annotation, Visualization and Integrated Discovery (DAVID) bioinformatics re-source database (http://david.abcc.ncifcrf.gov/). The GOBP terms_FAT were selected to filter the broadest terms without overshadowing the more specific ones. The results were downloaded using the “Functional annotation clustering” option of the DAVID tool. The enrichment score (measured by the geometric mean of the EASE score of all enriched annotations terms) and the modified Fisher exact p-value, were obtained. As recommended [61], an enrichment score E≥ 1.3 and p < 0.05 were first considered to list the signifi-cantly top-enriched clusters of genes. However, groups with a lower E score were also indicated as individual genes could be also potentially interesting.
Upstream regulatory candidates
A web tool (KeyRegulatorFinder.genouest.org/) that has been recently developed [62], was used to propose up-stream transcriptional regulators that may have partici-pated to the molecular flexibility in response to diet within each AT. This methodology aimed to provide a reasonable number of upstream regulatory candidates for the transcriptomic changes, by an automatic con-frontation of the DEP dataset with the academic infor-mation on regulations and reactions in mammalian signal transduction included in Transpath® database. A causality graph was built across the different molecules, so that genes and(or) gene complexes being able to regulate a significant number of DEP from the input list could be considered as candidates for an upstream regu-latory role. The algorithm can also predict whether the upstream candidates were activated or inhibited by the conditions under study. In the present experiment, the DEP to be included in the input list were first identified by their Official Gene Symbol and the sign of variation in their expression levels between the two diets (arbi-trary set to “+” when up-regulated in HF vs. LF diets, and to “-” when up-regulated in LF vs. HF diet). The proposed candidates were ranked according to a score of
specificity [62], and a biological post-prioritization among the first 50 top candidates was further made by manually adding their functional GO terms.
Quantitative real-time PCR (qPCR)
Finally, a graph-driven hypothesis qPCR validation was performed on a subset of the upstream regulatory candi-dates in PRAT and in SCAT of the 48 pigs. For qPCR, first-strand cDNA synthesis was performed with 1 μg of total RNA previously used in microarray analysis, using High Capacity RNA to cDNA Kit (Applied Biosystems, Foster City, USA). Primers were designed from porcine sequences available in Ensembl or NCBI databases using Primer Express® v3.0 software (Applied Biosystems). De-tailed information for each primer pair including gene name, gene symbol, primer sequences (forward and re-verse) and amplicon size are provided in Additional file 7: Table S7. A StepOnePlus™ real-time PCR system (Applied Biosystems) was used for qPCR. Amplification reactions and disassociation curves were realized as de-scribed previously [63]. The TOP2B gene was the most stable reference gene stated by GenNorm algorithm among 3 other tested reference genes, and was used for normalization. For each sample, the normalized expression level was calculated using the formula Etarget-ΔCq (sample - calibrator)/ ETOP2B-ΔCq (sample - calibrator)
where E is the efficiency calculated from the slope of bration curve, Cq is the quantification cycle and the cali-brator is a pool of all samples. Then, ANOVA was used to determine significant effects of diet, line and the inter-action between diet and line, using the R software. Both fold-change in gene expression levels and p-value were represented.
Availability of supporting data
The molecular datasets supporting the conclusions of this article are available in Gene Expression Omnibus repository (GEO, http://www.ncbi.nlm.nih.gov/geo/) through the accession number GSE70836 for sub-cutaneous adipose tissue (SCAT) and GSE70837 for perirenal adipose tissue (PRAT). Microarray data are MIAME compliant. Other datasets are included within the article and its additional files.
Additional files
Additional file 1: Table S1. List of differentially expressed probes commonly regulated by diets across perirenal and subcutaneous adipose tissues. (XLSX 207 kb)
Additional file 2: Table S2. Summary of the biological processes shared by genes being commonly regulated by diet across adipose tissue. (DOCX 23 kb)
Additional file 3: Table S3. List of co-expressed probes within a small module mainly attributed to perirenal adipose tissue related responses to diet. (XLSX 40 kb)
Additional file 4: Table S4. Detail list of genes associated with different biological process within a small interconnected module in perirenal adipose tissue of pigs fed a high-fat high-fiber diet. (XLSX 11 kb) Additional file 5: Table S5. Complete list of key upstream regulators proposed in response to diets in perirenal adipose tissue and associated biological processes. (XLSX 18 kb)
Additional file 6: Table S6. Complete list of key upstream regulators proposed in response to diets in subcutaneous adipose tissue and associated biological processes. (XLSX 18 kb)
Additional file 7: Table S7. Primers used for qPCR analysis. (DOCX 17 kb) Abbreviations
AT:adipose tissue; DAVID: database for annotation, visualization and integrated discovery; DEP: differentially expressed probe; DEG: differentially-expressed gene; Dim: dimension; GO: gene ontology; HF: high fat high fiber diet; LF: low fat low fiber diet; MFA: multiple factor analysis; PCA: principal component analysis; qPCR: real-time quantitative polymerase chain reaction; PPAR: peroxisome proliferator activated receptor; PRAT: perirenal adipose tissue; RFI: residual feed intake; RXR: retinoid x receptor; SCAT: subcutaneous adipose tissue; WGCNA: weighed gene co-expressed network analysis. Competing interests
The authors declare that they have no competing interests. Authors’ contributions
Conception, design and realization of the experiment: FG, IL, SL. Conducting molecular studies: AV. Conception and realization of the statistical analyses: MHB, DC. Conception of the bioinformatics tool: AS. Analysis and interpretation of data: FG, IL, SL. Coordination of the study, drafting and revising the manuscript: FG. All authors helped to draft the manuscript, read and approved the final manuscript.
Acknowledgments
This project was funded by the French National Agency of Research (FatInteger project, ANR-11-SVS7). Microarray annotations were managed by SIGENAE (Système d’Information des GENomes des Animaux d’Elevage (http://www.sigenae.org). We would like to acknowledge Hélène Gilbert (GenPhySE, INRA, Toulouse, Fr) for line selection.
Author details
1INRA, UMR1348 Pegase, F-35590 Saint-Gilles, France.2Agrocampus-Ouest,
UMR1348 Pegase, F-35000 Rennes, France.3Agrocampus-Ouest, UMR6625 IRMAR, F-35000 Rennes, France.4CNRS-Université de Rennes 1-INRIA,
UMR6074 IRISA, Campus de Beaulieu, 35042 Rennes, Cedex, France.
Received: 9 October 2015 Accepted: 5 February 2016 References
1. Waki H, Tontonoz P. Endocrine functions of adipose tissue. Annu Rev Pathol. 2007;2:31–56.
2. Romacho T, Elsen M, Röhrborn D, Eckel J. Adipose tissue and its role in organ crosstalk. Acta Physiol (Oxf). 2014;210:733–53.
3. Blüher M. Adipose tissue dysfunction contributes to obesity related metabolic diseases. Best Pract Res Clin Endocrinol Metab. 2013;27:163–77. 4. Kwon EY, Shin SK, Cho YY, Jung UJ, Kim E, Park T, et al. Time-course
microarrays reveal early activation of the immune transcriptome and adipokine dysregulation leads to fibrosis in visceral adipose depots during diet-induced obesity. BMC Genomics. 2012;13:450.
5. Meierhofer D, Weidner C, Sauer S. Integrative analysis of transcriptomics, proteomics, and metabolomics data of white adipose and liver tissue of high-fat diet and rosiglitazone-treated insulin-resistant mice identified pathway alterations and molecular hubs. J Proteome Res. 2014;13:5592–602. 6. Toedebusch RG, Roberts MD, Wells KD, Company JM, Kanosky KM, Padilla J, et al. Unique transcriptomic signature of omental adipose tissue in Ossabaw swine: a model of childhood obesity. Physiol Genomics. 2014;46:362–75. 7. Yan H, Potu R, Lu H, Vezzoni de Almeida V, Stewart T, Ragland D, et al.
Dietary fat content and fiber type modulate hind gut microbial community and metabolic markers in the pig. PLoS One. 2013;8, e59581.
8. Brockman DA, Chen X, Gallaher DD. High-viscosity dietary fibers reduce adiposity and decrease hepatic steatosis in rats fed a high-fat diet. J Nutr. 2014;144:1415–22.
9. Weickert MO, Pfeiffer AF. Metabolic effects of dietary fiber consumption and prevention of diabetes. J Nutr. 2008;138:439–42.
10. Gondret F, Guével B, Com E, Vincent A, Lebret B. A comparison of subcutaneous adipose tissue proteomes in juvenile piglets with a contrasted adiposity underscored similarities with human obesity. J Proteomics. 2012;75:949–61.
11. Bassols A, Costa C, Eckersall PD, Osada J, Sabrià J, Tibau J. The pig as an animal model for human pathologies: A proteomics perspective. J Proteomics Clin Appl. 2014;8:715–31.
12. Kogelman LJ, Pant SD, Fredholm M, Kadarmideen HN. Systems genetics of obesity in an F2 pig model by genome-wide association, genetic network, and pathway analyses. Front Genet. 2014;5:214.
13. Jha R, Berrocoso JD. Review: dietary fiber utilization and its effects on physiological functions and gut health of swine. Animal. 2015;9:1441–52. 14. Myer RO, Combs GE. Fat supplementation of diets containing a high level
of oats for growing-finishing swine. J Anim Sci. 1991;69:4665–9. 15. Barea R, Dubois S, Gilbert H, Sellier P, van Milgen J, Noblet J. Energy
utilization in pigs selected for high and low residual feed intake. J Anim Sci. 2010;88:2062–72.
16. Le Naou T, Le Floc’h N, Louveau I, Gilbert H, Gondret F. Metabolic changes and tissue responses to selection on residual feed intake in growing pigs. J Anim Sci. 2012;90:4771–80.
17. Vidal H. Gene expression in visceral and subcutaneous adipose tissues. Ann Med. 2001;33:547–55.
18. Gil A, Olza J, Gil-Campos M, Gomez-Llorente C, Aguilera CM. Is adipose tissue metabolically different at different sites? Int J Pediatr Obes. 2011;1:13–20.
19. Louveau I, Gondret F. GH and insulin affect fatty acid synthase activity in isolated porcine adipocytes in culture without any modifications of sterol regulatory element binding protein-1 expression. J Endocrinol. 2004;181:271–80.
20. Ma J, Jiang Z, He S, Liu Y, Chen L, Long K, et al. Intrinsic features in microRNA transcriptomes link porcine visceral rather than subcutaneous adipose tissues to metabolic risk. PLoS One. 2013;8, e80041.
21. Gondret F, Louveau I, Mourot J, Duclos MJ, Lagarrigue S, Gilbert H, et al. Dietary energy sources affect the partition of body lipids and the hierarchy of energy metabolic pathways in growing pigs differing in feed efficiency. J Anim Sci. 2014;92:4865–77.
22. Abdi H, Williams LJ, Valentin D. Multiple factor analysis: principal component analysis for multi-table and multi-block data sets. WIREs Comp Stat. 2013;5:149–79.
23. Langfelder P, Horvath S. Eigengene networks for studying the relationships between co-expression modules. BMC Syst Biol. 2007;1:54.
24. Lee JH, Jun HJ, Jia Y, Kim W, Choi SG, Lee SJ. Critical role of peroxisome proliferator activated receptor-delta on body fat reduction in C57BL/6 J and human apolipoprotein E2 transgenic mice fed delipidated soybean. J Agric Food Chem. 2011;59:11872–81.
25. Kim H, Bartley GE, Young SA, Davis PA, Yokoyama W. HPMC
supplementation reduces abdominal fat content, intestinal permeability, inflammation and insulin resistance in diet-induced obese mice. Mol Nutr Food Res. 2012;56:1464–76.
26. Ovilo C, Benitez R, Fernandez A, Isabel B, Nunez Y, Fernandez AI, et al. Dietary energy source largely affects tissue fatty acid composition but has minor influence on gene transcription in Iberian pigs. J Anim Sci. 2014;92:939–94.
27. Waller-Evans H, Hue C, Fearnside J, Rothwell AR, Lockstone HE, Caldérari S, et al. Nutrigenomics of high fat diet induced obesity in mice suggests relationships between susceptibility to fatty liver disease and the proteasome. PLoS One. 2013;8, e82825.
28. Myrie SB, Bertolo RF, Sauer WC, Ball RO. Effect of common antinutritive factors and fibrous feedstuffs in pig diets on amino acid digestibilities with special emphasis on threonine. J Anim Sci. 2008;86:609–19.
29. Jégou M, Gondret F, Lalande-Martin J, Tea I, Baéza E, Louveau I. NMR-based metabolomics highlights differences in plasma metabolites in pigs exhibiting diet-induced differences in adiposity. Eur J Nutr. 2015 May 22. [Epub ahead of print]
30. Finley D. Recognition and processing of ubiquitin-protein conjugates by the proteasome. Annu Rev Biochem. 2009;78:477–13.