Université de Montréal
Hypertension et régulation de l'expression
moléculaire de l'angiotensinogène par la
ribonucléoprotéine hétérogène
nucléaire K
Par
Shaaban ABDO
Programme de sciences biomédicales
Faculté de médecine
Thèse présentée à la Faculté des études supérieures
en vue de l’obtention du grade de docteur ès sciences (Ph.D)
en sciences biomédicales
June 2014
© Shaaban ABDO, 2014
Université de Montréal
Faculté des études supérieures
Cette thèse intitulée
Hypertension et régulation de l'expression moléculaire de
l'angiotensinogène par la ribonucléoprotéine hétérogène
nucléaire K
Présentée par :
Shaaban ABDO
A été évalué par un jury composé des personnes suivantes :
Dre. Jolanta Gutwska
Président rapporteurDr. John S.D.Chan
Directeur de rechercheDre. Shao-Ling Zhang
Codirecteur de recherché
Dr. Alain Bonnardeaux
Membre du jury
Dr. Andrey Cybulsky
i
Résumé
Le diabète est une maladie chronique dont la principale caractéristique est un niveau plasmatique élevé de glucose, qui est causé soit par un défaut dans la production d’insuline, l’action de l’insuline, ou les deux à la fois. Plusieurs études ont démontré que l’hyperglycémie chronique peut mener à la dysfonction et même la défaillance de plusieurs organes, dont le coeur, le système vasculaire, les yeux et les reins, se traduisant par des infarctus du myocarde, des accidents cérébro-vasculaires et des complications rétinales et rénales, respectivement. La néphropathie diabétique (DN) est la principale cause de déficience rénale et affecte près de 25-40% des patients diabétiques. La DN est invariablement associée à un risque élevé d’accident cérébro-vasculaire et de dysfonction cardicérébro-vasculaire. L’angiotensinogène (Agt) est l’unique précurseur de tous les types d’angiotensines. En plus du système rénine-angiotensine (RAS) sytémique, le rein possède son propre système intrarénal et exprime tous les composants du RAS. L’Agt est fortement exprimé dans les cellules du tubule proximal rénal (RPTC) et y est converti en angiotensine II (AngII), le peptide biologiquement actif du RAS. Les patients diabétiques présentent de hauts niveaux d’AngII et une augmentation de l’expression des gènes du RAS, suggérant que l’activation du RAS intrarénal joue un rôle important dans la progression de la DN. Les mécanismes qui contrôlent la régulation du niveau rénal d’Agt par l’hyperglycémie et l’insuline demeurent mal compris.
Le but global de cette thèse est de mieux comprendre les mécanismes moléculaires qui contrôlent l’expression du gène Agt chez la souris Akita (un modèle murin de diabète de type 1). Dans cette optique, la première partie de la thèse se concentre sur deux facteurs de transcription de la famille des ribonucléoprotéines nucléaires hétérogènes (hnRNP). Chan et collaborateurs ont déjà identifié 2 protéines nucléaires hnRNP F et hnRNP K, de 48kD et 70kD respectivement. HnRNP F et hnRNP K forment un hétérodimère et se lient à l’élément de réponse à
ii
l’insuline (IRE) présent dans le promoteur du gène Agt du rat et inhibent la transcription du gène Agt in vitro. Afin de déterminer si hnRNP F / K sont responsables de l’inhibition de l’expression rénale de Agt par l’insuline in vivo, nous avons étudié des souris Akita males traités ou non avec des implants d’insuline pour une période de 4 semaines. Des souris non-Akita males ont été employées comme contrôles. Les souris Akita développent de l’hypertension et de l’hypertrophie rénale. Le traitement à l’insuline rétablit les niveaux de glucose plasmatiques et la pression systolique (SBP), et atténue l’hypertrophie rénale, l’albuminurie (ratio albumine/créatinine urinaire, ACR) et les niveaux urinaires d’Agt et AngII chez les souris Akita. De plus, le traitement à l’insuline inhibe l’expression rénale du gène Agt, tout en augmentant l’expression des gènes hnRNP
F, hnRNP K et ACE2 (enzyme de conversion de l’angiotensine-2). Dans
des RPTC in vitro, l’insuline inhibe Agt, mais stimule l’expression de hnRNP F et hnRNP K en présence de hautes concentrations de glucose, et ce via la voie de signalisation MAPK p44/42 (protéine kinase activée par un mitogène). La transfection avec des petits ARN interférents (siRNA) contre hnRNP F et hnRNP K prévient l’inhibition de l’expression d’Agt par l’insuline dans les RPTC. Cette étude démontre bien que l’insuline prévient l’hypertension et atténue les dommages rénaux observés chez les souris Akita diabétiques, en partie grâce à la suppression de la transcription rénale de Agt, via une augmentation de l’expression de hnRNP F et hnRNP K.
La seconde partie de cette thèse change de focus et se tourne vers le facteur Nrf2 (nuclear factor erythroid 2-related factor 2). Nrf2 est un facteur de transcription qui contrôle les gènes de la réponse antioxydante cellulaire en réponse au stress oxydant ou aux électrophiles. Le but de cette étude est d’examiner l’impact de la surexpression de la catalase (Cat) dans les RPTC sur l’expression du gène Agt via Nrf2 et sur le développement de l’hypertension et des dommages rénaux résultants chez les souris diabétiques Akita
iii
transgéniques (Tg). Nos études ont démontré que la surexpression de Cat dans les souris Akita Cat-Tg normalise la SBP, atténue les dommages rénaux et inhibe l’expression des gènes Nrf2 et Agt dans les RPTC. In vitro, le glucose élevé (HG) et l’oltipraz (un activateur de Nrf2) stimulent l’expression de Nrf2 et Agt, et cet effet peut être bloqué par la trigonelline (inhibiteur de Nrf2), des siRNA contre Nrf2, des antioxydants ou des inhibiteurs pharmacologiques NF-κB et MAPK p38. La suppression de sites de réponse à Nrf2 présents dans le promoteur du gène Agt du rat abolit la stimulation par l’oltipraz. Finalement, des souris males adultes non-transgéniques traitées avec l’oltipraz montrent une augmentation de l’expression de Nrf2 et Agt dans leurs RPTC et cette augmentation peut être normalisée par la trigonelline. Ces données permettent d’identifier un nouveau mécanisme d’action de Nrf2, par la stimulation du gène Agt intrarénal et l’activation du RAS, qui induisent l’hypertension et les dommages rénaux par le glucose élevé et les espèces réactives de l’oxygène chez les souris diabétiques. Nos conclusions permettent de démontrer que l’insuline induit l’expression de hnRNP F et hnRNP K, qui jouent ensuite un rôle protecteur en prévenant l’hypertension. La surexpression de la catalase dans les RPTC vient quant à elle atténuer l’activation de Nrf2 et ainsi réduit la SBP chez les souris Akita.
Mots-clés : rein, angiotensinogène, hnRNP F, hnRNP K, glucose,
iv
Abstract
Diabetes mellitus is a chronic metabolic disorder characterized by high plasma glucose caused by an impairment of insulin production, insulin action or both. Accumulating evidence has shown that chronic hyperglycemia can lead to dysfunction and failure of multiple organs including the heart, vascular system, eyes, and kidneys resulting in myocardial infarction, stroke, and retinal and renal complications, respectively. Diabetic nephropathy (DN) is the leading cause of end-stage renal disease affecting approximately 25–40% of diabetic patients. DN is invariably associated with an increased risk of stroke and cardiovascular dysfunction. Angiotensinogen (Agt) is the sole precursor for all types of angiotensins. In addition to systemic renin-angiotensin system (RAS), all the components of the intrarenal RAS are expressed in the kidney. Agt is highly expressed in the renal proximal tubular cells (RPTCs) and converted into biologically active angiotensin II (Ang II). In Diabetics, intrarenal Ang II level and RAS gene expression are upregulated, suggesting that intrarenal RAS activation plays an important role in the progression of DN. The mechanism (s) underlying the regulation of renal Agt by hyperglycemia and insulin are not completely understood. The overall aim of this thesis is to understand the molecular mechanism(s) that regulate renal Agt gene expression in an Akita mouse (a mouse model of type 1 diabetes). For this purpose, the first part of this thesis focuses on two transcription factors from the heterogenous nuclear ribonucleoprotein (hnRNPs) family. Previously, Chan’s group identified two nuclear proteins hnRNP F and hnRNP K of 48kD and 70kD, respectively. hnRNP F and hnRNP K form a heterodimer and bind to the insulin-responsive element (IRE) in the rat Agt gene promoter inhibiting
Agt gene transcription in vitro. To determine whether hnRNP F / K
mediate insulin inhibition of renal Agt expression in vivo, we used adult male Akita mice treated ± insulin implants for 4 weeks. Non-Akita mice served as controls. The Akita mice developed hypertension and exhibited
v
renal hypertrophy. Insulin treatment normalized plasma glucose levels and systolic blood pressure (SBP), attenuated renal hypertrophy, decreased urinary albumin/creatinine ratio (ACR) and urinary Agt and Ang II levels in Akita mice. Furthermore, insulin treatment inhibited renal
Agt expression but enhanced hnRNP F, hnRNP K and
angiotensin-converting enzyme-2 (ACE2) expression. In vitro, insulin inhibited Agt but stimulated hnRNP F and hnRNP K expression in high-glucose media via p44/42 mitogen-activated protein kinase signaling in RPTCs. Transfection with hnRNP F and hnRNP K small interfering RNAs (siRNA) prevented the insulin inhibition of Agt expression in RPTCs. This study demonstrates that insulin prevents hypertension and attenuates kidney injury, at least in part, through suppressing renal Agt transcription via upregulation of hnRNP F and hnRNP K expression in diabetic Akita mice.
In the second part of the thesis we focused on the nuclear factor erythroid 2-related factor 2 (Nrf2). Nrf2 is a transcription factor that regulates cellular antioxidant gene defense against oxidative stress or electrophiles. The purpose of this study is to investigate the impact of the overexpressing catalase (Cat) in RPTCs on Agt gene expression via Nrf2and the resulting effects on the development of hypertension and renal injury in diabetic Akita transgenic (Tg) mice. Our studies demonstrate that Cat overexpression normalizes SBP, attenuates renal injury, and inhibits RPTC Nrf2 and Agt gene expression in the Akita Cat-Tg compared to Akita mice. In vitro, high glucose (HG) and Oltipraz stimulated Nrf2 and Agt gene expression; these changes were blocked by Trigonelline (an inhibitor of Nrf2), siRNA against Nrf2, antioxidants, or pharmacological inhibitors of NF-kB and p38 mitogen-activated protein kinase. Moreover, deletion of Nrf2-responsive elements in the rat Agt gene promoter abolishes the stimulatory effect of Oltipraz. Finally,non transgenic adult male mice treated with the Nrf2 activator Oltipraz, upregulated Nrf2 and Agt expression in mouse RPTs, an effect that was
vi
normalized by Trigonelline. These data identify a novel mechanism via which Nrf2 mediates the stimulation of intrarenal Agt gene expression and activates the RAS through whichHG/reactive oxygen species (ROS) induce hypertension and renal injury in diabetic mice. Our findings demonstrate that the insulin induced hnRNP F and hnRNP K gene expression play a protective role in the preventing hypertension. Catalase overexpression, in RPT's, attenuates Nrf2 activation and lowers the SBP in Akita mice.
Key words: Kidney, angiotensinogen, hnRNP F, hnRNP K, glucose, insulin, Nrf2, Oltiparz, trigonelline, Akita, hypertension.
vii
Table of contents
Résumé……….. i
Abstract ……… iv
Table of contents……… vii
List of tables………. xi
List of figures……… xii
List of abbreviations……… xiv
Acknowledgments……… xviii
Chapter 1 - Introduction 1.1 Kidney physiology and histology……… 1
1.1.1 Renal physiology ………. 1
1.1 .2 Renal histology……….. 2
1.1.2.1 The nephron……… 3
1.1.2.1.1 Nephron components……… 3
1.2 Kidney disease……….. 7
1.2.1 Chronic Kidney Disease Prevalence……….. 8
1.2.2 Laboratory Measurements for Kidney Disease………. 8
1.2.2.1 Assessment of Proteinuria………. 8
1.2.2.2 Estimation of Glomerular Filtration Rat (eGFR)…………. 9
1.3 History of Diabetes………... 10
1.3.1 Prevalence of diabetes ……… 11
1.3.2 Types of diabetes mellitus………... 12
1.3.2.1Type 1 diabetes mellitus (T1D) ………. 12
1.3.2 .2 Type 2 diabetes mellitus (T2D) ………... 14
1.3.2.3 Gestational diabetes mellitus (GDM)………… ………… 14
1.3.3 Diabetic nephropathy (DN)……….. 14
1.3.3.1 Role of podocytes in diabetic nephropathy……… 15
1.3.3.1.1 Advanced Glycosylation End Products (AGEs)…… 16
viii
1.3.3.1.3 Increased Polyol Pathway Flux………... 19
1.4 Insulin………. 21
1.4.1 Phosphatidylinositol-3 kinase (PI-3 Kinase) pathway……. 22
1.4.2 The mitogenic signaling pathway or the Ras/MAP kinase cascade………. 23
1.5 The Renin-Angiotensin system ………. 25
1.5.1 Renin and Pro-Renin……… 25
1.5.1.1 Prorenin receptor………. 26
1.5.2 Angiotensin converting enzyme (ACE)………... 27
1.5.3 Angiotensin converting enzyme 2 (ACE2)………. 28
1.5.4 Angiotensinogen and angiotensins……… 29
1.5.5 Angiotensins receptors………. 31
1.5.5.1 Angiotensin II type 1 receptor (AT1R)……….. 31
1.5.5.2 Angiotensin II type 2 receptor (AT2R) ………. 32
1.5.5.3 AT4R……….. 32
1.5.5.4 Mas oncogene receptor (MAS). ………... 33
1.6 Reactive oxygen species ……… 35
1.6.1 Endogenous Sources of ROS……… 35
1.6.2 Oxidative stress ……… 37
1.6.3 Consequences of oxidative stress………. 37
1.6.4 Diabetic nephropathy and ROS……… 38
1.6.5 Antioxidant ……….. 38
1.6.5.1 Catalase………. 39
1.7 Promoter………. 40
1.7.1 Promoter function ……… 41
1.7.1.1 Promoter analysis and software……….. 41
1.7.2 Transcription factors (TFs)……….. 42
1.7.2.1 The heterogeneous nuclear ribonucleoproteins………. 43 1.7.2.1.1 Heterogeneous nuclear ribonucleoprotein K
(hnRNP K) characterization………..
ix
1.7.2.1.2 HnRNP K localization and function………. 45
1.7.3 Heterogeneounuclear ribonucleoprotein F (hnRNP F)…….. 46
1.7.3.1 HnRNP F and other hnRNPs……… 47
1.7.4 The CNC-bZIP family……… 48
1.7.4.1 What is Nrf2? ………. 49
1.7.5 Keap1……….. 51
1.7.5.1 Nrf2 pathways ………. 51
1.7.5.2 Oltipraz and Trigonelline compunds………... 53
1.8 Experimental animal models………... 55
1.8.1 Induction of type 1 diabetes………. 55
1.8.1.1 Chemical induction ……… 55
1.8.1.2 Genetically manipulated mice……….. 56
1.8.2 Mouse models of hypertension……… 60
1.8.2.1 Genetically modified animal models……… 60
1.8.2.2 Transgenic models of the Renin Angiotensin System …. 61 1.8.3 Knockout models and RAS system………. 63
1.8.4 Therapy 64 1.9 Objectives and hypothesis of this study………... 68
Chapter 2- Article 1Heterogeneous Nuclear Ribonucleoprotein F and K Mediate Insulin Inhibition of Renal Angiotensinogen Gene Expression and Prevention of Hypertension and Kidney Injury in Diabetic Mice... 71 Abstract... . 72 Introduction……….. 74
Materials and methods. ………. 75
Results ………. 82
Discussion ……….. 87
Achnowledgments ………. 92 Funding...
x
References ………. 93
Chapter 3 - Article 2 : Catalase Overexpression Prevents Nuclear Factor Erythroid 2-Related Factor 2 Stimulation of Renal Angiotensinogen Gene Expression, Hypertension and Kidney Injury in Diabetic Mice... 118
Abstract... . 119 Introduction……….. 120
Materials and methods. ………. 122
Results ………. 128 Discussion ……….. 134 Achnowledgments ………. 141 Dislosure... 142 References ………. 142 Chapter - 4 : Discussion……….……… 168
4.1 Advantage of hyperinsulinemic-euglycemic clamp ……… 171
4.3 Promoter and transgenic mice ………...……….... 174
4.3.1 Androgen-regulated protein (KAP) promoter……….. 174
4.4 HnRNP F and K knockout mice……… 177
4.4 Catalase gene overexpression... 178
4.5 NADPH oxidase and Nox4……… 179
4.6 Advantages and Disadvantages of Nrf2 Activation…..………….. 180
Chapter 5 : Perspectives of Research and Unpublished Results ………... 185
5.1Hyperinsulinemic-euglycemic clamp and gene expression …….. 186
5.2 Generation of hnRNP K transgenic mice………... 188
5-3 Rat hhnRNP F and hnRNP K gene promoters……….. 193
5-4 Transcription factors and angiotensinogen promoter………... 195
xi
List of Tables
Table 1-1 Substances filtered and reabsorbed by the kidney
per 24 hours
Table 1-2 Stages of chronic kidney disease, as defined by
KDOQI.
Table 1-3 shows the milestones of Renin–Angiotensin
System (RAS) History
Table 1-4 The amino acid sequences of angiotensin peptides
(substrate), and enzymes that convert the substrate into another angiotensin
Table 1-5 shows types of radicals oxidative stress conditions
Table 1-6 group of cellular defense genes and its role in ROS
neutralization
Table 1-7 Some mouse models of type 1 diabetes used to
study DN
Table 1-8 Advantages and disadvantages of different
xii
List of Figures
Figure 1-1 Schematic representation of a human kidney section.
Figure 1-2 H&E-stained image of the glomerulus.
Figure 1-3 Components of the nephron and the collecting duct system.
Figure 1-4 Structural abnormalities effect on albuminuria.
Figure 1-5 IDF regions and global projections of the number of people
with diabetes.
Figure 1-6 Proposed mechanisms for the pathogenesis of DN.
Figure 1-7 Normal intracellular insulin signaling transduction pathway.
Figue 1-8 Enzymatic cascade of the RAS and principal functions.
Figure 1-9 The present view of the expanded renin-angiotensin
system.
Figure 1-10 Human insulin gene promoter.
Figure 1-11 Diagrammatic illustration of hnRNP K protein modular
domains.
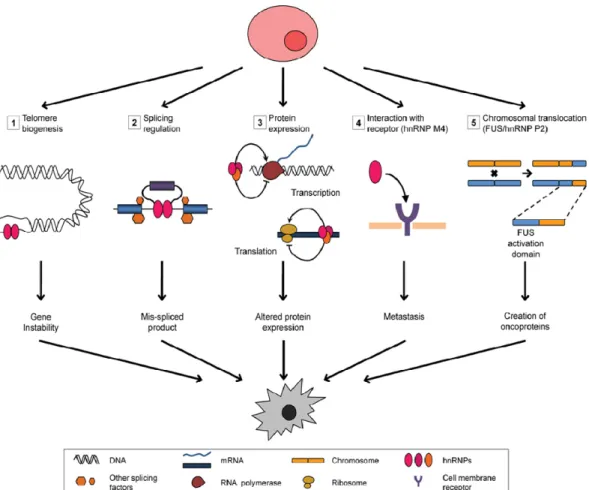
Figure 1-12 hnRNPs can contribute to carcinogenesis.
Figure 1-13 Schematic representation for Nrf2 and keap1 domain
composition.
Figure 1-14 General scheme for the induction of cytoprotective genes
through the KEAP1–NRF2–ARE-signaling pathway
Figure 1-15 Schematic diagram shows the balance between ACE and
ACE2
Figure 4-1 The effects of high glucose and insulin on the RAS and
hnRNPs
Figure 5-1 The hyperinsulinemic-euglycemic clamp
Figure 5-2 HnRNP F, hnRNP K, Agt and Nrf2 gene expression in
hyperinsulinemic-euglycemic experement
Figure 5-3 Generation of hnRNP K-Tg.
xiii
Figure 5-5 Effect of hnRNP K overexpression on kidney structure and
glomerulotubular fibrosis
Figure 5-6 Overexpression of hnRNP K attenuates systemic
hypertension in Akita Tg mice.
Figure 5-7 Rat hnRNP F gene promoter sequence and analysis
Figure 5-8 Rat hnRNP K gene promoter sequence and analysis
xiv
List of abbreviations
ACE Angiotensin converting enzymes.
ACE2 Angiotensin-converting enzyme-2
ACEi ACE inhibitors.
ACR Albumin/creatinine ratio
AGEs Advanced glycosylation end products.
Agt Angiotensinogen
Ang I Angiotensin I
Ang II Angiotensin II
Ang IV Angiotensin IV
Ang1–7 Angiotensin 1-7
APS Pleckstrin homology.
AR Aldose reductase.
ARBs Angiotensin receptor blockers.
ARE Antioxidant response element.
AT1R Angiotensin II type 1 receptor.
AT2R Angiotensin II type 2 receptor.
Cat Catalase
CKD Chronic kidney disease
CNC Cap ‘n’ collar
CTGF Connective tissue growth factor
Cul3 Cullin 3
DAG Diacylglycerol.
DM Diabetes mellitus.
DN Diabetic nephropathy
ECM Extracellular matrix.
eGFR Estimated glomerular filtration rate
eIF4E Eukaryotic translation initiation factor 4E
xv
ERK Extracellular-signal-regulated kinases
ESRD End stage of renal disease
GBM Glomerular basement membrane
GDM Gestational diabetes Mellitus
GFR Glomerular filtration rate
Grb2 Growth factor receptor binder-2.
GSH Glutathione
GSHPx Glutathion Peroxidase.
gsk3 Glycogen synthase kinase-3.
GTFs General transcription factors.
H&E Hematoxylin and eosin
H2O2 Hydrogen peroxide.
HG High glucose
hnRNP F Heterogenous nuclear ribonucleoprotein F
hnRNPK Heterogenous nuclear ribonucleoprotein K
hnRNPs Heterogenous nuclear ribonucleoproteins
HO-1 Hemoxygenase-1
hrACE2 Human recombinant ACE2
IDF Diabetes federation.
IGF-1 Insulin-like growth factor 1
IL-6 Interleukin-6
IR Insulin receptor
IRE Insulin-responsive element
IRR Insulin receptor-related
IRSs Insulin receptor substrates
JGA Juxtaglomerular apparatus
KDOQI Kidney disease outcomes quality initiative
Keap1 Kelch-like ECH-associated protein 1
MAPK Mitogen-activated protein kinase.
xvi
Mapkkk Map kinase kinase kinase.
MAS Mas oncogene receptor
MAU Microalbuminuria
NF-κB Nuclear transcription factor κappa B.
NKF National kidney foundation
NO Nitric oxide.
NOD The non-obese diabetic.
NOS Nitric oxide synthase
NQO1 Quinone oxidoreductase 1.
Nrf1 Nuclear respiratory factor 1
Nrf2 Erythroid 2-related factor 2
PAS Periodic acid schiff
PDK1 Phosphoinositide-dependant Kinase1.
PI3K Phosphoatidylinositol 3-kinase.
PKC Protein kinase C.
RAGE Receptor of advanced glycosylation end products
RAS Renin-Angiotensin System
RBPs RNA-binding proteins
rMLC-2 Rat myosin light chain-2.
RNA Pol II RNA polymerase II
ROS Reactive oxygen species
RPTCs Renal proximal tubular cells
SBP Systolic blood pressure
SDH Sorbitol dehydrogenase.
SH2 Src homology2.
siRNA Small interfering RNA
SOD Superoxide dismutases.
ssDNA Single strand DNA
STZ Streptozotocin
xvii
T2D Type 2 diabetes mellitus.
TBM Tubular basement membrane.
TBP TATA-binding protein
TF Transcription factors
TFBSs Transcription factors binding sites
TGF-β Transforming growth factor.
TNF-α Tumor necrosis factor- α
TSS Transcriptional start site.
UTR Untranslated region.
xviii
Acknowledgements
First of all, I would like to express my sincere thanks to my wife Rania and my mother for their support and encouragements. First and foremost, my deepest appreciation goes to mysupervisor, Prof. Dr. John S.D. Chan for his support, trust, guidance, and mentorship, my aspiration of exploring into a new research territory for my PhD projects. His insightful encouragements helped me to develop my passion for science and gave me the confidence to pursue my career in science. It has been a precious experience to be Dr. Chan’s student. I would also like to thank my co-director Dr. Shao-Ling Zhang for heradvises andacademic direction. Special thanks go to our lab manger Isabelle Chenier for her guidance, advice and support. I would like to acknowledge a special thanks to all the lab members including Dr. Chao-Sheng Lo, Shiao-Ying Chang, Youssefou Aliou, Xin-Ping Zhao, Min-Chun Liao, Yixuan Shi, Anindya Ghosh, and Henry Nchienzia.Last but not least, I am highly indebted to my parents for giving me the strength of will to pursue what I believed and for giving me strength of character to lead a righteous life. Without them and all the sacrifices they made, I wouldn't be the same person.
xix
1 1.1 Kidney physiology and histology 1.1.1 Renal physiology
The kidneys are paired retroperitoneal organs. In human adults, each kidney weighs about 150 g and is approximately 11-12 cm in length, 5.0-7.5 cm in width, and 2.5-3.0 cm in thickness [1]. The kidney's principal role is to regulate the composition and volume of the extracellular fluid by regulating water and electrolyte balance, osmotic and arterial blood pressure and also secreting the renin and angiotensin II hormones. The kidneys also regulate ion homeostasis in blood plasma maintaining the concentrations of sodium, chloride, potassium, and hydrogen independently. The kidneys excrete metabolic waste as by-products of metabolism, including urea, uric acid and creatinine. In addition, they produce specific hormones such as erythropoietin and the active form of vitamin D (1,25 -dihydroxy vitamin D3) while also playing an essential role in acid–base balance [2]. Table 1-1 shows the quantities of filtered and reabsorbed substances by the kidney in a 24 hr period.
2 1.1.2 Renal histology
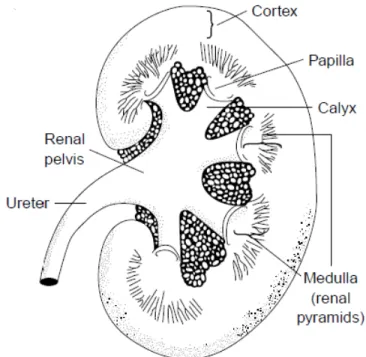
The cross section of a kidney contains two regions, the cortex in the outer layer and the medulla in the inner layer. The cortex appears granular due to the spherical capillary tufts of the glomeruli. The glomeruli, convoluted tubules, and cortical collecting ducts are found in the cortex. The medulla has a striated appearance that results from the parallel arrangement of the loops of Henle, medullary collecting ducts, and blood vessels and can be divided into two regions: the outer and inner medulla [1, 2]. In a human kidney section, there are regional differences in the structure. The outer portion (cortex) contains all the glomeruli. The collecting ducts form a large portion of the inner kidney (medulla), giving it a striped, pyramid-like appearance, and these drains into the renal pelvis. The papilla is in the inner portion of the medulla [2]. See Figure 1-1.
Figure 1-1: Schematic representation of a human kidney section shows regional differences. The outer portion (cortex) contains all the glomeruli. The collecting ducts form a large portion of the inner kidney (medulla), giving it a striped, pyramid-like appearance and these drain into the renal pelvis. The papilla is located in the inner portion of the medulla [2].
3 1.1.2.1 The nephron
The basic functional unit of the kidney is the nephron. Each nephron is an independent urine-forming unit. The number of nephrons per kidney is about one million in the human adult kidney and 30,000 in a rat kidney [1, 4]. Each nephron is capable of filtering blood, regulating the water volume and concentration of soluble substances, reabsorbing useful components, and excreting the rest. Three groups of nephrons are distinguishable, based on the location of their glomeruli in the cortex: the superficial, midcortical, and juxtamedullary nephrons. A nephron consists of two functionally different parts, the glomerulus and the tubules [2, 5].
1.1.2.1.1 Nephron components A) The glomerulus
The renal corpuscle is the initial blood-filtering component of the nephron and is composed of a capillary network lined with a thin layer of endothelial cells (glomerulus). The glomerulus is a capillary network surrounded by the Bowman’s capsule. In the vertebrate kidney, the Bowman’s capsule is a double-walled, cup-shaped structure surrounding the glomerulus of each nephron [6] that serves as a filter for organic waste, excess inorganic salts, and water. The average diameter of the glomerulus is approximately 200 μm in the human kidney and 120 μm in the rat kidney [6]. The capillary structure of the glomerulus is permeable and increases the surface area for blood filtration [7].The mean area of filtration surface per glomerulus has been reported to be 0.203 mm2 in the human kidney [8] and 0.184 mm2 in the rat kidney [9]. The glomerular filtration barrier allows the filtration of small molecules but restricts the passage of macromolecules (e.g. plasma proteins). The glomerular filtration barrier consists of three layers: the endothelium or the lamina fenestra [3, 4], the basement membrane [5], and the podocytes with their slit diaphragms [6]. Podocytes are polarized, highly specialized and fully differentiated epithelial cells [5]. They line the urinary side of the
4
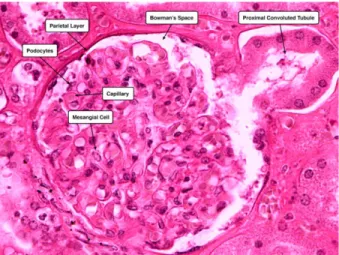
glomerular basement membrane (GBM), which functions as a fine filter permitting the permeability of molecules smaller than albumin. The glomerular ultrafiltrate passes into the urinary space of Bowman’s capsule. Fluid that comes out of the glomerulus is a plasma-like substance that flows into the renal tubule. The filtrate flows downstream the nephron through the tubule lumen, where tubular activity alters its composition and volume [6, 10].The appearance of protein in the urine indicates a compromised glomerular filtration barrier [6]. In diabetic nephropathy, proteinuria and microalbuminuria are used as clinical biomarkers [11]. Fig 1-2 shows renal corpuscle staining.
Figure 1-2: H&E-stained image of the glomerulus. Identified are the mesangial cells of the glomerulus and the podocytes of the visceral layer of Bowman’s capsule.http://medcell.med.yale.edu/histology/urinary_system_lab/renal_corpus cle.php.
B) Renal tubules
The renal tubule, which begins at and leads out of the Bowman’s capsule, is made up of a single layer of epithelial cells resting on a basement membrane. The renal tubules change the composition of filtrate by reabsorbing most of the useful organic nutrients and water that enter the tubular system. It also secretes additional waste products that do not enter with the ultrafiltrate. The tubule is divided into several components
5
including the proximal tubule, the descending and ascending loop of Henle, and the distal convoluted tubule and collecting duct. The cells in the tubular wall of each tubular region are structurally different and have distinct physiological properties [2]. A schematic representation of the nephron components is shown on Figure 1-3.
i) The proximal tubule
The proximal convoluted tubule comprises the first 60% of the proximal tubule [5]. It is about 10 mm in the rabbit [12], 8 mm in the rat, 4 to 5 mm in the mouse [13], and approximately 14 mm in the human. The most characteristic feature of the proximal tubules is the presence of an edge "brush" on the luminal surface of the tubules, which increases the surface area for reabsorption [14]. In the rat, three morphologically different segments have been identified [15]. The S1 segment is at the proximal end of the proximal tubule starting at the glomerulus and constitutes approximately two thirds of the pars convoluta. The S2 segment consists of the residual of the pars convoluta and the proximal component of the pars recta. The S3 segment contains the rest of the proximal tubule [6, 15]. The proximal tubule is responsible for reabsorbing all of the filtered glucose and amino acids and reabsorbing 70% of filtered solutes and water. It secretes various organic anions and cations [2]. Renal proximal tubular cells express all components of the RAS and overexpression of angiotensinogen increases tubular apoptosis in STZ-induced diabetes mice [16].
ii) The loop of Henle
The loop of Henle, connected to the proximal tubule is composed of different segments performing distinct functions: the descending limb, the thin and the thick ascending limb and the medullary and cortical thick ascending limb. The loop of Henle structure is responsible for the specific composition of aqueous ionic channels and urine concentration. As a
6
whole, it reabsorbs about 20% of the filtered sodium and chloride and 10% of the filtered water. The end of the loop of Henle contains cells of the macula densa, which monitor the sodium and chloride content of the lumen generating signals that influence renal function, specifically via the renin-angiotensin system [2].
Figure 1-3: Components of the nephron and the collecting duct system. Onthe left is a long-looped juxtamedullary nephron;on the right is a superficial cortical nephron [5].
iii) Distal convoluted tubule
The distal nephron is considered to be the portion of the renal tubule beginning with the thick ascending limb of the loop of Henle and ending with the papillary-collecting duct. The distal convoluted tubuleis located immediately after the macula densa [17, 18]. The distal nephron is responsible for reabsorbing lower quantities of salt and water consisting of 9% of the filtered NaCl and 19% of the filtered water. Steep gradients for small ions and water can occur in the distal nephron. The distal
7
tubules are responsible for reabsorbing a certain amount of water and sodium ions. The aqueous channels in the apical and basal surfaces of these tubules, in turn, control the amount of reabsorbed substance [2].
1.2 Kidney disease
Kidney disease is associated with a significant reduction in both the length and quality of life [19]. Kidney dysfunction accelerates the onset and progression of cardiovascular disease, and eventually worsens its prognosis [20]. Kidney disease can arise from complications due to diabetes leading to diabetic nephropathy or from hypertension, widespread risk factors in the population. Other renal diseases include anatomic and metabolic kidney diseases and kidney damage due to certain nephrotoxic drugs. In chronic kidney disease (CKD) the damage in the kidneys decreases their ability to carry out their appropriate functions [21, 22]. The guidelines set forth by the Kidney Disease Outcomes Quality Initiative (KDOQI) define CKD as kidney damage occurring for 3 or more months caused by structural or functional abnormalities with or without a decreased Glomerular Filtration rate (GFR) [23, 24]. There are several factors that contribute to CDK but the most significant risk factors are diabetes and hypertension and are collectively responsible for up to 66% of the CKD cases. Hyperglycemia and high blood pressure cause damage to multiple organs including the kidney, heart, eye as well as the blood vessels. CKD eventually leads to End Stage Renal Disease (ESRD) characterized by kidney function of less than 10% of its full capacity [2]. CKD increases the rate of morbidity, mortality, and hospitalizations and at this stage patients require kidney transplants to survive.
8 1.2.1 Chronic Kidney Disease Prevalence
Patients with CKD are more likely to die of cardiovascular disease (CVD) and a minority progresses to ESRD [25, 26]. The prevalence of Stage 2-5 CKD has continued to increase since 1988 right along with increases in the prevalence of diabetes and hypertension, which are etiologic in approximately 40% and 25% of CKD cases aged more than 20 years old, respectively. Hypertension is triggered during stages 3–5 CKD while acid-base imbalance, dyslipidemia, and loss of glucose homeostasis occur later [27]. In Stage 4 CKD, death is a competing risk for progression to ESRD with about 17% of Stage 4 CKD progressing to Stage 5 [26]. CKD increases CVD morbidity and mortality risks in diabetics by 2- to 4-fold and in patients with hypertension and diabetes by 4- to 8-fold. Furthermore, CKD-attributable CVD risk increases several fold through stages 3–5 CKD. In 2010, the healthcare-associated costs for ESRD were $28 billion and expected to almost double to $54 billion by 2020 [27].
1.2.2 Laboratory Measurements for Kidney Disease
Kidney damage is defined by any one of the following laboratory tests: persistent proteinuria as well as estimated GFR (eGFR) less than 60ml/min/1.73 m2 on two occasions separated by at least 3 months [28].
1.2.2.1 Assessment of Proteinuria
Assessment of albumin and/or protein excretion in the urine is a key step in the early detection and appropriate management of CKD. In the urine of healthy people, albumin is normally present in small quantities. The levels of albumin and other proteins rapidly rise when the kidneys are damaged, a phenomena referred to as proteinuria [29, 30]. Moreover, proteinuria tightly correlates with quantitative histological measures of interstitial fibrosis [31]. Microalbuminuria (MAU) refers to the increase in the concentration of urinary albumin that is indicative of either systemic or
9
renal malfunction. In CKD, the kidneys excrete more than 30 milligrams of albumin per gram of creatinine in their urine, regardless of the change in the eGFR [30]. In CKD, the albumin has to cross the glomerular filtration barrier under the effect of intraglomerular pressure increases, as well as the loss of the negatively-charged glycosaminoglycans in the cellular basement membrane, which lead to an enlargement in the pore size of the basement membrane and the leaking of albumin from the kidney to the urine [32]. Structural abnormalities that cause albuminuria are shown in Figure 1-4.
Figure 1-4: Structural abnormalities have an effect on albuminuria [32].
1.2.2.2 Estimation of Glomerular Filtration Rate (GFR)
The kidneys have a high blood flow. Glomerular filtration involves the ultrafiltration of plasma in the glomerulus [8]. The glomerular filtration barrier functions as a fine molecular sieve allowing small molecules to pass while restricting macromolecules such as plasma proteins. Kidney function can be tested by measuring the glomerular filtration rate (GFR) [33]. It is defined as the rate at which plasma is filtered by the kidney glomeruli [2]. Ideally, the GFR should be measured by inulin levels. Inulin has many advantages; it is filterable by the glomeruli, non-toxic, not reabsorbed or secreted by the kidney tubules, and it is detectable in both plasma and urine samples [34]. The National Kidney Foundation (NKF)
initiate physic five st Table 1.3 Hi Diabe mana was f ed the Kidn cians in ide tages are s 1-2: Stages istory of dia etes is a w gement pro first mentio ney Diseas entifying, s summarized of chronic k abetes orldwide ep ograms its r ned by the 10 e Outcome staging, and d in Table 1 kidney disea pidemic, an rate will con e ancient E 0 e Quality In d treating k -2. ase, as defin nd without ntinue to gl Egyptians. I itiative (KD kidney dise ed by KDOQ effective p obally incre n 1874, th DOQI) to as ease [23]. T QI. prevention a ease. Diabe e Egyptolo ssist The and etes ogist
11
Georg Ebers published one of the oldest medical documents written by an Egyptian, around 1530 BC, called “Ebers Papyrus” [35]. In it, there is mention of specific symptoms indicative of diabetes mellitus and a description of a condition of “too great emptying of the urine”. For the treatment of this condition, ancient Egyptian physicians advocated the use of wheat grains, fruit, and sweet beer [36]. In 130–200 AD, the Greek physician Aretaeus noted a disease with symptoms of constant thirst, excessive urination and weight loss. He named the condition ‘diabetes’ meaning ‘flowing through’ [35]. The first clear reference to diabetes was made by an Arab physician, Avicenna (980–1037 AD), who described in detail the exact clinical features and complications of the disease and its progress [37]. Indian physicians developed the first clinical test for diabetes. They observed that the urine from people with diabetes attracted ants and flies. They named the condition “honey urine”[36]. In 1815, Eugene Chevreul proved that the sugar in urine of individuals with diabetes was glucose[36]. The diagnostic test developed by Von Fehling became an acceptable quantitative test for glucose in urine in 1848. As a result, in the nineteenth century, glucosuria became an accepted diagnostic criterion for diabetes. In the 20th century Bang, Folin, Lewis, Benedict, Shaffer and many others pioneered laboratory methods for quantitative blood sugar [35].
1.3.1 Prevalence of diabetes
Diabetes is on the rise worldwide and countries are struggling to keep pace. Over the past three decades, there has been an explosive increase in the prevalence of diabetes mellitus (DM). Diabetes mellitus is a complicated, chronic disorder characterized by either insufficient insulin production by the beta cells of the pancreas or by cellular resistance to insulin. Insulin insufficiency results in elevated blood glucose levels, or hyperglycemia [38]. According to the International Diabetes Federation (IDF), one in ten of the world’s population will have diabetes by 2035.
12
Today, there are 382 million people living with diabetes. A further 316 million with impaired glucose tolerance are at high risk from the disease – an alarming number that is set to reach 471 million by 2035. IDF’s most recent estimates show that people living with diabetes will surge from 382 million to 592 million people by 2035 [39]. As a result, individuals with diabetes are at greater risk for a number of disorders or complications, including myocardial infarction, cerebrovascular accident (stroke), blindness, kidney disease, and lower limb amputations. Diabetes complications are responsible for 5.1 million deaths and cost USD 548 billion in healthcare spending (www.idf.org/diabetesatlas).There is considerable data indicating that the chronic elevation of plasma glucose causes many of the major complications of diabetes, including nephropathy, retinopathy, neuropathy, and macro- and microvascular damage [40]. Insulin and oral antidiabetic drugs, along with diet and exercise, are the cornerstones of treatment for diabetes mellitus [41]. They are used to prevent episodes of hypoglycemia and to normalize carbohydrate metabolism. The new estimates show an increasing trend toward younger and younger people developingdiabetes, a trend that is troubling for future generations, Figure 1-5 (www.idf.org/diabetesatlas). 1.3.2 Types of diabetes mellitus
Diabetes encompasses a group of metabolic diseases characterized by hyperglycemia resulting from defects in insulin secretion, insulin action or both[38]. There are three major types of diabetes:
1.3.2.1Type 1 diabetes mellitus (T1D)
Previously, T1D was known as insulin-dependent diabetes. In T1D the pancreas does not produce adequate amounts of insulin to regulate glucose levels in the blood. Autoimmune destruction of the pancreatic beta cells causes the development of T1D. The immune system destroys the beta cells that produce insulin in the pancreas [42] and insulin therapy
is req result Figure diabet uired for th s in death. e 1-5: IDF R tes (20-79 ye e treatmen Regions and ears), 2013 13 t of this typ d global proj and 2035. pe of diabet ojections of t
tes, the abs
the number
sence of wh
r of people
hich
14 1.3.2.2 Type 2 diabetes mellitus (T2D)
T2D, formerlyknown as noninsulin-dependent diabetes is the most common type of diabetes, in which the pancreas does not produce enough insulin, or there is decreased sensitivity to insulin. It is usually seen in adults, but it is increasingly prevalent in children and adolescents [43]. The risk factors for developing diabetes are obesity, poor diet, physical inactivity, advancing age, ethnicity and high blood glucose during pregnancy,affecting the unborn child and genetics [43].
1.3.2.3 Gestational diabetes mellitus (GDM)
GDM occurs in a minority of pregnant women around the 24th week of
pregnancy [44, 45] in whom a resistance to insulin and resulting high blood glucose occur. Gestational diabetes in mothers normally resolves itself after the birth of the child. However, women who have had gestational diabetes are at a higher risk of T2D later in life [46]. Gestational diabetes affects the babies by increasing their risk of developing T2D later in life [47].
1.3.3 Diabetic nephropathy (DN)
DN, a common diabetic complication, is a clinical syndrome characterized by progressive renal insufficiency in the setting of hyperglycemia, persistent albuminuria, hypertension, decreased GFR, and a highly-elevated risk of cardiovascular morbidity and mortality [48]. In most Western countries, diabetes has become the most common cause of kidney failure or end-stage renal disease. DN is a silent disease that usu-ally manifests itself after 10 years’ duration of T1D, but may be present at diagnosis of T2D [49]. Type 1 and type 2 diabetic subjects accounted for 44% of new cases of kidney dysfunction in 2008 [50]. Several factors along with diabetes contribute to inducing renal lesion damage, including increased systemic and intraglomerular pressure, as well as activation of the RAS and endothelin [51]. In DN, the most important structural
15
abnormality in the kidney glomerulus is thickening of the glomerular basement membrane (GBM) and mesangial expansion [52]. The GBM thickening change has been recognized as early as 1.5 to 2.5 years after the onset of type 1 diabetes [53], while the mesangial expansion can be detected 3.5 to 5.5 years later [54] . Thickening in the Bowman's capsule is also regularly present. The study done by Gambara et al. [53] shows that 33% of patients with proteinuria caused by type 2 diabetes had glomerulosclerosis. In addition to the abnormalities in the glomerulus, changes occurred in the tubules, which include thickening in the tubular basement membrane (TBM) and tubular atrophy [53].
Several mechanisms have been postulated for understanding the effect of hyperglycemia and tissue damage. These mechanisms are glucose-dependent pathways that include advanced glycosylation end products, increased polyol pathway flux, increased hexosamine pathway activity, oxidative stress and protein kinase C activation [55]. These lead to increased proteinuria, glomerulosclerosis and ultimately tubulointerstitial fibrosis. It has been shown that DN is one of the most significant long-term complications in long-terms of morbidity and mortality for individual patients with diabetes[55].
1.3.3.1 Role of podocytes in diabetic nephropathy
Podocyte injury has been demonstrated in DN. Podocytes are sensitive to mechanical force, implying that mechanical stretching could decrease podocyte numbers, reduce proliferation rates [56], and induce podocyte apoptosis, as well as detachment from the GBM [57]. It has been reported that podocyte numbers decrease in T1D and T2D [58] and since they have a limited capacity to renew themselves, the loss of podocytes caused by diabetes has been hypothesized to require the remaining cells to cover a larger area of GBM. Several studies in rats show that reduced nephron numbers lead to glomerular hypertrophy, podocyte injury, the
16
development of proteinuria, foot process widening, and subsequently glomerular sclerosis[58, 59].
1.3.3.1.1 Advanced Glycosylation End Products (AGEs)
Under normal conditions, glucose binds to proteins by a non-enzymatic chemical reaction between its aldehyde and the reactive amino groups in proteins, a reaction named the Maillard reaction [60]. Hyperglycemia increases the non-enzymatic glycation of proteins, lipids, and nucleic acid. These glycated products undergo progressive dehydration, cyclization, and rearrangement to form AGEs [60]. Once AGEs are formed, the reaction is irreversible and the proteins gradually accumulate in the tissue [61]. These advanced products can be involved in the pathogenesis of DN by altering the signal transduction via alteration in the level of soluble signals, such as cytokines, hormones and free radicals [62]. For example, it is reported that glycated albumin products stimulate type IV collagen production and inhibit proliferation in cultured mesangial cells [63]. Among the many potential pathogenic factors responsible for the development of diabetic microvascular disease, the advanced glycation pathway is thought to be a pivotal process in mediating tissue damage. The kidney contributes to increasing the circulation of AGE concentrations through dysfunctional AGE clearance. Studies in diabetic patients show that the level of AGEs are significantly increased with the progression to microalbuminuria, and subsequently, to overt nephropathy [64].
AGEs exert their action through the formation of protein cross-links altering the structure and function of the extracellular matrix (ECM), in addition to interacting with specific cell surface receptors [65]. The diverse action of AGE occurs mainly through the multi-ligand receptor RAGE, a member of the immunoglobulin superfamily of cell surface molecules [66]. AGE binding sites were identified in proximal tubules of the rat kidney, but
17
it is unclear whether they represent one of the known AGE receptors [67]. Numerous studies have implicated RAGEs in the development and progression of DN [67]. Yamamoto et al. reported an elevation in albuminuria, mesangial cell expansion, and advanced glomerulosclerosis in diabetic Tg mice overexpressing RAGE genes in vascular cells [68]. In contrast, the diabetic RAGE knockout mice showed less renal injury, especially in the mesangial expansion or the GBM thickening compared to the control mice [69, 70].
AGEs induce activation of ROS and upregulate inflammatory gene expression. The intracellular accumulation of AGEs initiates several signaling events by producing free radicals[67]. In turn, ROS activation initiates several intracellular pathways including PKC, mitogen-activated protein kinase (MAPK), nuclear transcription factor (NF-κB), and increases the production of cytokines, including transforming growth factor (TGF-β), interleukin (IL-6), and tumor necrosis factor (TNF-α) [60, 71]. These downstream AGE-mediate effects exacerbate renal damage. AGE signaling can be blocked in cells by expressing RAGE antisense cDNA or anti-RAGE ribozyme [72]. Furthermore, administration of aminoguanidine (AGN), an AGE inhibitor, attenuates renal AGE accumulation and reduces both albuminuria and mesangial expansion [73].
1.3.3.1.2 Protein Kinase C
Hyperglycemia has been implicated in the pathogenesis of diabetic complications through the activation of the protein kinase C (PKC) system [72, 74]. PKC is a family of at least 13 isoforms of serine and threonine kinases [75]. The various PKC isoenzymes have been subdivided into three classes based on both sequence homology and mechanism of activation: 1) conventional or classical PKCs (cPKCs: PKC-α, PKC-βI, PKC-βII, PKC -γ), which are Ca2+ - sensitive/or dependant and activated
18
by both phosphatidylserine (PS) and the second messenger diacylglycerol (DAG); 2) novel PKCs (nPKCs: PKC-δ, PKC-ε, PKC-η and PKC-θ), which are Ca2+ - independent and regulated by PS and DAG; 3) atypical PKCs (aPKCs: PKC-ζ and PKC-λ/ι) which are Ca2+ - independent and do not require DAG for activation although PS regulate activation [76].
Among various signaling kinases, PKC seems to be a centerpiece in the pathogenesis of DN [70]. PKC-α and PKC-ε expression were increased in glomeruli and renal tubules of STZ diabetic rats, whereasPKC-ζ was decreased in the kidney and heart tissues compared to control [77]. PKC- β contributes to hyperglycemia-induced renal matrix production, whereby PKC- α is involved in the development of albuminuria. The expression of β was examined in human patients with diabetic nephropathy. PKC-β mRNA was increased in the kidney biopsies of diabetic patients as compared to control subjects [78]. Kelly et al. [79]reported that in vivo inhibition of the PKC- β isoform with Ruboxistaurin, in STZ-induced diabetic rats, led to reduction in renal TGF- β 1 expression and structural injury of the kidney, as well as albuminuria. Similarly, in type 2 diabetes, Ruboxistaurin mesylatealso reduces renal abnormalities in db/db mice suggesting a central signaling role in hyperglycemia-induced vascular injury [80]. Furthermore, Chan’s group have reported that PKC-βI activation induces osteopontin mRNA expression in IRPTCs [81]. Manne et al.demonstrated that STZ-induced diabetic PKC-α -/- mice are protected against the development of albuminuria, whereas increased TGF β-1and renal hypertrophy are not prevented [82]. Matthias et al. demonstrated that PKC-β-deficiency (PKC-β -/-) in vivo reduces renal hypertrophy but not albuminuria in the STZ-induced diabetic mouse [83]. Dual inhibition of PKC-α and PKC-β isoforms (homozygous PKC-α/β double knockout) decreased in glomerular hypertrophy, extracellular
19
matrix and TGF-b when compared with wild-type mice after 8 weeks of diabetes [84].
In diabetic conditions, the cellular events of polyols, the generation of AGE products, and ROS activate PKC [72]. It has been shown that hydrogen peroxide (H2O2)can activate PKC either directly or by
increasing DAG production [85]. The potential mechanism for PKC activation by ROS is through redox changes in sulfhydryl groups on PKC isoform cysteine-rich regions. These redox changes may also cause PKC isozymes to be more responsive to DAG activation during signal transduction [86]. Experimental studies show that the coactivation of PKC and MAPK in the presence of high glucose concentrations suggests that these two families of enzymes are linked [87].
1.3.3.1.3 Increased Polyol Pathway Flux
The polyol pathway is one of the glucose metabolic pathways that plays a significant role in the pathogenesis of diabetic complications [55]. Glucose use, in the polyol pathway, is 3% in normoglycemic individuals and 30% in hyperglycemic individuals [88]. In this pathway, two enzymes are involved: aldose reductase (AR), which plays the central role, and sorbitol dehydrogenase (SDH). AR normally reduces toxic aldehydes in cells to inactive alcohols. In the first enzymatic reaction, AR reduces glucose to sorbitol using NADPH as a cofactor. It is important to mention that sorbitol plays a role in balancing the osmotic pressure of extracellular NaCl to prevent cellular dehydration [88]. In the second enzymatic reaction, SDH with its co-factor NAD+ converts sorbitol to fructose [89].
When intracellular glucose becomes elevated in the kidney, it will cause glucose flux through the polyol pathway leading to a marked increase in aldose reductase activity, with accumulation of sorbitol altering the NADPH/NADP+ ratio [72]. NADPH is essential for regenerating critical
20
intracellular antioxidants. Sorbitol production depletes NADPH, consequently reducing glutathione (GSH) levels of nitric oxide (NO) production by the endothelial cells, which increases the susceptibility to intracellular oxidative stress and alters the antioxidant balance [90]. This is in agreement with the Lee et al. study, in which a decreased level of GSH was found in the lenses of AR-Tg mice [91]. In the kidney, studies have shown that AR protein was localized to podocytes and distal convoluted tubules [92]. Type 1 diabetes is associated with increased renal sorbitol and fructose levels [93]. Type 2 diabetic patients had higher serum and urine myo-inositol concentrations and sorbitol excretion than healthy controls [94].In streptozotocin[95]diabetic rats, sorbitol accumulation has been found in isolated glomeruli. The consequences of heightened sorbitol pathway activity include non-enzymatic glycation initiated by fructose, a glycating agent that is ten times more potent than glucose in activating PKC [96]. Theories proposed for the pathogenesis of diabetic nephropathy are illustrated in figure 1-6.
Figure 1-6: Proposed mechanisms for the pathogenesis of diabetic nephropathy [60].
21 1.4 Insulin
Insulin is a peptide hormone discovered in the 1920s. This hormone is secreted by the Beta cells of the pancreatic islets of Langerhans in response to increased circulating glucose levels after a meal [97, 98]. Insulin is implicated in a wide spectrum of biological responses, including blood glucose control and energy metabolism. It acts by stimulating glucose influx and metabolism in adipocytes and muscles, and by inhibiting gluconeogenesis in the liver. Moreover, insulin regulates the transcription of a number of genes and modulates cellular growth and differentiation [99, 100]. Since the discovery of insulin, it has been the subject of extensive research to elucidate its activity in metabolism, gene regulation, protein synthesis, and protein degradation. Impaired insulin action either due to insulin hyposecretion or defects in insulin signalling causes serious problems in glucose homeostasis and subsequently leads to DN [101].
Insulin exerts its action through binding to a transmembrane receptorthat belongs to the large class of tyrosine kinase receptors. Insulin receptors, IGF-1 receptors, and insulin receptor-related (IRR) receptors are members of the insulin receptor family and are structurally related [102, 103]. These members share more than 80% of amino acid sequence identity in the transmembrane domain with lower similarity in the extracellular domain, depending on their specific ligand [103]. The IR consists of two extracellular alpha-subunit and two transmembrane beta-subunit domains linked by disulfide bonds. Insulin bound to the extracellular domain results in receptor autophosphorylation on tyrosine residues [104]. This leads to conformational changes and enhances intrinsic protein tyrosine kinase activities of the transmembrane domain by multi-site tyrosine phosphorylation. The activated IR results in phosphorylation of several cytosolic IR substrates, such as insulin receptor substrates (IRSs), Src homology collagen (Shc) [105], and
22
adaptor protein with pleckstrin homology (APS), Src homology2 (SH2) domains, and Casitas B-lineage lymphoma [106]. The phosphorylated proteins dock downstream effector molecules that contain the SH2 domain, which are then able to activate two key signaling pathways. These pathways are the phosphoatidylinositol 3-kinase (PI3K)-AKT pathway that is responsible for most of the metabolic actions of insulin, and the mitogenic signaling pathway or the Ras/MAP kinase cascade, which regulates the expression of some genes and cooperates with the PI3K pathway to control cell growth and differentiation [107, 108].Figure 1-7 shows the intracellular insulin signaling transduction pathway.
1.4.1 Phosphatidylinositol-3 kinase (PI-3 Kinase) pathway
The phosphorylated IRSs mediate insulin signaling to downstream enzymes by binding to a number of proteins containing the SH2 domain. PI3K is one of the intermediate molecules that promote the insulin signal. Upon activation of PI3K by IRS, PI3K phosphorylates the phosphatidyl inositol lipids in the plasma membrane. Consequently, generated phosphatidyl inositol-3, 4, 5-trisphosphate (PIP3) recruits 3’-phosphoinositide-dependant kinase1 (PDK1). The activated PDK1 interacts with Akt. The serine/threonine protein kinases PDK1 and PKB/Akt to the plasma membrane [109]. It has been shown that AKT regulates the expression of several proteins, including glycogen synthase kinase-3 (GSK3), Glut4, NOS, and p70 s6 kinase involved in glycogen synthesis, glucose transport, vasodilation and protein synthesis, respectively. In adipose tissue PI3K appears to be important for stimulation of Glut4 to enhance glucose transport in adipose tissue [110, 111].
23
1.4.2 The mitogenic signaling pathway or the Ras/MAP kinase Cascade.
The activation of the MAP kinase pathway occurs when the phosphorylated Shc ctivates the growth factor receptor binder-2 (Grb2), which leads to the formation of complexes with the exchange factor mammalian son (mSOS) [112]. Grb2 can be activated by either IRS or Shc. The Grb2-mSOS complex results in subsequent activation of a series of effectors, such as Ras, Raf, MEK and the extracellular signal-regulated kinase (ERK) pathways. It has been shown that Ras is a potent activator of the MAP kinase pathway. The MAP kinase pathway involves the chronological activation of three kinases: Map kinase kinase kinase (Mapkkk), Map kinase kinase (Mapkk), and Map kinase (Mapk) [113]. Activated ERK1/2 phosphorylates a downstream ribosomal protein kinase, p90 rsk. Both ERK1/2 and p90rsk can be translocated to the nucleus where they phosphorylate translocation factors contributing to the mitogenic and growth-promoting effects of insulin. This signaling pathway is mainly implicated in cell growth, survival and differentiation [111, 114]. Zhang et al.demonstrate that insulin prevents the stimulatory effect of high levels of glucose on the expression of the renal ANG gene in IRPTC, at least in part, via the MAPK kinase signal transduction pathway, subsequently inhibiting the activation of the local renal renin-angiotensin system [115].
24
Figure 1-7. Normal intracellular insulin signaling transduction pathway.Akt, protein kinase B; APS, adaptor protein with pleckstrin homology and src homology 2 domains; CAP,Cbl/Cbl-associated protein; Cbl, Cbl family of adapters, which comprises c-Cbl, Cbl-b, and Cbl-c/Cbl-3, is implicated in receptor tyrosine kinase signaling; ERK, extracellular signal-regulated kinases; Fln, flotillin; Grb2, growth factor receptor binding protein 2; GSK-3, glycogen synthase kinase 3; IR, insulin receptor; IRS1, insulin receptor substrate 1; IRS2, insulin receptor substrate 2; JNK, Jun N-terminal kinase; MAPK, mitogen-activated protein kinase; MEK, mitogen-mitogen-activated protein kinase kinase; mTOR, mammaliantarget of rapamycin; NO, nitric oxide; NOS, nitric oxide synthase; P70S6K, ribosomal p70 S6 kinase; PCIs, percutaneous coronary interventions; PDK1, phosphoinositidedependent kinase-1; PI3K, phosphatidylinositol 30-kinase; PKC, protein kinase C; RAF, v-raf-1 murine leukemia viral oncogene homolog 1, raf proto-oncogene serine/ threonine protein kinase; Ras, a small GTP binding protein; Shc, Src homology domain adaptor homolog family member; SOS, mammalian son of sevenless; TC10, Rho familymember GTPase. [111].
1.5 Th The re hormo power home blood hyper demo hyper conse Goldb true p angiot RAS i Table 1.5.1 Renin cleave the c he renin-an enin-angiot onal circula rful hormo ostasis, an pressure c rtensive age nstrated th rtension in equent incre blatt confirm pressor m tensinogen is detailed i 1-3 shows t Renin and n, also know es angioten cascade g ngiotensin s tensin syste ating system ne system nd arterial p control was ent in extra hat constric dogs due ease in stre med that the aterial is n [117]. Th in Table 1-3 he milestone Pro-Renin wn as ang nsinogen in generating 25 system em (RAS) h m. Now, RA m that regu pressure [1 s initiated in acts of rab cting the r to a redu ength and e renin was known as e historica 3. es of renin–a iotensinoge nto angiote different 5 had been p AS is acce ulates sodi 16]. Resea n 1898 by bit kidney. renal arter uction in th blood pres s acting via angiotens al context o angiotensin enase, is a ensin I, the angiotens previously th epted as th ium balanc arch on the the discov In 1934, G ries results he vascula sure [117, a plasma sin and its of discover system histo an aspartyl e rate-limiti ins. In th hought of a e body’s m ce, body f e physiology ery of renin Goldblatt et s in persist ar area wit 118]. Later substrate. T s precursor ries related ory [117]. protease t ng reaction he kidney as a most fluid y of n, a t al. tent h a r on The r is d to that n in ,the
26
juxtaglomerular apparatus (JGA) is the major site of renin synthesis [119].The active form of renin contains 340 amino acids [120]. Renin is produced from several proteolytic stages of pre-prorenin. The 406 amino acid of pre-prorenin enters the endoplasmic reticulum (ER) [121] in which the N-terminal segment (the pre-) that acts as a signal peptide is cleaved, yielding prorenin. Prorenin enters the Golgi apparatus resulting in prorenin granules that are either secreted or fused to form larger secretory granules. Consequently, as these granules mature, active renin gets glycosylated and released by exocytosis [122]. Besides the kidney (glomeruli, tubules, and vessels), adrenal glands, ovaries, testis, placenta, and retina also produce prorenin [122, 123]. Prorenin was considered to be an inactive pro-hormone that acted as an inactive precursor of renin [124]. It is now thought that prorenin may have its own activity or is converted to renin in the circulation or local tissue. There is evidence to support the special activity of prorenin [125]. There is a correlation between circulatory renin and prorenin concentration. In DN, prorenin concentration may increase in an isolated manner [126, 127]. In the kidney, it has been suggested that prorenin uptake and intrarenal activation of the kidney RAS is responsible for inducing renal damage and microvascular changes [128].
1.5.1.1 Prorenin receptor
The (pro)renin receptor ((P)RR) is a single transmembrane protein, with 350–amino acid residue, that binds prorenin and renin [129]. (P)RR is abundant in the heart, brain and placenta with lower levels being found in kidney and liver [130] as well as lesser expression in the visceral and subcutaneous adipose tissue[131]. (P)RR is a highly conserved protein in humans, rats, and mice.The binding of prorenin and renin to (P)RR is of pivotal importance with regard to the physiology of the local RAS, since it provides a mechanism to generate ANG II in a local tissue in addition to the ANG II circulating in plasma. Moreover, the binding of prorenin
27
induces intracellular signaling and the activation of the mitogen-activated protein (MAP) kinases ERK1/2, leading to upregulation of TGF-β1, collagen 1, and fibronectinindependent of angiotensin (Ang) II generation. Targeting of the renin receptor mRNA with siRNA blocked ERK activation and induction of TGF-beta1 [132, 133]. Additionally, (P)RR full-length cleavage by furin at a single site results in the production of a soluble form of the receptor, which is detectable in plasma. Soluble (P)RR is hypothesized to bind to specific ligands and receptors and mediate signal transduction pathways. Understanding the physiological function of full-length and soluble (P)RR will be important for establishing its role in pathology [134]. Experimental studies shows that over-expression of prorenin receptor in rats with normal renin levels may cause an increase in blood pressure, plasma aldosterone level, and promote the development of glomerulosclerosis [135]. The enzymatic cascade of the RAS, its compounds and principal functions are shown in Figure 1-8.
1.5.2 Angiotensin converting enzyme (ACE)
ACE, or kininase II is an enzyme with a wide pattern of expression and distribution in different tissues, including the lung, brain, kidney, testis, and endothelial cells of arteries and veins [136, 137]. The cloning of ACE showed that it is composed of 2 homologous catalytic domains [138]. ACE is known to be a key component of the renin-angiotensin system that regulates blood pressure. ACE functions primarily as a “peptidyl dipeptidase” that cleaves two amino acids off the C-terminus of its substrate. Its primary substrate was identified as Ang I [139]. Moreover, ACE cleaves the C-terminal of bradykinin and a number of other small peptides that lack a proline residue [140]. Bradykinin promotes vasodilation by stimulating the production of nitric oxide and arachidonic acid metabolites in the vascular endothelium. ACE determines the production of Ang II and the degradation of Ang 1–7 [141]. Therefore ACE is considered to regulate the balance between the RAS and the
Kallikr the b inhibit antihy reduc been the m inhibit Figure 1.5.3 ACE2 [144]. chrom rein-Kinin s rush borde tors (ACE ypertensive cing Angiote shown that multiple fun tors does n e 1-8: Enzym Angiotensin 2 represent It is one mosome X [ system [142 er membran Ei) such a agents a ensin II leve t the ACE2 nctions of A ot affect the matic proteic n convertin ts a zinc m e of the [145]. ACE 28 2]. In the ki nes of the as Captop and they a els leading is the nega ACE in the e activity of cascade of g enzyme 2 metalloprote homologs 2 shares a 8 dney, ACE tubular ep pril and L act by inc to lower blo ative regula e kidneys f ACE2 [144 the RAS an 2 (ACE2) ease with c of ACE. bout 42% a expression pithelial cel Lisinopril a creasing b ood pressu ator that co [139]. The 4]. d principal fu carboxypep ACE2 wa amino acid n is located lls [137]. A are used radykinin re [143]. It ounterbalan e use of A unctions. [13 ptidase acti s mapped identities w d on ACE as and has ces ACE 37]. ivity to with
![Table 1-1: Substances filtered and reabsorbed by the kidney per 24 hours [3].](https://thumb-eu.123doks.com/thumbv2/123doknet/2069292.6503/22.918.230.781.680.941/table-substances-filtered-reabsorbed-kidney-hours.webp)
![Figure 1-3: Components of the nephron and the collecting duct system. Onthe left is a long-looped juxtamedullary nephron;on the right is a superficial cortical nephron [5]](https://thumb-eu.123doks.com/thumbv2/123doknet/2069292.6503/27.918.253.750.311.705/figure-components-nephron-collecting-juxtamedullary-nephron-superficial-cortical.webp)
![Figure 1-4: Structural abnormalities have an effect on albuminuria [32].](https://thumb-eu.123doks.com/thumbv2/123doknet/2069292.6503/30.918.309.708.433.656/figure-structural-abnormalities-have-an-effect-on-albuminuria.webp)
![Figure 1-6: Proposed mechanisms for the pathogenesis of diabetic nephropathy [60].](https://thumb-eu.123doks.com/thumbv2/123doknet/2069292.6503/41.918.236.763.655.999/figure-proposed-mechanisms-pathogenesis-diabetic-nephropathy.webp)
![Table 1-4: The amino acid sequences of angiotensin peptides (substrate), and enzymes that convert the substrate into another angiotensin [124, 154]](https://thumb-eu.123doks.com/thumbv2/123doknet/2069292.6503/51.918.222.733.406.695/sequences-angiotensin-peptides-substrate-enzymes-convert-substrate-angiotensin.webp)
![Figure 1-10: Human insulin gene promoter as an example for eukaryotic promoter [231]](https://thumb-eu.123doks.com/thumbv2/123doknet/2069292.6503/62.918.225.788.499.590/figure-human-insulin-gene-promoter-example-eukaryotic-promoter.webp)
![Figure 1-11: Diagrammatic illustration of K protein modular domains. Acidic domain is contained in aa 1-40; KH 1 aa 46-98; KH 2 aa 149-197; KH 3 aa 391-439; GRGG box aa 236-273; Src SH3-binding domain aa 289-315; Zikl-binding domain aa 209-337; K protein kinase (KPK)-binding domain aa 337-425 [250]](https://thumb-eu.123doks.com/thumbv2/123doknet/2069292.6503/66.918.227.706.171.371/figure-diagrammatic-illustration-contained-binding-binding-protein-binding.webp)