ABSTRACT: The last years have seen an increasing interest of engineers for unreinforced masonry structures, leading to strong improvements in the knowledge of their behaviour in usual conditions. Further investigations are however still required about their seismic behaviour. Indeed, the current design rules for such situations are commonly admitted as rather conservative, limiting thus the use of these structures, included in low or moderate seismic areas. This conservative character is in particular associated with the facts that walls perpendicular to the seismic action are usually neglected and that horizontal spanning elements are not properly considered, leading to an underestimation of the favourable frame effect. The present contribution describes shaking table tests on unreinforced load-bearing masonry sub-structures aiming at a better understanding of their dynamic behaviour. The tested specimens are two single-storey frames with respectively T- and L-shaped masonry piers coupled by a RC lintel and a slab. In particular, the T-shaped piers of the first frame are oriented in such a way to create a non-symmetric system. The L-shaped piers of the second frame are made of two perpendicular walls connected by different methods. The experimental study focuses on specific topics, such as the frame behaviour and the contribution of walls perpendicular to the direction of the seismic action. The issue of global and local torsion, the influence of the wall-to-wall connection technique and the gravity loading patterns are also investigated. The paper summarizes the main test results, including characterization of the dynamic properties of the specimens. A significant rocking behaviour is also evidenced for the highest input acceleration levels. Direct post-tests observations show the importance of the torsional effects, of the connection type between walls of a pier and of the loading configuration.
KEY WORDS: Shake table tests; unreinforced masonry; frame behaviour with T- or L-shaped walls.
1 INTRODUCTION
For centuries, masonry has been used as a main traditional construction method for several types of buildings, like private dwellings, aqueducts, town halls, churches, etc. The design of such structures has been based on good practice methods and its responsibility left to architects and mason-workers, with no or limited engineering. Since the early 90’s, the engineers have however been increasingly involved in the design of masonry structures. This interest has progressively led to improvements of the properties of the construction elements as well as to a better control of the global structural behaviour, allowing enlarging the field of application of unreinforced masonry structures for instance towards multi-storey apartment buildings or to lightweight concrete houses. These new applications use the material at a level closer to its limit capacity, for example with compression ratio under service loads higher than ever in the past. Moreover, ecological and economical considerations require a more rational use of materials to reduce the cost and consumption. All these considerations are at the base of the “Eurocode 6 -
Design of masonry structures” [1], where modern design
methodologies and verification rules are proposed.
In addition to service loads, structures have also to be designed under accidental loading, like earthquakes. However, the seismic impacts cannot be adequately considered without an additional proper understanding of the structural behaviour under these specific horizontal dynamic actions. The basic
principles of this characterization and the consequent analysis and design methodologies are proposed in [2] and are the base of the European standard dedicated to the design of buildings in seismic regions [3].
Due to the huge variety of material types (concrete, clay, etc.) and constructional methods, a specific regional transposition of the general considerations is needed. In this perspective, several research works have been carried out in the past fifteen years [4 – 8]. None of the identified references is however specifically dedicated to masonry structures with relatively thin bearing walls (from 10 to 20 cm) built with high strength units (compression resistance up to 15 N/mm² or even more) working at a very high compression ratio under service loads and more and more implemented using horizontal thin-bed layered jointing and open "tongue and groove" vertical joints, improving thus the constructional efficiency, which is one of the most common type of masonry structural configuration used in North-Western European areas. Furthermore, some researches have pointed out the over-conservatism and the mismatch with common construction habits of the current seismic standards design rules [9, 10] when comparing the resistance predicted based on code design rules with experimental results on full scale houses. The discrepancy can be largely explained by (i) the neglecting in current codes of walls perpendicular to the seismic action and (ii) the questionable contribution and modelling of horizontal elements, such as lintels and spandrels.
Shaking table tests on unreinforced load-bearing masonry frames
Christophe Mordant1, Matt Dietz2, Collin Taylor2, Hervé Degée1,3
1
Department ArGEnCo, Faculty of Applied Sciences, University of Liège, Chemin des Chevreuils, 1, 4000 Liège, Belgium
2
Department of Civil Eng., Faculty of Engineering, University of Bristol, University Walk, Bristol BS8 1TR, UK
3
Construction Engineering Research Group, Faculty of Engineering Technology, Hasselt University, Agoralaan Gebouw H, 3590 Diepenbeek, Belgium
Consequently, tests on single-storey unreinforced masonry frames with T- or L-shaped piers have been carried out in the Earthquake and Large Structures Laboratory (EQUALS) at the University of Bristol. The test specimens have been designed to investigate the dynamic response of unreinforced clay masonry frames so as to target several aims. First, it is expected to develop a better understanding of the frame behaviour of masonry structures and of the influence of the spanning structural elements (lintels, spandrels, floor slabs…). Second, a specimen with T-shaped piers has been specifically designed in order to trigger global and local torsional effects, while a second specimen with L-shaped piers aims at comparing different connection techniques between the shear wall and the perpendicular flange wall constituting the piers. Finally, the influence of the gravity loading case is investigated, in particular the case of a frame with piers partially loaded shaken in the direction perpendicular to the plan of loaded walls.
This paper summarizes the observations derived from the direct experimental measurements, followed by preliminary conclusions. The detailed assessment of the test results and the corresponding model identification and calibration are planned to be presented in a later contribution.
2 DESCRIPTION OF THE TESTED SPECIMENS
2.1 Description of the specimens
The units used to realize the specimens are "Zonnebeke
POROTHERM" produced by Wienerberger [11]. The walls
are assembled with thin-bed layered masonry ("PORO+" glue-mortar). Vertical joints are empty tongue and groove systems. Details of the units' geometry and mechanical characteristics can be found in [12].
Fig. 1 – scheme of the frame with T-shaped piers
Fig. 2 – scheme of the frame with L-shaped piers
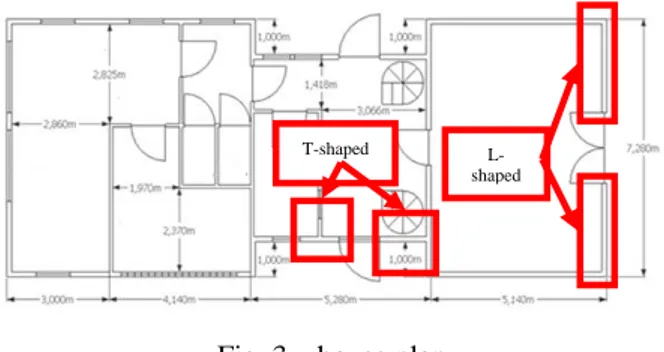
The test specimens consist in two masonry frames with respectively T- or L-shaped piers connected by a RC lintel and a prefabricated concrete slab (see Fig. 1 and Fig. 2). Such configurations are seen as representative of common sub-structures observed in real dwellings. Indeed, as shown in Fig.
3, the inner space of a house is divided in rooms by a set of perpendicular simple walls while openings are obviously necessary for the circulation of the inhabitants.
The final dimensions of the experimental piers and opening are governed by the shaking table size limitation as follows:
Shear walls : 0.74m x 2.0m x 0.14m (L x H x W)
Flanges : 0.74m x 2.0m x 0.14m (L x H x W)
Opening : 0.9m x 1.8m (L x H)
Lintel : 1.8m x 0.2m x 0.14m (L x H x W)
Note that the term “Shear wall” refers to the part of the pier along the frame plan while the “Flange” refers to the part of the pier perpendicular to the frame plan.
Fig. 3 – house plan
The frame with T-shaped piers has been designed with piers oriented differently in order to trigger a global torsional behaviour. The frame with L-shaped is symmetrical from a pure geometry point of view, but the shear wall and the flange of each pier are connected in two different ways. For the first one, the flange is glued to the shear wall with a high performance mortar while, for the second one, the flange and shear wall are classically connected by an alternated mason work.
Fig. 4 – additional mass and support system
The structural floor load is simulated by an additional 5 tons mass fixed on a reinforced concrete slab lying on the top of the specimen (Fig. 4, left). The connection between the slab and the masonry frame is ensured by steel elements whose positioning can be adjusted to simulate different loading cases (Fig.4, right). The resulting average compressive stress in the loaded walls is about 0.135 MPa for fully loaded configurations and about 0.25 MPa for partially loaded ones. These values lie in the usual range of compression ratio for this type of masonry.
2.2 Preliminary assessment design
Shaking table tests are mainly characterized by the acceleration input sent to the table. To avoid an anticipated collapse of the specimens, it is thus necessary to get a correct estimate of the maximum acceleration that they can sustain. In this perspective, a theoretical assessment based on structural
T-shaped
models commonly used for seismic analysis of masonry structures has been performed prior to the experimental tests.
Similarly to the procedure followed in [12] for simpler configurations, the acceleration is modelled by an equivalent static horizontal load V applied to the gravity centre of the specimen, namely at the centre of the RC slab in the present case. Once the internal forces are derived for both piers, the procedure consists in the calculation of the compressive length for each pier through equilibrium equations considering no tensile strength at the interface between the base of the pier and the foundation, where a linear distribution of compressive stresses is assumed. Then, final checks are made with respect to shear forces, compression of the units and global overturning of the piers. This procedure results in an estimate of the maximum allowable equivalent horizontal load Vmax.
The conversion of Vmax into acceleration differs however
from [12] since the present specimens can hardly be considered as SDOF systems and since their behaviour is highly non-linear in association with a load redistribution capacity from one pier to the other. To achieve this conversion, a methodology derived from the N2-method [13] is used. The ultimate limit state is assumed as being reached when the wall drifts overcome a specific threshold value defined from recommendations given by [14] and depending on the wall geometry and on the compression ratio.
Details of the procedure and calculation are given in [15] and final outcomes are summarized in Table 1 and Table 2 for the frame with T-shaped piers, respectively for an earthquake along the frame plan and perpendicular to it. The results for the frame with L-shaped piers are tabulated in Table 3 and Table 4. These tables also compare the results obtained according to different assumptions on the boundary conditions of the lintel (built-in or simply supported) and on the support conditions of the slab (resting resp. on the shear wall, on the flanges or on both).
Table 1. T-shaped piers – Y-direction.
Support conditions of the lintel Load case
Horizontal shear [N]
Acceleration [g]
Built-in Shear wall 13745 0.939
Flange 4148 0.795
Both 8912 0.857
Simply supported Shear wall 10808 0.780
Flange 3527 0.640
Both 6797 0.763
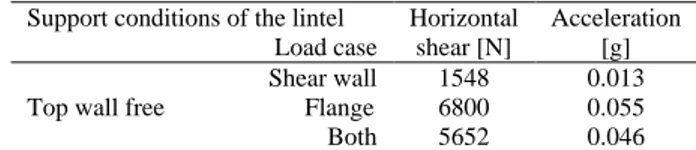
Table 2. T-shaped piers – X-direction
Support conditions of the lintel Load case Horizontal shear [N] Acceleration [g] Shear wall 1548 0.013
Top wall free Flange 6800 0.055
Both 5652 0.046
Table 3. L-shaped piers – Y-direction.
Support conditions of the lintel Load case
Horizontal shear [N]
Acceleration [g]
Built-in Shear wall 13795 1.200
Flange 8220 0.752
Both 9610 0.997
Simply supported Shear wall 10850 0.854
Flange 7120 0.654
Both 8430 0.829
Table 4. L-shaped piers – X-direction
Support conditions of the lintel Load case Horizontal shear [N] Acceleration [g] Shear wall 7632 0.057
Top wall free Flange 10960 0.081
Both 8516 0.063
3 TEST DESCRIPTION
3.1 Instrumentation of the specimens
The instrumentation of the specimens and the axis convention are extensively described in [15]. Measurements include the internal instrumentation of the table and additional sensors located on the table, the specimen and the slab. Three types of measurements are recorded:
Acceleration measurements (SETRA type 141A accelerometers).
Relative displacement measurements: displacements of the tested specimens with respect to the table or relative displacements between parts of the specimens are monitored (using LVDTs).
Global displacement measurements: an Imetrum Vision System monitors the horizontal and vertical displacements of the RC slab and of the specimen top thanks to targets placed at the right place.
The instrumentation layout is slightly different for the two mock-ups. Illustration of the third type of sensors is given hereafter in Fig. 5 for sake of clarity, since they are of direct use for the results described in this paper. The left picture is seen from the right side on the table, the middle one is from the near end and the right one is from the left of the table.
Fig. 5 – Targets of the Imetrum Vision System
3.2 Testing procedure
An alternation of white noise tests and seismic tests is performed on both specimens. The white noise tests are carried out along the frame plan and in the perpendicular plan before each seismic test. This type of test is performed to allow the derivation of the main dynamic characteristics of the frame (natural modes and frequencies, damping ratio). Each test last about three minutes so as to reach a proper steady vibration state. The random white noise excitation is characterized by a frequency content between 1Hz and 100Hz and by a level of about 0.1g RMS.
The seismic tests consist in sending a waveform to the table so as to simulate the seismic ground motion. The characteristics of the waveform are given in [15]. Successive input signals with increasing values of the peak acceleration
are applied to the table (see section 4 for the considered acceleration levels)
4 TEST RESULTS
4.1 Qualitative observations
Prior to any test results exploitation, simple qualitative observations can be made during the tests. Like the specimens tested in the first phase of the present experimental program [12], the unreinforced masonry frames exhibit a significant rocking behaviour, especially for the highest acceleration input, involving a progressive degradation of the mortar base joint.
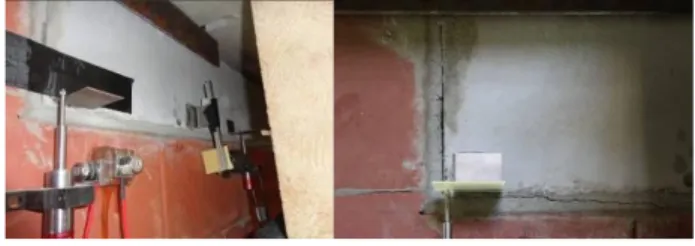
Another observation deals with the lintel and its connection with the piers. During the first steps of the tests (i.e. at low acceleration level), the connection failed. As shown in Fig. 6, cracks appear. Therefore, the piers cannot be anymore assumed as clamped at their tops and are only connected by the slab. Such an anticipated cracking is certainly related to the absence of units above the lintel as well as between the lintel and the slab.
Fig. 6 – Cracking of the lintel
A third observation points out the influence on the behaviour of the loading configuration of the specimen with L-shaped piers. Leaving aside the progressive damage of the specimen for tests with high acceleration level, the top displacements are actually larger in the case of a partial loading, especially when the seismic action is perpendicular to the loaded part of the piers. The stabilizing effect of the gravity load is indeed much smaller in this latter situation.
A final direct observation deals with the failure mode of the specimens. Collapse of the frame with T-shaped piers was induced by local torsional effects on the piers. The left hand side of Fig. 7 illustrates some units shifted from their initial position in a combined translation/rotation motion. Regarding the specimen with L-shaped piers, the collapse was triggered by the failure of the vertical connection of shear wall and flange for a seismic input along the frame plan (Fig. 7 right).
Fig. 7 – Collapse of the specimens
These qualitative observations lead to two main comments on the design procedure. On the one hand, the verification models proposed by the current standards don’t provide any verifications or rules for the torsional behaviour of a pier, whereas this effect is here identified as possibly the most critical. On the other hand, it is emphasized that a local verification of the capacity to transfer longitudinal shear at connections between perpendicular walls should be required to prevent the risk of early collapse.
Table 5 summarizes the measured PGAs of the seismic tests. The maximum values, corresponding to reaching the failure of the specimens, is lower than expected from the preliminary assessment, certainly due to the limitations of the model commented above. Nevertheless, this difference might also be explained by the presence of a residual transverse component of the acceleration. Indeed, while the theoretical procedure only considers a uniaxial input, Table 5 shows that the seismic input is actually bidirectional. The residual component induced by an imperfect control of the table motion ranges from 8 to 29 % of the main component and is likely to influence the specimen response and damages.
Quantitative results are provided in the following sections in terms of natural frequencies, modal shapes and seismic response of the system. More comprehensive information on the tests results is available in [15]. In the perspective of further commenting the results, it is relevant to remind that the same L-shaped specimen was tested under two different loading cases. The tests under the second loading case were thus started from a pre-damaged situation.
Table 5. Sample table. After T-shaped Fully loaded X Y [g] [g] L-shaped Fully loaded X Y [g] [g] L-shaped Flanges loaded X Y [g] [g] S1 0,007 0,074 0,006 0,066 0,011 0,063 S2 0,018 0,148 0,038 0,004 0,039 0,007 S3 0,046 0,285 0,014 0,149 0,014 0,083 S4 0,038 0,005 0,087 0,013 0,080 0,018 S5 0,083 0,008 0,036 0,221 0,026 0,133 S6 0,176 0,025 0,135 0,023 0,125 0,035 S7 0,276 0,057 0,077 0,269 0,039 0,195 S8 0,107 0,477 0,180 0,042 0,170 0,037 S9 / / / / 0,058 0,197
4.2 Natural frequencies identification
Identification of the natural frequencies is carried out as explained in [15] and allows the characterisation of a possible deterioration of the walls. Three main peaks are observed in both directions for the two specimens. The evolution of the frequencies is shown in Fig. 8 for the x-direction and Fig. 9 for the y-direction. A first comment about these results is that the first natural frequency of the mock-up with T-shaped piers is higher than the one of the mock-up with L-shaped piers, which seems in contradiction with the theoretical expectation (see below for further comments on this issue).
0 2 4 6 8 10 0 5 10 15 20 25 30 35
N° of the previous seismic test
F re q u e n cy [Hz]
Natural frequencies of the specimen with T-shaped piers (X-direction)
1st natural frequency 2nd natural frequency 3rd natural frequency 0 1 2 3 4 5 6 7 8 9 10 11 0 5 10 15 20 25 30 35
N° of the previous seismic test
F re q u e n cy [Hz]
Natural frequencies of the specimen with L-shaped piers (X-direction)
1st natural frequency (full loaded) 2nd natural frequency (full loaded)
3rd natural frequency (full loaded) 1st natural frequency (flanges loaded)
2nd natural frequency (flanges loaded) 3rd natural frequency (flanges loaded)
Fig. 8 – Natural frequencies in X-direction
The natural frequencies in the x-direction, shown in Fig. 8, are decreasing with the increase of the acceleration level, in general. This decrease looks more important for the T-shaped specimen because of a higher increment of the acceleration level. This increment is lower for the specimen with L-shaped piers to avoid excessive damages of the specimen, otherwise the changing of loading case would have been impossible (see also Table 5). The main frequency drop is observed for the fundamental frequency, whereas the third natural frequency is more constant or even increasing.
These observations are also valid in the y-direction, illustrated in Fig. 9. The frequency values are however higher, as it can be expected given that the direction of the frame plan is clearly stiffer. The numerical values drawn in the Fig. 8 and Fig. 9 are tabulated in the Tables 6, 7 and 8 for each loading configurations 0 2 4 6 8 10 0 5 10 15 20 25 30 35
N° of the previous seismic test
F re q u e n cy [Hz]
Natural frequencies of the specimen with T-shaped piers (Y-direction)
1st natural frequency 2nd natural frequency 3rd natural frequency 0 1 2 3 4 5 6 7 8 9 10 11 0 5 10 15 20 25 30 35
N° of the previous seismic test
F re q u e n cy [Hz]
Natural frequencies of the specimen with L-shaped piers (Y-direction)
1st natural frequency (full loaded)
2nd natural frequency (full loaded)
3rd natural frequency (full loaded)
1st natural frequency (flanges loaded)
2nd natural frequency (flanges loaded)
Fig. 9 – Natural frequencies in Y-direction
Table 6. Frame with T-shaped piers – natural frequencies After X-direction [Hz] 1st 2nd 3rd Y-direction [Hz] 1st 2nd 3rd Before 5.18 9.71 19.28 6.86 9.19 / S1 4.99 9.98 19.70 6.30 9.85 24.68 S2 5.25 9.98 19.70 5.78 9.98 24.68 S3 4.07 7.35 13.92 3.68 7.48 28.36 S4 4.20 7.62 13.92 3.80 7.62 / S5 4.07 7.62 13.66 4.20 7.48 29.15 S6 3.55 6.83 13.13 3.94 6.96 28.10 S7 3.02 6.30 12.61 4.46 6.96 28.62 S8 2.63 6.30 13.13 3.28 6.04 30.99 S9 / / / / / /
Table 7. Frame with L-shaped piers (full loaded) – natural frequencies After X-direction [Hz] 1st 2nd 3rd Y-direction [Hz] 1st 2nd 3rd Before 5.02 11.49 24.82 6.79 13.06 25.47 S1 4.96 11.76 24.82 5.88 12.80 25.60 S2 4.70 10.97 24.69 5.62 12.80 25.60 S3 4.70 11.76 24.03 5.09 12.28 26.52 S4 4.57 11.23 23.77 5.22 12.28 25.67 S5 4.44 11.46 26.12 4.44 12.54 25.67 S6 4.57 11.76 25.99 4.57 12.54 25.67 S7 4.05 11.49 26.38 3.66 12.28 25.60 S8 2.17 10.97 26.38 3.53 12.02 24.95 S9 / / / / / /
Table 8. Frame with L-shaped piers (flanges loaded) – natural frequencies After X-direction [Hz] 1st 2nd 3rd Y-direction [Hz] 1st 2nd 3rd Before 2.96 10.28 14.80 5.05 10.19 / S1 2.70 10.19 14.80 4.71 10.1 / S2 2.70 10.1 14.63 4.79 10.1 / S3 2.79 10.19 14.63 4.79 10.1 / S4 2.87 10.1 14.45 4.62 10.1 / S5 2.79 10.01 14.28 4.53 10.01 / S6 2.70 9.93 14.11 4.70 9.84 / S7 2.61 9.75 14.28 4.61 9.93 / S8 2.70 9.84 14.11 4.70 9.93 / S9 / / / / / /
As a matter of comparison, theoretical reference values of the first natural frequency of the undamaged specimen can be easily estimated from a simple model based on the assumptions proposed by Eurocode 6 for the material properties. The resulting assessed frequencies in both directions are given in Table 9.
As said above, with regard to the geometry of the specimens, it is expected to get a higher frequency for the frame with L-shaped piers, which is in agreements with the results in Table 9, although not with the measurements. In most cases, the theoretical prediction yields frequencies higher than measured, possibly related to an overestimation of the values suggested by Eurocodes 6 and 8 for the elastic modulus and/or the shear modulus. Indeed, the recommended value of the elastic modulus, included consideration for
cracking, is equal to five hundred times the value of the characteristic compressive strength of the masonry wall. This recommendation is however considered as being too stiff by the authors, as concluded from previous experimental evidences presented in [12].
Another possible reason of the difference is related with the assumption on the support conditions of the piers, which are assumed to be fully fixed for deriving the results in Table 9. The stiffness of the frame in its plan is expressed by Eq. 1:
GA k H EI H K ' 1 3 (1)
where H is the specimen height
E and G are the elastic and shear moduli I is the sum of the inertia of the piers A is the sum of the area of the piers
is a parameter depending of the support condition For the specimen with L-shaped piers, the best frequency fitting is obtained if the -parameter is equal to 6.3 and the elastic modulus is equal to 400 fk. It can therefore be
concluded that the recommended value for the elastic modulus in EC 6 and 8 is indeed too stiff for the type of masonry considered in the present study, where the vertical joints are not filled with mortar.
Table 9. X-direction (Y-direction) – First natural frequency
Specimen Measured frequency [Hz] Frequency based on EC6 [Hz] T-shaped piers 5.18 (6.86) 5.03 (8.72) L-shaped piers 5.02 (6.79) 5.65 (9.48) 4.3 Modal shapes
Natural modes are identified from experimental measurements assuming that the slab is behaving as a rigid body with an in-plane motion fully described by 3 DOFs. The modal shapes are obtained from the white noise tests, working on a square matrix frequency-dependant of cross PSD which inputs are the accelerations measured by the four sensors placed on the slab. The identification procedure is detailed in [15]. The relevance of the method is ensured since the white noise test does not involve rocking of the specimen and/or slab, given the low level of ground acceleration. The analysis focuses on the first three vibration modes of the structure, consistently with outcomes of section 4.2 related to natural frequencies.
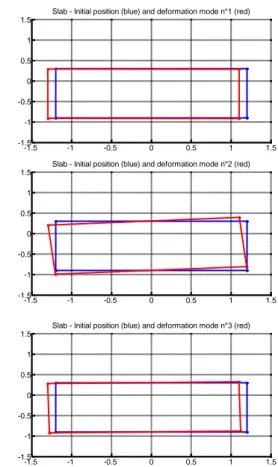
Modal shapes are depicted in Fig.10 and 11 for the T-shaped walls, respectively for white noises in the x and y directions. Observation of the identified modal shapes lead to the following comments, also valid for L-shaped walls: the first and third modes are characterized by a combination of translation and rotation, the importance of the latter depending on the specimen studied and different for both modes, while the second mode can be qualified as a quasi-pure rotation mode, with a negligible translation component.
-1.5 -1 -0.5 0 0.5 1 1.5 -1.5 -1 -0.5 0 0.5 1 1.5
Slab - Initial position (blue) and deformation mode n°1 (red)
-1.5 -1 -0.5 0 0.5 1 1.5 -1.5 -1 -0.5 0 0.5 1 1.5
Slab - Initial position (blue) and deformation mode n°2 (red)
-1.5 -1 -0.5 0 0.5 1 1.5 -1.5 -1 -0.5 0 0.5 1 1.5
Slab - Initial position (blue) and deformation mode n°3 (red)
Fig. 10 – Modal shapes in X-direction
-1.5 -1 -0.5 0 0.5 1 1.5 -1.5 -1 -0.5 0 0.5 1 1.5
Slab - Initial position (blue) and deformation mode n°1 (red)
-1.5 -1 -0.5 0 0.5 1 1.5 -1.5 -1 -0.5 0 0.5 1 1.5
Slab - Initial position (blue) and deformation mode n°2 (red)
-1.5 -1 -0.5 0 0.5 1 1.5 -1.5 -1 -0.5 0 0.5 1 1.5
Slab - Initial position (blue) and deformation mode n°3 (red)
4.4 Seismic behaviour
Although the processing of the seismic test results is still in progress, some interesting results (limited to the motion of the slab with respect to the ground) can already be commented here.
A preliminary comment of these results deals with the relevance of the measurements recorded by the Imetrum Vision system (VS). These measurements, being not stereographic, can only be used in case the main seismic input is perpendicular to the plan of the target, i.e. the use of the displacements of the targets 1 to 6 (see Fig. 5) is for instance only possible for the seismic tests along the y-axis. However, additional displacement measurements at selected points can be recovered by integrating appropriately the accelerometric signal recorded at the same locations.
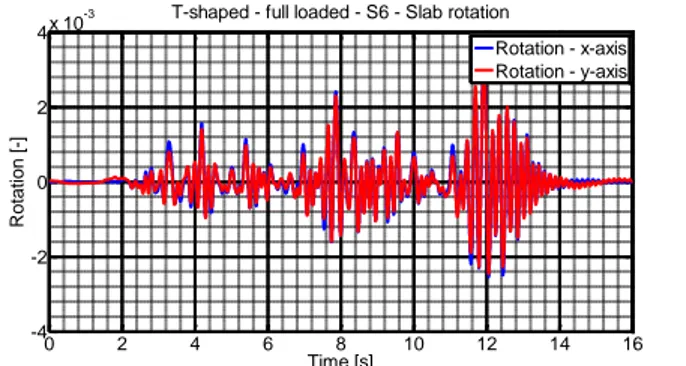
Fig. 12 and 13 depict the time evolution of the slab torsional rotation during the tests with high amplitude derived from the displacement measurements. Although the configuration of the frame with L-shaped piers is symmetric regarding the x-direction, and thus no rotation should be theoretically observed, such a motion is however triggered by accidental eccentricities. The position of the slab, the reliability of the connexion system and the mass distribution is indeed not perfectly controlled. The torsional motion remains nevertheless less important than for the T-shaped specimen where a natural torsion is induced by the unsymmetrical configuration of the specimen, independently of the accidental effects, as evidenced by comparing Fig. 12, 13 and 14.
0 2 4 6 8 10 12 14 16 -2 -1 0 1 2x 10 -3 Time [s] Ro ta tio n [ -]
L-shaped - full loaded - S8 - Slab rotation
Rotation - x-axis Rotation - y-axis
Fig. 12 – Slab rotation (L-shaped piers - full loaded - S8)
0 2 4 6 8 10 12 14 16 -2 -1 0 1 2x 10 -3 Time [s] Ro ta tio n [ -]
L-shaped - flanges loaded - S8 - Slab rotation
Rotation - x-axis Rotation - y-axis
Fig. 13 – Slab rotation (L-shaped piers - flanges loaded - S8)
0 2 4 6 8 10 12 14 16 -4 -2 0 2 4x 10 -3 Time [s] Ro ta tio n [ -]
T-shaped - full loaded - S6 - Slab rotation
Rotation - x-axis Rotation - y-axis
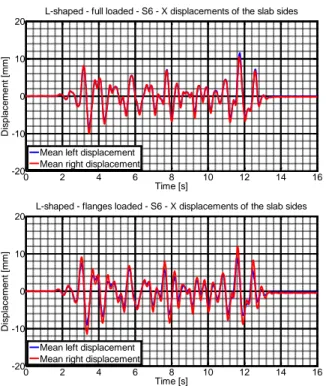
Fig. 14 – Slab rotation (T-shaped piers full loaded – S6) The influence of the gravity load configuration for the specimen with L-shaped piers can also be highlighted. In this perspective, a comparison of the slab displacement along the earthquake direction is done in Fig. 15 and 16 for a seismic input, respectively in the y-dir. (PGA ~ 0.14 g) and in the x – dir. (PGA ~ 0.13 g). The comparison shows larger displacement for a same acceleration level, when only the flanges are loaded. The difference is also more important when the input is perpendicular to the loaded walls.
A remark can also be done on the ability of the specimen to sustain a higher acceleration level than the one predicted by a theoretical model considering either the two piers, but neglecting the horizontal spanning elements, or assuming a single wall with equivalent total length in the direction of the frame plan. For these two simplified models, the maximum sustainable ground acceleration expected is respectively about 0.155 g and 0.149 g, as shown in [15]. The interest of considering the frame effect and the perpendicular walls is therefore obvious.
0 2 4 6 8 10 12 14 16 -20 -10 0 10 20 Time [s] Di sp la ce m e n t [m m ]
L-shaped - full loaded - S6 - X displacements of the slab sides
Mean left displacement Mean right displacement
0 2 4 6 8 10 12 14 16 -20 -10 0 10 20 Time [s] Di sp la ce m e n t [m m ]
L-shaped - flanges loaded - S6 - X displacements of the slab sides
Mean left displacement Mean right displacement
Fig. 16 – X-disp. (L-shaped piers full loaded (top) and partially loaded (bottom) – S6)
5 CONCLUSIONS
This paper has presented the first outcomes of experimental shake table tests carried out with the main objective of characterizing the dynamic behaviour of high strength clay masonry sub-structures with glued horizontal joints and empty vertical joints subjected to seismic action. The geometries of the specimens are defined such that the effects of the torsion, the influence of the gravity loading configuration and the consequences of the connection method can be studied.
The main observations that can be directly derived from the observations done during the testing campaign are the following.
(i) A significant rocking motion is observed for both tested frames, with L- or T-shaped piers.
(ii) The identification of the natural vibration modes under low level white noise excitation raises the question of the accuracy of the values of the elastic modulus usually suggested in the main reference documents, this modulus being apparently overestimated for the studied type of masonry. Similar questions also rise regarding the boundary conditions to be considered in theoretical models.
(iii) The effects of local torsion in the masonry piers can currently not be properly assessed with the available design models. The control of this behaviour needs to be improved in order to take the associated stress state appropriately into account, because likely to induce anticipated unexpected failures such as observed in the present tests.
(iv) The connection line at the intersection of perpendicular vertical walls is also a critical point and should require appropriate local verifications.
(v) The importance of the gravity loading configuration and, under certain conditions, of the consideration for the walls perpendicular to the seismic action has been highlighted
and is shown as influencing significantly the maximum sustainable acceleration.
At this stage, additional processing and developments are however still required to improve the exploitation and the interpretation of the tests results. Detailed assessment of the test results and corresponding model identification and calibration are planned to be presented in upcoming contributions currently in preparation.
ACKNOWLEDGMENTS
The research leading to these results has received funding from the European Union Seventh Framework Programme (FP7/2007-2013) under grant agreement n° 227887, SERIES. H. Degée also acknowledges the direct support received from F.R.S.-FNRS (Belgian Fund for Research). C. Mordant acknowledges the F.R.I.A. for the support of his PhD.
REFERENCES
[1] Eurocode 6, (2004). Seismic Design of masonry structures – Part 1.1: Common rules for reinforced and unreinforced masonry structures. [2] Tomazevic M (1999) Earthquake-Resistant Design of Masonry Buildings.
Imperial College Press, London.
[3] Eurocode8. (2004). Eurocode 8 : Design of structures for earthquake resistance - Part 1 : General rules, seismic actions and rules for buildings. [4] Kazemi, M. T., Hoseinzadeh Asl, M., Bakhshi, A. and Rahimzadeh
Rofooei, F. (2010), Shaking table study of a full-scale signle storey confined brick masonry building. Scientia Iranica, 17(3), 184-193. [5] Nakagawa T, Narafu T, Imai H et al (2012), Collapse behaviour of a brick
masonry house using a shaking table and numerical simulation based on the extended distinct element method. Bull Earthquake Eng 10:269-283 [6] Schermer, D.C (2005), Autoclaved Aerated Concrete Innovation and
Development, 4th International Conference on Autoclaved Aerated Concrete, AAC, London (UK), September
[7] Bothara JK, Dhakal RP, Mander JB (2010) Seismic performance of an unreinforced masonry building: An experimental investigation. Earthquake Engineering and Structural Dynamics 39:45-68
[8] Milani G, Beyer K, Dazio A (2009) Upper bound limit analysis of meso-mechanical spandrel models for the pushover analysis of 2D masonry frames. Engineering Structures 31:2696-2710.
[9] H. Degée, V. Denoël, P. Candeias, A. Campos Costa, E Coelho. (2007) Experimental investigation on the seismic behaviour of North-European masonry houses. Proc. of the congress SISMICA, 12 pp.
[10] Karantoni F.V., Lirantzaki F.N. (2009). Seismic behaviour of "Simple Masonry Buildings" according to EN 1998. 7th International Conference on Earthquake Resistant Engineering Structures.
[11] Wienerberger (-) Rouge. La Force
[12] Mordant, C., Dietz, M. and Degée, H. (2013a). Seismic behaviour of thin-bed layered unreinforced clay masonry shear walls including soundproofing elements. In: Alper Ilki and Michael N. Fardis (eds), Proc SERIES Workshop. Geotechnical, Geological and Earthquake Engineering series (chapter 6).
[13] Eurocode8 (2004). EurcoCode8 : Annex B(Informative) : ”Determination of the target displacement for nonlinear static (pushover) analysis.
[14] Oropeza Ancieta, M. (2011). Fragility Functions for Seismic Risk in Regions with Moderate Seismicity. Lausanne.
[15] C. Mordant, Contribution to experimental tests on the seismic behaviour of masonry structural elements. Master dissertation, University of Liège, 2012.
![Table 6. Frame with T-shaped piers – natural frequencies After X-direction [Hz] 1 st 2 nd 3 rd Y-direction [Hz] 1st 2nd 3 rd Before 5.18 9.71 19.28 6.86 9.19 / S1 4.99 9.98 19.70 6.30 9.85 24.68 S2](https://thumb-eu.123doks.com/thumbv2/123doknet/6208463.160441/5.893.460.828.393.603/table-frame-shaped-piers-natural-frequencies-direction-direction.webp)