Atmos. Chem. Phys., 9, 8987–8999, 2009 www.atmos-chem-phys.net/9/8987/2009/ © Author(s) 2009. This work is distributed under the Creative Commons Attribution 3.0 License.
Atmospheric
Chemistry
and Physics
Technical Note: Harmonized retrieval of column-integrated
atmospheric water vapor from the FTIR network – first examples
for long-term records and station trends
R. Sussmann1, T. Borsdorff1, M. Rettinger1, C. Camy-Peyret2, P. Demoulin3, P. Duchatelet3, E. Mahieu3, and C. Servais3
1Karlsruhe Institute of Technology, IMK-IFU, Garmisch-Partenkirchen, Germany
2Laboratoire de Physique Mol´eculaire pour l’Atmosph`ere et l’Astrophysique (LPMAA), CNRS/UPMC/IPSL, Paris, France 3Institute of Astrophysics and Geophysics, University of Li`ege, Li`ege, Belgium
Received: 5 May 2009 – Published in Atmos. Chem. Phys. Discuss.: 16 June 2009
Revised: 11 November 2009 – Accepted: 20 November 2009 – Published: 27 November 2009
Abstract. We present a method for harmonized retrieval
of integrated water vapor (IWV) from existing, long-term, measurement records at the ground-based mid-infrared solar FTIR spectrometry stations of the Network for the Detec-tion of Atmospheric ComposiDetec-tion Change (NDACC). Corre-lation of IWV from FTIR with radiosondes shows an ideal slope of 1.00(3). This optimum matching is achieved via tuning one FTIR retrieval parameter, i.e., the strength of a Tikhonov regularization constraining the derivative (with respect to height) of retrieved water profiles given in per cent difference relative to an a priori profile. All other FTIR-sonde correlation parameters (intercept=0.02(12) mm, bias=0.02(5) mm, standard deviation of coincident IWV dif-ferences (stdv)=0.27 mm, R=0.99) are comparable to or bet-ter than results for all other ground-based IWV sounding techniques given in the literature. An FTIR-FTIR side-by-side intercomparison reveals a strong exponential increase in stdv as a function of increasing temporal mismatch start-ing at 1t≈1 min. This is due to atmospheric water vapor variability. Based on this result we derive an upper limit for the precision of the FTIR IWV retrieval for the small-est 1t (=3.75 min) still giving a statistically sufficient sam-ple (32 coincidences), i.e., precision(IWVFTIR)<0.05 mm (or 2.2% of the mean IWV). The bias of the IWV retrievals from the two different FTIR instruments is nearly negligible (0.02(1) mm). The optimized FTIR IWV retrieval is set up in the standard NDACC algorithm SFIT 2 without changes
Correspondence to: R. Sussmann
to the code. A concept for harmonized transfer of the re-trieval between different stations deals with all relevant con-trol parameters; it includes correction for differing spectral point spacings (via regularization strength), and final qual-ity selection of the retrievals (excluding the highest residuals (measurement minus model), 5% of the total).
As first application examples long-term IWV data sets are retrieved from the FTIR records of the Zugspitze (47.4◦N, 11.0◦E, 2964 m a.s.l.) and Jungfraujoch (46.5◦N, 8.0◦E, 3580 m a.s.l.) NDACC sites. Station-trend analysis com-prises a linear fit after subtracting an intra-annual model (3 Fourier components) and constructing an uncertainty in-terval [95% confidence] via bootstrap resampling. For the Zugspitze a significant trend of 0.79 [0.65, 0.92] mm/decade is found for the time interval [1996–2008], whereas for the Jungfraujoch no significant trend is found. This confirms re-cent findings that strong variations of IWV trends do occur above land on the local to regional scale (≈250 km) in spite of homogeneous surface temperature trends. This paper pro-vides a basis for future exploitation of more than a dozen ex-isting, multi-decadal FTIR measurement records around the globe for climate studies.
1 Introduction
Water vapor is a key climate variable. In the lower tropo-sphere, condensation of water vapor into precipitation pro-vides latent heat which dominates the structure of tropo-spheric diabatic warming. Water vapor is also the most im-portant gaseous source of infrared opacity in the atmosphere.
It accounts for about 60% of the natural greenhouse effect for clear skies and provides the largest positive feedback in model projections of climate change. Accurate measure-ments of water vapor are therefore most important to con-strain climate models. Measured trends in integrated water vapor (IWV) are important because they may be indicators of anthropogenic climate change (Philipona et al., 2004, 2005). However, evidence for long-term changes in IWV is limited by the availability and quality of measurements (Trenberth et al., 2005, 2007).
Data for the last three or four decades of the twentieth cen-tury indicate an increase in water vapor in the lower tropo-sphere over parts of the Northern Hemitropo-sphere. Up to now, trend studies of IWV have mainly been based on radioson-des (e.g., Ross and Elliott, 2001). However, homogeneity of the radiosonde records was affected by changes in instru-mentation and reduction of sounding activities. E.g., the ma-jor changes in US radiosonde types at the end of 1995 led to spurious changes dependent on time of observation, eleva-tion, locaeleva-tion, and season. In terms of moisture, there was a spurious drying, but mainly in the upper troposphere. In the lower troposphere, the relative humidity decreased from 5% to 8% with the switch from VIZ to Vaisala sondes (Elliott et al., 2002). A series of changes were made in the Vaisala sensor types used at operational stations in the first few years after 2000 and significant inter-sensor biases have been iden-tified (e.g., Miloshevich et al., 2006).
Beginning in 1987, satellite-based data from microwave instruments provided improved observations of IWV. For example, data from the Special Sensor Microwave/Imager (SSM/I) have been exploited for investigation of IWV trends (Wentz and Schabel, 2000). However, key aspects of any, satellite-based dataset used to study decadal or longer timescales are changes in instrumentation and algorithms. For instance, the number of SSM/I instruments used in the NASA Water Vapor Project (Randel et al., 1996; Vonder Haar et al., 2003) dataset has ranged from one (1988–1992) to three (Vonder Haar et al., 2005). So it is not surprising that a number of publications have noted that statistically signif-icant, long-term trends in climate variables are difficult to derive from satellite data because of problems with satellite intercalibration and sensor drift (Hurrel and Trenberth, 1997, 1998; Christy et al., 1998; Wenz and Schabel, 1998, Tren-berth et al., 2007). First satellite based IWV trend studies via ERS-2/GOME and ENVISAT/SCIAMACHY data were reported only recently (Wagner et al., 2006; Mieruch et al., 2008).
Clearly, it is important to re-examine internally consistent, existing and ongoing long-term records from other indepen-dent sounding techniques that contain information on IWV. One valuable source of data has turned out to be ground-based microwave radiometry (e.g., Morland et al., 2006; Fiorucci et al., 2008). Such measurements are being carried
out to some extent within the NDACC1 network, which is dedicated to long-term, ground-based, atmospheric sounding observations at many stations around the globe.
In addition, long-term observations using ground-based, mid-infrared solar FTIR spectrometry are organized within NDACC by the IRWG2. At its annual meetings during the last 15 years or so, a best-practice for FTIR measurements has been set up. This guarantees both high-level inter-station comparability and long-term stability of the measurements. Recently, IRWG activities have been extended to support har-monization of retrieval approaches.
This paper is a contribution to this effort. Although FTIR has been used for retrieval of numerous other species, it is clear that solar infrared spectra contain a considerable amount of information on water vapor as well. However, up to now there have been few attempts to retrieve water vapor from FTIR. The lack of sufficiently accurate spectroscopic data in the spectral domains of interest has been a major hindrance. However, it has been shown by Sussmann and Camy-Peyret (2002) that using the new, mid-infrared, wa-ter vapor spectroscopy from Toth and coworkers included in HITRAN 2000 (Rothmann et al., 2003) that information on water in the 11.7–11.9 µm region from solar spectra can be retrieved without the severe, spectral residuals due to line pa-rameter errors left by HITRAN 1996 (see Figs. 9–14 in Suss-mann and Camy-Peyret, 2002). Subsequently, Schneider et al. (2006) showed the first water vapor profile retrieval from ground-based FTIR spectrometry. This retrieval was opti-mized to obtain profile information, especially in the upper troposphere.
Retrievals of IWV from NDACC-type FTIR measure-ments still need to be systematically optimized before best-possible IWV data can be obtained. There are more than a dozen FTIR stations around the globe with time series data covering more than one decade so that it is possible to create a substantial, complementary IWV set of trends.
The purpose of this paper is to develop an FTIR retrieval optimized for IWV which can be used to complement ex-isting long-term radiosonde and satellite records. Section 2 presents a new method for optimizing IWV retrievals from FTIR measurements so that they match radiosonde charac-teristics. It includes a concept for station-to-station harmo-nization of the retrieval as well as an error characterization. Section 3 gives first application examples via retrieval of har-monized IWV series from the long-term FTIR records ob-tained at the Zugspitze and Jungfraujoch NDACC stations and an analysis of the corresponding IWV trends. In Sect. 4, we summarize our work.
1Network for the Detection of Atmospheric Composition
Change; http://www.ndacc.org.
R. Sussmann et al.: Trends in column-integrated water vapor from the FTIR network 8989
2 Method
2.1 Retrieval strategy
An IWV retrieval from ground-based, mid-infrared solar FTIR spectrometry has been set up to i) yield an accuracy and precision comparable to the best among the other ground-based IWV sounding techniques, ii) match IWV retrieval re-sponse with standard radiosonde characteristics (i.e., corre-lation slope equals 1.0), and iii) implement it in the retrieval algorithm SFIT 2 (Pougatchev et al., 1995), which is the standard within the NDACC IRWG, without performing any changes to the code. The retrieval is thereby easily transfer-able to all ground-based, FTIR measurement stations of the NDACC network. SFIT 2 was initially set up to perform pro-file retrievals via optimal estimation. We will utilize it here for the first time for profile retrievals using Tikhonov regular-ization; the differences and advantages are explained below.
The classical approach to retrieve column integrated quan-tities from ground-based FTIR spectrometry has used least squares spectral fitting with iterative scaling of an (inflexi-ble) VMR3a priori profile via one (unconstrained) altitude-constant factor (e.g., Rinsland et al., 1984). Because of the free scaling, this approach has the advantage that it does not damp true column variability in the retrieval. However, it fre-quently leads to significant spectral residuals (measurement minus model). This is because of i) likely discrepancies of the shape of the true profile relative to the a priori profile and ii) possible spectral line shape errors in the forward calcu-lation and/or the measurement. Both effects can introduce significant biases to the retrieved columns.
A strategy to reduce this problem is to derive total columns from (flexible) profile retrievals which help to better integrate the area of the measured absorption line shape and thereby obtain a more accurate estimate of the total column integral (even allowing, to some extent, for retrieval of unphysical profile shapes to compensate for line shape errors). Up to now, most profile retrievals from solar FTIR spectrometry have been regularized via diagonal a priori covariance matri-ces (optimal estimation). This type of profile retrieval has, however, the tendency to damp variability in the retrieved to-tal columns as a result of profile smoothing at the cost of any deviation between the retrieved profile and the a priori pro-file. In particular, this damping is a critical issue in the case of water vapor because of its high natural variability, which covers more than one order of magnitude in IWV.
Therefore, we have developed an IWV retrieval that com-bines the advantages of both a profile scaling and a profil-ing approach while avoidprofil-ing their disadvantages at the same time. In other words, we construct a regularization matrix that allows for some (constrained) flexibility in profile shape (degree of flexibility to be tuned) and also guarantees that pure profile-scaling type variations remain unconstrained.
3Volume Mixing Ratio
Figures 849.0 849.2 849.4 849.6 849.8 850.0 850.2 0.2 0.4 0.6 0.8 1.0 -0.05 0.00 0.05 852.0 852.2 852.4 852.6 852.8 853.0 0.0 0.2 0.4 0.6 0.8 1.0 -0.05 0.00 0.05 839.6 839.8 840.0 840.2 840.4 0.4 0.6 0.8 1.0 -0.050.00 0.05 (b) relativ e intens ity wave number (cm-1) measured spectrum calculated spectrum residual r e la tiv e in ten s ity wave number (cm-1) measured spectrum calculated spectrum (c) resi dual (a) relat iv e intens it y wave number (cm-1) measured spectrum calculated spectrum residual
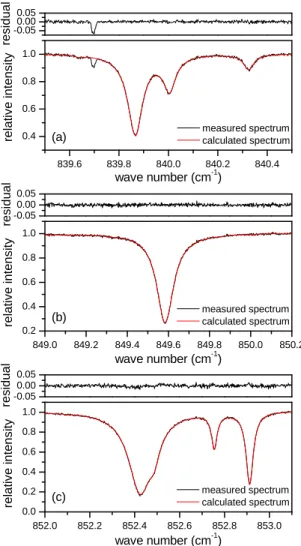
Fig. 1. Spectral intervals (a) - (c) used for FTIR spectrometry optimized for IWV retrieval. The
spectrum shown has been recorded with the Zugspitze FTIR at a solar zenith angle of 53.54 ° and the retrieved IWV is 2.06 mm.
Fig. 1. Spectral intervals (a–c) used for FTIR spectrometry opti-mized for IWV retrieval. The spectrum shown has been recorded with the Zugspitze FTIR at a solar zenith angle of 53.54◦and the retrieved IWV is 2.06 mm.
This is achieved by imposing a Tikhonov first order smooth-ing constraint to retrieve per cent changes of the water vapor VMR profile relative to the a priori profile. Part of the strat-egy to optimally constrain the total water vapor column is to search for a set of spectral microwindows which contain information on the water vapor profile throughout the tropo-sphere.
2.2 Retrieval set up
Figure 1 shows the spectral microwindows (i.e., the mea-surement vector y) which have been selected from a spectro-scopic point of view with two different targets in mind. First, these windows completely avoid interference errors (Suss-mann and Borsdorff, 2007) resulting from absorbing, telluric species other than water vapor. There is only one small and narrow solar OH line seen in Fig. 1a. Since it is difficult to perfectly simulate such lines, we eliminated any resulting
0 2 4 6 8 10 12 14 0.000 0.005 0.010 0.015 0.020 Tobin radiosondes mean of sondes FTIR a priori
H2O volume mixing ratio
alt
it
ude (k
m
)
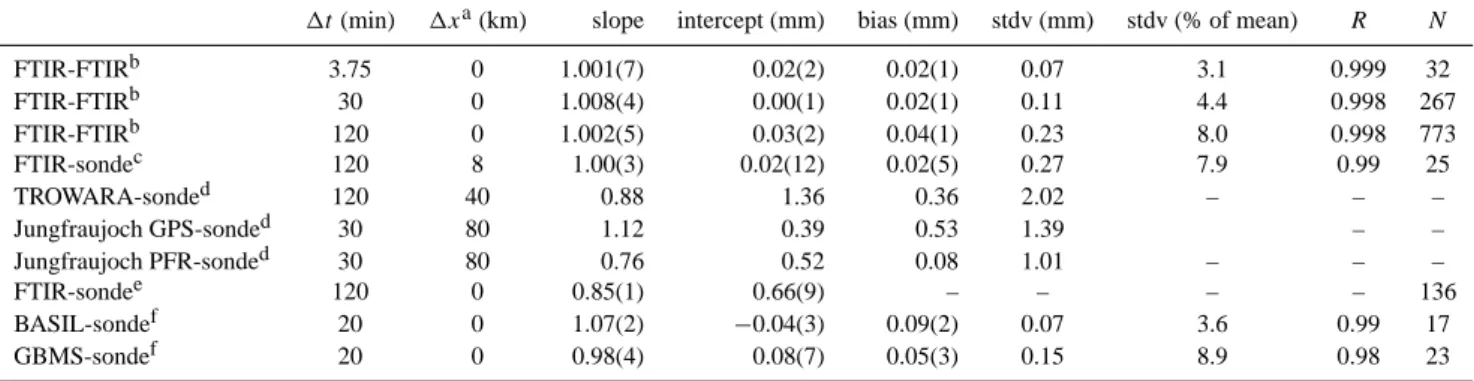
Fig. 2. Garmisch radiosonde data set used for construction of the water vapor a priori profile for
the FTIR retrieval of IWV. The 25 “Tobin profiles” shown have been interpolated from 50 individual soundings according to Eq. (4).
Fig. 2. Garmisch radiosonde data set used for construction of the water vapor a priori profile for the FTIR retrieval of IWV. The 25 “Tobin profiles” shown have been interpolated from 50 individual soundings according to Eq. (4).
perturbations of the retrieval by deweighting the Sε matrix
accordingly (i.e., setting the signal-to-noise ratio to zero in the spectral vicinity of this line). Second, the microwindows are selected to yield sensitivity for water vapor variations throughout the whole troposphere to constrain the total col-umn in the best possible way for a wide range of IWV levels. This is achieved by using a well-balanced mixture of strong and weak absorption lines.
The forward model F maps the water vapor profiles to be retrieved from state space x into measurement space y. Fig-ure 1 shows the final forward calculation of a retrieval per-formed using the HITRAN 2000 line parameters compilation (Rothman et al., 2003). The residuals in Fig. 1 show a perfect fit down to the noise level without any systematic residuals due to spectroscopic errors.
The retrieval is the (ill-posed) inverse mapping from y to
x which is formulated as a least squares problem. Due to the
non-linearity of F, a Newtonian iteration is applied and a reg-ularization term R∈<.n×nis used that allows one to constrain the solution and thereby avoid oscillating profiles
xi+1=xi +(Kx,iT S−ε1Kx,i)−1
×nKTx,iS−ε1[y−F (xi)] − R(xi−xa)
o, (1)
where the subscript i denotes the iteration index and xais the
a priori profile. Here Kx=∂F/∂x are the Jacobians and Sε
is the measurement covariance (assumed to be diagonal with a signal-to-rms-noise ratio of 100 in our formulation). Using Tikhonov regularization (Tikhonov, 1963), R is set up by the relation
R = αLTL, (2)
where α is the strength of the constraint operator L. We use the discrete first derivative operator L = L1
L1= −1 1 0 ... 0 0 −1 1 . .. ... .. . . .. . .. . .. 0 0 ... 0 −1 1 ∈ <(n−1)×n, (3)
which constrains x in a way such that a constant profile is favored for the difference x − xa. The prior xa is given in
Fig. 2. It was constructed using data from a 3-month ra-diosonde campaign at the Zugspitze (see Sect. 2.3 for de-tails). We use the mean profile scaled by 0.25 because oth-erwise retrievals for the driest days are not able to calculate a reasonable first iteration (because of saturated lines with no distinct line center position in a high IWV initial forward calculation).
The state vector x is set up on a 66-layer scheme with an exponential increase of layer width (0.162 km width for first layer above the Zugspitze site at 2964 m a.s.l. up to 5.292 km width for the last layer ending at 100 km a.s.l.). The state vector x is implemented in units of (dimensionless) scaling factors for the 66 layers relative to the a priori VMR pro-file (standard setting in SFIT 2). Therefore, the limiting case α → ∞represents free scaling of the a priori VMR profile with one altitude-constant factor (i.e., an infinitely strong constraint to the profile shape and a zero constraint to the absolute value of the column). The limiting case α →0 de-scribes a retrieval without any regularization (which will suf-fer from oscillating profiles). The tuning of α to achieve an optimum IWV retrieval is described in the next section.
2.3 Matching FTIR to radiosonde characteristics
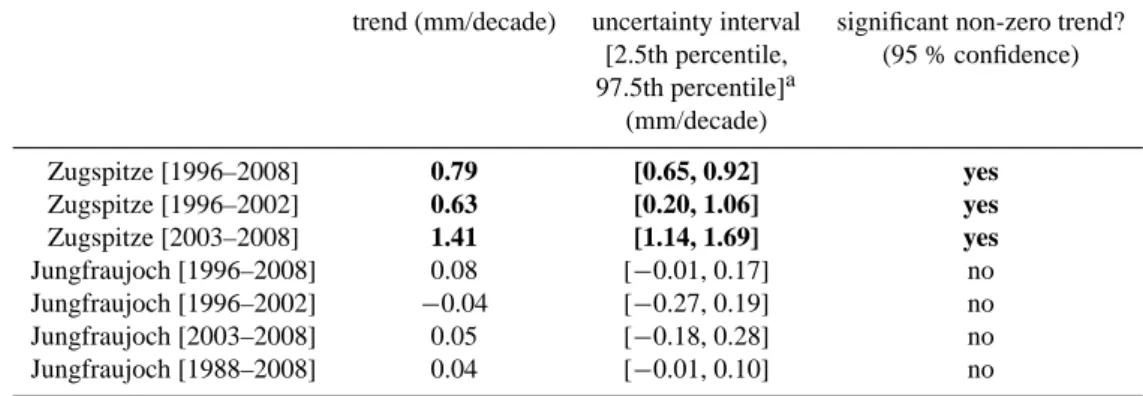
Section 2.2 left open the question of how to find an opti-mum setting for α. Figure 3a shows the correlation of IWV retrievals from Zugspitze FTIR measurements to coincident radiosondes for varied settings of α. Clearly, there is an im-pact of α on the quality of the correlation. Evidently, there is an impact on the slope of the linear fit to the scatter plot. Figure 3b shows all correlation parameters derived from the scatter plots of Fig. 3a (and from a few more scatter plots which are not shown) as a function of α. It can be seen that an optimum correlation (i.e., slope=1.0) can be achieved for αopt=183, corresponding to a dofs4 of 1.84. Figure 3c shows the underlying scatter plot for this optimum setting with R=0.99, slope=1.00 and a negligible bias and intercept of 0.015 mm5. This means that it is possible to obtain a high-quality match between the FTIR retrieval and the radiosonde
4degrees of freedom of signal, i.e., the spur of the averaging kernel matrix.
5a water vapor column of 1 mm corresponds to 3.345·1021molecules/cm2.
R. Sussmann et al.: Trends in column-integrated water vapor from the FTIR network 8991 response, i.e., the measurements of the sonde and the FTIR
no longer differ by a scaling factor after the matching. Data for the 25 FTIR-sonde coincidences in Fig. 3 have been obtained during the (19 August 2002–17 Novem-ber 2002) AIRS validation campaign (Sussmann and Camy-Peyret, 2002, 2003) with FTIR measurements at the Zugspitze (47.4◦N, 11.0◦E, 2964 m a.s.l) and 180 radioson-des launched at Garmisch (47.5◦N, 11.1◦E, 734 m a.s.l.).
The 25 IWV data from Zugspitze FTIR (y-axis in Fig. 3a, c) were obtained by averaging the IWV typically retrieved from 3–4 individual spectra (each obtained from 15–20 min integration) recorded within ±1 h around a ≈12:00 UT fixed time (i.e., the time of AIRS overpass top).
The 25 IWV data from the Garmisch radiosondes (x-axis in Fig. 3a, c) were each obtained from integration of one “Tobin-sonde” VMR profile above the Zugspitze altitude. This profile was derived from a pair of soundings according to the “best-estimate of the state of the atmosphere” princi-ple (Tobin et al., 2006). I.e., a first sonde was launched 1 h before topand a second sonde 5 min before top. The best es-timated humidity profile for the overpass time VMRTobin(z, top)was then constructed via inter-/extrapolation of the two soundings according to the relation
VMRTobin(z,top)=VMRsonde(z,t0)+(dVMR(z)/dt )(top−t0), (4) where for t0one uses the time of either of the two sondes at a level z as a starting point. See Fig. 3 in Sussmann and Camy-Peyret (2002) for an example.
For this purpose two sonde receivers were used operating on two different frequencies in parallel (Vaisala Digicora III, Marwin 21, SPS220G sounding processor). Vaisala RS80-30G radio sondes were used (A-Humicap sensor). Several studies have been carried out to assess water vapor measure-ment accuracy of the RS80-A sonde and develop corrections for different classes of errors (Wang et al., 2002; Miloshe-vich et al., 2001, 2004, 2006; Leiterer et al., 2005; Suortti et al., 2008). Since we are interested in IWV, we quantified the known effect of the temperature-dependent dry bias (mainly at low temperatures) by applying the correction suggested by Leiterer et al. (2005); to visualize this see Fig. 1 (left center image) in Suortti et al. (2008). The effect of the correction on IWV is only of the order of 1 per mille. We did not perform corrections for a possible overall bias from chemical contam-ination (e.g., term 11Uin Leiterer et al., 2005), because i) no statistical correction data are available for our RS80-A pro-duction batch, ii) our later trend analysis is not impacted by the possible existence of FTIR biases, and iii) there is no sig-nificant overall bias of our optimized FTIR retrieval versus the sondes (Fig. 3c).
2.4 Precision and bias
Two FTIR instruments are operated side-by-side at the Jungfraujoch, one Bruker IFS120HR and one home-made in-strument (see Sect. 3.1 for information on inin-struments and
1 2 3 4 -0.2 0.0 0.2 0.4 0.6 0.8 1.0 1.2 dofsopt= 1.84 opt= 183 (c) (b)
regularization strength of FTIR retrieval
104 103 102 101 100 10-1 slope (mm) intercept bias (mm) stdv (mm) R c o rrelat ion paramet ers F T IR - s onde
degrees of freedom of signal of FTIR retrieval
0 1 2 3 4 5 6 7 8 9 0 1 2 3 4 5 6 7 8 9 linear fit = opt = 183 dofs = dofsopt = 1.84 slope = 1.00 ± 0.03 intercept = 0.015 mm ± 0.121 mm bias = 0.015 mm ± 0.054 mm stdv = 0.27 mm R = 0.99 N = 25
IWV from Tobin radio sondes (mm)
IW V fr o m FT IR ( m m ) 0 1 2 3 4 5 6 7 8 9 0 1 2 3 4 5 6 7 8 9 (a) = 107 = 890 = 183 = 62 = 43 IW V fr o m FTIR ( m m )
IWV from Tobin radio sondes (mm) impact of regularization
strength of FTIR retrieval
Fig. 3. Procedure for matching FTIR retrievals of IWV to radiosonde characteristics. (a)
FTIR-sonde scatter plots for different settings of FTIR regularization strength
. (b) FTIR-sonde
correlation parameters derived from (a) as a function of
or dofs(
). (c) FTIR-sonde scatter plot
for the optimum FTIR retrieval with
opt= 183 leading to a slope of 1.00.
Fig. 3. Procedure for matching FTIR retrievals of IWV to ra-diosonde characteristics. (a) FTIR-sonde scatter plots for different settings of FTIR regularization strength α. (b) FTIR-sonde corre-lation parameters derived from (a) as a function of α or dofs(α). (c) FTIR-sonde scatter plot for the optimum FTIR retrieval with
0.1 1 10 0.0 0.1 0.2 0.3 0.4 0.5 0.6 0.7 0.8 0.9 2106 1682 1211 773 464 267 146 72 3202 32
FTIR-FTIR standard deviation (mm)
FTIR-FTIR coincidence interval (h)
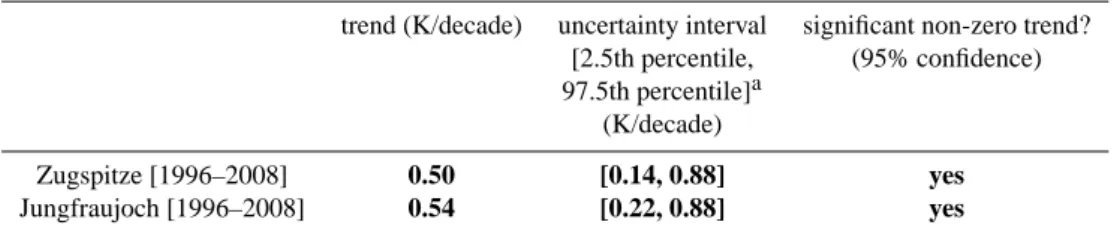
Fig. 4. Standard deviation of the IWV differences deduced from coincident measurements with
two FTIR systems at the Jungfraujoch between 1995 -2001 as a function of the temporal coincidence criterion (numbers give the amount of coincidences). Note that the exponential increase reflects an atmospheric property (water vapor variability) and is not due to the instruments.
Fig. 4. Standard deviation of the IWV differences deduced from coincident measurements with two FTIR systems at the Jungfrau-joch between 1995–2001 as a function of the temporal coincidence criterion (numbers give the amount of coincidences). Note that the exponential increase reflects an atmospheric property (water vapor variability) and is not due to the instruments.
site). We transferred the optimized IWV retrieval developed and tested for the Zugspitze FTIR to the two Jungfraujoch instruments (see Sect. 2.6 for the transfer procedure). We have further taken advantage of the quasi-simultaneous mea-surements available from the two Jungfraujoch time series (essentially in the 1995–2001 time span) to derive precision and bias of the IWV retrieval. See Table 2 for the result.
The given numbers were derived as follows. We applied different temporal coincidence criteria 1t to the individual column retrievals of the two time series and created a scatter plot for each coincidence ensemble. From these scatter plots we obtained the standard deviation stdv of the differences of coincident FTIR pairs as a function of 1t, see Fig. 4 and first 3 rows of Table 1: starting at 1t =3.75 min, a widening of 1tleads to an monotonous increase of stdv. I.e., atmospheric variability dominates stdv even at the smallest time scale of minutes. Unfortunately one cannot use 1t=0 because there is a tradeoff between reducing 1t and the number of remain-ing coincidences. In our case, we stopped at 1t =3.75 min which still gave 32 coincidences. So in general, the strictest temporal coincidence criterion which gives a sufficient sta-tistical sample of coincidences would ideally be used to de-rive an estimate of IWV measurement precision from side-by side intercomparisons. Even in so doing, the estimate will always be an upper limit. For 1t =3.75 min, we obtain stdv=0.07 mm (3.1% of mean IWV) for the pairwise differ-ences. Under the simplifying assumption of identical preci-sion for both FTIR systems, we calculate for the precipreci-sion prec of one FTIR instrument: prec<stdv/sqrt(2)=0.05 mm (or prec<2.2% of mean IWV).
A nearly negligible bias of 0.02(1) mm is found between the two Jungfraujoch FTIR instruments (for 1t =3.75 min). Note in Table 1, that the bias is not significantly altered when 1tis increased to 120 min.
2.5 Comparison to other techniques
Table 1 shows examples of comparisons of the different ground-based remote sounding techniques with radiosondes. First of all we discuss the comparison of the Zugspitze FTIR with Tobin sondes (4th row): The perfect slope of 1.00(3) is the result of our matching procedure where the intercept of 0.02(12) as well as the bias of 0.02(5) are negligibly small. The stdv of the coincident differences is 0.27 mm (or 7.9%), which is much higher than the stdv=0.07 mm found in the FTIR-FTIR side-by-side intercomparison for 1t =3.75 min (1st row in Table 1). Clearly, the stdv of 0.27 mm is dom-inated by atmospheric variability within the coincidence in-terval 1t =120 min and the 8 km horizontal distance 1x be-tween the FTIR and the sonde launching site. This inter-pretation is in line with the observation that nearly the same stdv, i.e., 8.0%, is found in the FTIR-FTIR side-by-side inter-comparison for 1t =120 min (3rd row in Table 1). In other words, no information on the precision of a ground-based sounder can be derived from a sonde intercomparison with a coincidence criterion of the order of 1–2 h, if the vertical sounder has good precision as is the case for the FTIR.
As an example for a ground-based microwave instrument, we show the sonde-correlation data for TROWARA (taken from Morland et al., 2006) in the 5th row of Table 1. The slope is 0.88, the intercept 1.36 mm, and the bias 0.36 mm. The stdv of 2.02 mm is relatively high. This is a result of the large distance between TROWARA and the launching site of the sondes (1x=40 km), i.e., the observed stdv=2.02 mm is not an appropriate measure of the (certainly significantly better) precision of TROWARA.
Morland et al. (2006) report correlating GPS and sun pho-tometer (PFR) data with sondes (6th and 7th row of Ta-ble 1). The PFR shows a smaller bias (0.08 mm) than the GPS (0.53 mm). For both intercomparisons a relatively high stdv on the order of 1 mm is found, which is again certainly a result of the large 1x =80 km.
The FTIR-sonde correlation data shown in the 8th row of Table 1 have been taken from Palm et al. (2008). The slope is 0.85(1) and the intercept 0.66(9) mm. Comparing these numbers to the FTIR-sonde slope of 1.00(3) and intercept of 0.02(12) mm from our work (4th row), one has to keep in mind that the Palm et al. (2008) results originate from an FTIR retrieval which is different than the one described in our work.
The intercomparison data of BASIL (Raman lidar) and GBMS (microwave) with sondes (9th sand 10th row of Ta-ble 1) were taken from Fiorucci et al. (2008). Both instru-ments show slopes very close to 1, very small intercepts and biases below 0.1 mm. The stdv is also very small which is the result of the very strict, temporal coincidence crite-ria (1t =20 min) and the fact that the sondes were launched right next to the ground-based vertical sounder (1x =0).
R. Sussmann et al.: Trends in column-integrated water vapor from the FTIR network 8993
Table 1. IWV correlation parameters from a FTIR side-by-side intercomparison and examples for comparisons of all different ground-based remote techniques versus radiosondes: FTIR, microwave (TROWARA, GBMS), GPS, sun photometer (PFR), and Raman lidar (BASIL). Errors are for 1-sigma confidence, N is the number of coincidences.
1t(min) 1xa(km) slope intercept (mm) bias (mm) stdv (mm) stdv (% of mean) R N
FTIR-FTIRb 3.75 0 1.001(7) 0.02(2) 0.02(1) 0.07 3.1 0.999 32 FTIR-FTIRb 30 0 1.008(4) 0.00(1) 0.02(1) 0.11 4.4 0.998 267 FTIR-FTIRb 120 0 1.002(5) 0.03(2) 0.04(1) 0.23 8.0 0.998 773 FTIR-sondec 120 8 1.00(3) 0.02(12) 0.02(5) 0.27 7.9 0.99 25 TROWARA-sonded 120 40 0.88 1.36 0.36 2.02 – – – Jungfraujoch GPS-sonded 30 80 1.12 0.39 0.53 1.39 – – Jungfraujoch PFR-sonded 30 80 0.76 0.52 0.08 1.01 – – – FTIR-sondee 120 0 0.85(1) 0.66(9) – – – – 136 BASIL-sondef 20 0 1.07(2) −0.04(3) 0.09(2) 0.07 3.6 0.99 17 GBMS-sondef 20 0 0.98(4) 0.08(7) 0.05(3) 0.15 8.9 0.98 23
aDistance between ground-based sounder and radiosonde launch site.bThis work (individual measurements of 2 Jungfraujoch FTIRs). cThis work (2 h-Zugspitze FTIR versus Tobin radiosondes, see Fig. 3c).dTaken from Figs. 9 and 10 in Morland et al. (2006).eTaken from Palm et al. (2008), retrieval different than that in our work. fComputed from digitalization of data points of Figs. 6 and 7a in Fiorucci et al. (2008).
2.6 Station-to-station harmonization
With briefly define what we mean by “station-to-station har-monization”. It is not “homogenization” in the sense of Ross and Elliott (2001) or Durre et al. (2009) which is dealing with abrupt changes in the time series median (“change points”) as a result of changes in observing and reporting practices, instrumentation, and processing algorithms at (radiosonde) stations. In the FTIR network there is practically no need for homogenization because there are no abrupt changes in instrumentation. The most critical thing to drift in a FTIR spectrometer is the instrumental line shape (ILS). However, any possible degradation in ILS essentially impacts profile retrievals but not the column integral, which is the target of this paper. Furthermore, the ILS is monitored regularly at all stations. Another possible drift could be in zero level of the spectra due to detector non-linearity in combination with degrading optical components. However, this would impact retrieved columns by typically <1%, i.e., <0.02–0.03 mm for the mean IWV levels encountered in this study. This is negligible compared to the IWV variations investigated here (e.g., 0.8 mm/decade, see Table 3). Also the FTIR retrieval of the whole IWV time series is done in one batch run of one algorithm.
With “station-to-station harmonization” we address the fact that scientists at different FTIR stations would most probably set their algorithms in a different manner leading to differing response characteristics of the IWV retrievals. Therefore, we understand harmonization as a process of set-ting the algorithms for retrieving IWV from FTIR measure-ments at different stations in a way to operate consistently. After harmonization, the FTIR sounding systems of
differ-Table 2. Precision (1 sigma) and bias of optimized FTIR IWV re-trievals derived from a side-by-side intercomparison of two FTIR instruments at the Jungfraujoch.
precision precision bias bias
(mm) (% of mean IWV) (mm) (% of mean IWV)
0.05 2.2 0.02(1) 0.96(52)
ent stations (comprising the instruments and retrieval algo-rithms) should show the same response to true variations in IWV.
A crucial point of our harmonization is that the water vapor retrieval described here can be implemented in the community-retrieval algorithm SFIT 2 (Pougatchev et al., 1995) without performing any changes to the code. The re-trieval set up described in Sects. 2.2 and 2.3 can therefore be applied to all ground-based FTIR groups of the NDACC net-work which will allow harmonized netnet-work-trend studies on IWV. A first example for this is given in Sect. 3 for the case of the Zugspitze and Jungfraujoch NDACC stations.
The algorithm harmonization is achieved via exchange of only a few control files, i.e., “binput” (containing among other fitting parameters the definition of microwindows shown in Fig. 1), “refmod” (containing the a priori profile given in Fig. 2; it should be applicable to all stations because there is no strong gradient around the tropopause), and the “cfgl-files” (containing the spectroscopic line list). Care has to be taken to use the same rule for setting up the exponen-tial retrieval layer grid as described in Sect. 2.2 at all stations
Table 3. Existence and significance of IWV trends derived from harmonized FTIR measurements at the Zugspitze and Jungfraujoch via bootstrap resampling.
trend (mm/decade) uncertainty interval significant non-zero trend? [2.5th percentile, (95 % confidence) 97.5th percentile]a (mm/decade) Zugspitze [1996–2008] 0.79 [0.65, 0.92] yes Zugspitze [1996–2002] 0.63 [0.20, 1.06] yes Zugspitze [2003–2008] 1.41 [1.14, 1.69] yes Jungfraujoch [1996–2008] 0.08 [−0.01, 0.17] no Jungfraujoch [1996–2002] −0.04 [−0.27, 0.19] no Jungfraujoch [2003–2008] 0.05 [−0.18, 0.28] no Jungfraujoch [1988–2008] 0.04 [−0.01, 0.10] no
aUnderlying uncertainty distributions constructed via 5000 bootstrap resamplings for each trend.
(“bnd-file”). This is important because the strength and al-titude dependency of the effective regularization scheme de-pends on the details of the vertical grid.
In order to find a harmonized optimum α value for each station, clearly, the best approach would be to use a set of co-incident radiosondes and follow the approach described for the Zugspitze in Sect. 2.3 for the other stations. However, if this kind of data is not available for some stations or if the stations have similar geophysical characteristics (IWV lev-els, station altitude), a simplified approach would be to just use the same value of αopt=183 as found for the Zugspitze. However, in so doing one has to take into account that effec-tive regularization strength depends linearly on spectral point spacing p. Therefore, possible station-to-station differences in p should be compensated for by correcting α according to the relation
αstation/αZugspitze=pZugspitze/pstation, (5) with αZugspitze=183 and pZugspitze=0.0015 cm−1 as refer-ence.
Finally, harmonizing the procedure for final quality selec-tion of the IWV retrievals at different staselec-tions is an important task. For this purpose, a threshold for the root-mean-square (rms) residuals of the spectral fit was used. A value for the threshold was derived by inspection of the probability dis-tribution of all residuals of the Zugspitze time series. This distribution is right skewed with only 5% of the retrievals showing exceptionally high rms residuals. Therefore, the rms threshold was set to exclude these 5%. We found a very sim-ilar behavior for the Jungfraujoch retrievals. Therefore, we suggest that to harmonize, a quality selection be made by tuning the threshold for the rms residuals at each station so that ≈5% of the IWV retrievals, i.e. those with the largest residuals, are excluded.
3 First application examples
3.1 Harmonized Zugspitze and Jungfraujoch FTIR
time series
The Zugspitze (47.4◦N, 11.0◦E, 2964 m a.s.l) solar FTIR system was set up in 1995 as part of the “Alpine Station” of the NDACC network. It is operated by the Group “At-mospheric Variability and Trends” at IMK-IFU6, Karlsruhe Institute of Technology, together with a variety of additional sounding systems at the Zugspitze/Garmisch site. These in-clude an NDACC aerosol lidar and an NDACC UV spectro-radiometer. The FTIR team contributes to satellite validation and studies of atmospheric variability and trends (e.g., Suss-mann and Buchwitz, 2005; SussSuss-mann et al., 2005a, b). The FTIR system is based upon a Bruker IFS125HR interferom-eter; details can be found in Sussmann and Sch¨afer (1997). The spectra used for IWV retrieval have been recorded with an optical path difference (OPD) of typically 250 cm, av-eraging a number of 8 scans (15–20 min integration time). Pressure-temperature profiles, necessary for the inversion, have been taken from the National Center for Environmen-tal Prediction (NCEP) automailer. For quality selection of the IWV retrievals, a threshold for the rms residuals of the spectral fit was used (see Sect. 2.6 for details). The resulting Zugspitze time series including the years 1996–2008 com-prises IWV retrievals from a number of 5815 individual spec-tra as displayed in Fig. 5. The retrievals contain a mean dofs of 1.88.
High-resolution FTIR solar absorption spectra are regu-larly recorded at the Jungfraujoch station (46.5◦N, 8.0◦E, 3580 m a.s.l.) since 1984, with a home-made instrument in-stalled at the Coud´e focus of the Jungfraujoch telescope. In 1990, a commercial Bruker IFS120HR has augmented the 6Institute for Meteorology and Climate Research – Atmospheric Environmental Research, http://www.imk-ifu.kit.edu/113.php.
R. Sussmann et al.: Trends in column-integrated water vapor from the FTIR network 8995 96 97 98 99 00 01 02 03 04 05 06 07 08 09 0 1 2 3 4 5 6 7 8 9 10 11 12 13
Zugspitze FTIR
measured trend + intra-annual trend
integrated water vapor (mm
)
Fig. 5. Time series of Zugspitze (47.4 °N, 11.0 °E, 2964 m a.s.l) FTIR IWV retrievals from
individual measurements (15-20 min integration) matched to radiosonde characteristics. See Table 3 for the trend analysis results.
Fig. 5. Time series of Zugspitze (47.4◦N, 11.0◦E, 2964 m a.s.l) FTIR IWV retrievals from individual measurements (15–20 min in-tegration) matched to radiosonde characteristics. See Table 3 for the trend analysis results.
observational capacity of the site. Both spectrometers are maintained and operated by the GIRPAS group of the Uni-versity of Li`ege (Groupe Infra-Rouge de Physique Atmo-sph´erique et Solaire). More information on these instruments and on important related key findings can be found in Zan-der et al. (2008) and references therein. Jungfraujoch data are further used for the calibration and validation of atmo-spheric space-based sensors (e.g., Mahieu et al., 2008). The spectra from the home-made instrument used here have been recorded with an OPD of 82 cm, including 7 scans per spec-trum for an integration time of 37 min. For the Bruker instru-ment, the OPD was either equal to 82 or 125 cm, averaging 6 or 18 scans per spectrum, with resulting integration times ranging from 3 to 15 min. Assumed pressure-temperature profiles were also provided by NCEP.
The retrievals of the two different Jungfraujoch FTIRs were harmonized with the optimized, Zugspitze FTIR re-trieval as described in Sect. 2.6. In particular, the spectral point spacings of the two Jungfraujoch FTIRs (0.0061 cm−1 for the home-made instrument and 0.0038 cm−1 for the Bruker) differ from the one of the Zugspitze instrument. Therefore, the regularization strength for each Jungfraujoch FTIR had to be harmonized separately with the Zugspitze in-strument according to Eq. (5).
For quality selection of the IWV retrievals, a threshold for the rms residuals was set so as to exclude the highest-rms retrievals (5% of total retrievals) as described above for the Zugspitze. The resulting Jungfraujoch time series from the years 1988–2008 comprises IWV retrievals from a number of 8045 individual spectra as displayed in Fig. 6. The retrievals contain a mean dofs of 1.87.
88 90 92 94 96 98 00 02 04 06 08 0 1 2 3 4 5 6 7 8 9
10 measured trend + intra-annual trend
Jungfraujoch FTIR
integrated water vapor (mm)
Fig. 6. Time series of Jungfraujoch (46.5° N, 8.0° E, 3580 m a.s.l.) FTIR IWV retrievals from
individual measurements (with integration times ranging from 3 to 37 min, depending on the instrument and/or OPD) harmonized with the Zugspitze retrievals. See Table 3 for the trend analysis results.
Fig. 6. Time series of Jungfraujoch (46.5◦N, 8.0◦E, 3580 m a.s.l.) FTIR IWV retrievals from individual measurements (with integra-tion times ranging from 3 to 37 min, depending on the instrument and/or OPD) harmonized with the Zugspitze retrievals. See Table 3 for the trend analysis results.
3.2 IWV trends
First examples for IWV trend analysis have been obtained from the Zugspitze and Jungfraujoch records. The analysis is based on the approach described in Gardiner et al. (2008). Briefly, the approach augments a basic linear trend model applied to the time series after substraction of a fitted intra-annual function and uses least squares regression in con-junction with a bootstrap resampling of the residuals in or-der to determine confidence limits associated with the trend estimates. For the inter-annual model, a 3rd order Fourier series (a constant and 3 sine and 3 cosine components) is used. In order to investigate the significance of the trends, the null hypothesis was tested for each analysis to verify that “there is no underlying straight-line trend over the time span of the data”, i.e. the gradient of the underlying long-term trend in the regression model is zero. The sampling distri-bution of the gradient of the underlying straight-line trend term is determined empirically using bootstrap resampling. This technique resamples the residuals (differences between inter-annual-plus-linear trend model and individual measure-ment points), i.e., exchanges dates and times of the residuals within the series. If the 95% confidence interval associated with the gradient computed from this empirical distribution does not contain zero then, in a formal statistical sense, there is reason to doubt the null hypothesis.
Sampling issues may impact slightly the absolute magni-tude of the trend, but sampling issues do not impact the prin-cipal decision on the existence of a significant trend (this is the only result exploited in our later geophysical inter-pretation). This is because the probability density function (pdf) of the magnitude of all water vapor columns compris-ing the time series of a station is typically right skewed
Table 4. Existence and significance of surface-temperature trends at the Zugspitze and Jungfraujoch stations derived from weather-service data (noon snapshots) via bootstrap resampling.
trend (K/decade) uncertainty interval significant non-zero trend? [2.5th percentile, (95% confidence) 97.5th percentile]a
(K/decade)
Zugspitze [1996–2008] 0.50 [0.14, 0.88] yes
Jungfraujoch [1996–2008] 0.54 [0.22, 0.88] yes
aUnderlying uncertainty distributions constructed via 1000 bootstrap resamplings for each trend.
(non-Gaussian) with occasionally very high spikes, espe-cially in summer. In years with less dense measurement sam-pling, such high values could be missed and this could impact the linear trend result. However, a possible decision on sig-nificant trend existence is not impacted. This is because the bootstrap resampling constructs a pdf of linear trend values that is consistent with all residuals, resampled at any date and time of the whole time series, not dependent on when in the time series they arose. The confidence interval tends to become narrower in case of a denser and more uniform sam-pling. Therefore, the finding of the existence of a significant trend (yes) would not be reversed (no trend) on more uniform sampling.
The trend results are given in Table 3 and can be summa-rized as follows:
1. The Zugspitze IWV shows a significant positive trend for all of the analyzed time intervals [1996–2008], [1996–2002], and [2003–2008].
2. The Zugspitze trend in the last 6 years [2003–2008] is significantly higher than in the 7 years before [1996– 2002].
3. The Jungfraujoch time series does not show a signifi-cant trend for any of the analyzed time intervals [1988– 2008], [1996–2008], [1996–2002], or [2003–2008]. On a first glance, the near-zero Jungfraujoch trend seems to be not in line with the significantly positive trend above Zugspitze - given the fact that the surface temperature trends for both Jungfraujoch and Zugspitze are significantly posi-tive and practically of same magnitude (≈0.5 K/decade), see Table 4.
However, such kind of co-varying of humidity and tem-perature is only expected above the oceans or on global-mean basis. Above the oceans the water-vapor column trends are thermodynamically linked (strongly correlated) with SST trends (Bates et al., 2001; Vonder Haar et al., 2005; Wagner et al., 2006; Mieruch et al., 2008). This is because of the quasi-infinite ocean reservoir. The global-mean (or ocean-only) column trends are consistent with the assumption of a
constant relative humidity. This holds true for both free tro-posphere and total columns (Soden et al., 2005).
However, such global-mean trends cannot be compared with IWV measurements at individual FTIR stations above land, which are only representative on local to regional scales. The finding from our study is that, above land, IWV trends can be significantly different on relatively small spa-tial scales such as the distance of ≈250 km between the Jungfraujoch and the Zugspitze. The interpretation would be that, for sites above land, there is no infinite (ocean) reservoir which would guarantee a thermodynamic moistening driven by temperature increase. Therefore, the trends above country sites would be more likely dominated by local-to-regional-scale non-thermodynamic effects (e.g., changes in meteorol-ogy, biosphere, land use). This interpretation is confirmed by recent analyses of new-generation satellite data which show that, above land, significant differences and even changes in sign in IWV trends do regularly occur on relatively small re-gional scales; i.e., the correlation to near-surface temperature was found to be much less distinct above land than above the oceans (Bates et al., 2001; Vonder Haar et al., 2005; Wag-ner et al., 2006; Mieruch et al., 2008). A detailed IWV-trend study comprising the full set of NDACC FTIR long-term records as well as model data is subject of an upcoming publication (Sussmann et al., 2009).
4 Summary and conclusions
We have set up a new optimized retrieval of IWV from ground-based, mid-infrared solar FTIR spectrometry based upon a Tikhonov approach constraining the derivative (with respect to height) of the retrieved water profiles given in units of per cent differences relative to an a priori profile. With this method it has been possible to demonstrate, for the first time, a correlation of FTIR retrieved IWV with respect to ra-diosondes with an ideal slope of 1.00(3); such correlations are the result of an iterative retrieval matching procedure. All other correlation parameters (intercept=0.02(12) mm, bias=0.02(5) mm, stdv=0.27 mm, R=0.99) of our FTIR-sonde intercomparison were found to be comparable to or
R. Sussmann et al.: Trends in column-integrated water vapor from the FTIR network 8997 better than example results reported in the literature for sonde
intercomparisons of the best among other ground-based IWV sounding techniques (microwave, Raman lidar).
A FTIR-FTIR side-by-side intercomparison reveals a strong exponential increase in the stdv of the coincident IWV differences as a function of increasing temporal mismatch starting at 1t≈1 min. From this we learn that it is difficult, if not impossible, to derive the IWV precision of a ground-based remote sounder from a sonde intercomparison exer-cise even if the sondes are launched in the close vicinity of the ground-based instrument. This is because it is impossi-ble to reduce 1t below the >20–30 min ascent time required to reasonably sample the total humidity column by sondes and there is already a significant impact of natural water va-por variability on this time scale. A best estimate for IWV precision is therefore derived from a side-by-side intercom-parison of two instruments of the same class because 1t can be reduced down to minutes. We did this with an FTIR-FTIR intercomparison at the Jungfraujoch, where we were able to derive an upper limit for the precision of 0.05 mm (or 2.2% of the mean IWV). The bias found for the two FTIR instruments used in the side-by-side intercomparison is nearly negligible (0.02(1) mm). Finally, we have presented a harmonization concept so that the new and optimized FTIR retrieval can be implemented at other stations of the NDACC network.
We gave first application examples for the IWV retrieval and inter-station harmonization concept: IWV data sets from the two FTIR long-term records of the Zugspitze and Jungfraujoch NDACC stations were derived, covering the time intervals [1996–2008] and [1988–2008], respectively. For the Zugspitze a significant trend of 0.79 mm/decade was found for the full time period [1996–2008] with an uncer-tainty interval of [0.65, 0.92] mm/decade (95% confidence). There was a significantly increased trend of 1.41 [1.14, 1.69] mm/decade in the second part of the time series [2003– 2008] compared to 0.63 [0.20, 1.06] mm/decade in the first part [1996–2002]. For the Jungfraujoch no significant trend was found in any of the investigated periods, i.e. [1988– 2008], [1996–2008], [1996–2002], or [2003–2008]. Our dif-fering Zugspitze and Jungfraujoch trend results represent a confirmation of the relatively new but more and more estab-lished finding that, above land, significant differences in wa-ter vapor trends do occur on regional scales, in spite of the relatively homogenous surface temperature trends.
In conclusion we have shown that IWV can be retrieved at two different FTIR stations in a harmonized way and cor-related with radiosondes with a slope of 1.00. There are more than a dozen additional solar FTIR records covering more than a decade at stations around the globe operated by NDACC affiliated groups. Therefore, the concepts of our paper provide a basis for upcoming joint IWV trend studies by the FTIR network. These data will complement existing trend data sets on a global scale which up to now have been based primarily on radiosondes and satellite data.
Acknowledgements. We would like to thank H. P. Schmid (IMK-IFU) for his continual interest in this work. Funding by EUMETSAT (contract EUM/CO/01/892/PS) and the EC within the projects UFTIR (contract EVK2-CT-2002-00159), HYMN (contract 037048), and GEOMON (contract 036677) is gratefully acknowledged. This work is part of the EC-Network of Excellence ACCENT-TROPOSAT-2. The Belgian contribution to this study was supported by the GAW-CH Plus (“FTIR Jungfraujoch”) and by the Belgian Science Policy Office (BELSPO, Brussels) through the AGACC and SECPEA projects. The GIRPAS team further thanks the International Foundation High Altitude Research Stations Jungfraujoch and Gornergrat (HFSJG, Bern) for supporting the facilities needed to perform the observations.
Edited by: S. Buehler
References
Bates, J. and Jackson, D.: Trends in Upper-Tropospheric Humidity, Geopyhs. Res. Lett., 28, 1695–1698, 2001.
Christy, J. R., Spencer, R. W., and Lobl, E. S.: Analysis of the merging procedure for the MSU daily temperature time series, J. Climate, 11, 2016–2041, 1998.
Durre, I., Williams Jr., C. N., Yin, X., and Vose, R. S.: Radiosonde-based trends in precipitable water over the North-ern Hemisphere: An update, J. Geophys. Res., 114, D05112, doi:10.1029/2008JD010989, 2009.
Elliott, W. P., Ross, R. J., and Blackmore, W. H.: Recent changes in NWS upper-air observations with emphasis on changes from VIZ to Vaisala radiosondes, B. Am. Meteor. Soc., 83, 1003–1017, 2002.
Fiorucci, I., Muscari, G., Bianchi, C., Di Girolamo, P., Esposito, F., Grieco, G., Summa, D., Bianchini, G., Palchetti, L., Cacciani, M., Di Iorio, T., Pavese, G., Cimini, D., de Zafa, R. L.: Measure-ments of low amounts of precipitable water vapor by millimeter wave spectroscopy: An intercomparison with radiosonde, Ra-man lidar, and Fourier transform infrared data, J. Geophys. Res., 113, D14314, doi:10.1029/2008JD009831, 2008.
Gardiner, T., Forbes, A., de Mazi`ere, M., Vigouroux, C., Mahieu, E., Demoulin, P., Velazco, V., Notholt, J., Blumenstock, T., Hase, F., Kramer, I., Sussmann, R., Stremme, W., Mellqvist, J., Strand-berg, A., Ellingsen, K., and Gauss, M.: Trend analysis of green-house gases over Europe measured by a network of ground-based remote FTIR instruments, Atmos. Chem. Phys., 8, 6719–6727, 2008,
http://www.atmos-chem-phys.net/8/6719/2008/.
Hurrell, J. W. and Trenberth, K. E.: Spurious trends in satellite MSU temperatures from merging different satellite records, Na-ture, 386, 164–167, 1997.
Hurrell, J. W. and Trenberth, K. E.: Difficulties in obtaining reli-able temperature trends: reconciling the surface and satellite mi-crowave sounding unit records, J. Climate, 11, 945–967, 1998. Leiterer, U., Althausen, D., Franke, K., Katz, A., and Wegner, F.:
Correction method for RS80-A Humicap humidity profiles and their validation by lidar backscattering profiles in tropical cirrus clouds, J. Atmos. Oceanic Technol., 22, 18–29, 2005.
Mahieu, E., Duchatelet, P., Demoulin, P., Walker, K. A., Dupuy, E., Froidevaux, L., Randall, C., Catoire, V., Strong, K., Boone, C. D., Bernath, P. F., Blavier, J.-F., Blumenstock, T., Coffey, M.,
De Mazi`ere, M., Griffith, D., Hannigan, J., Hase, F., Jones, N., Jucks, K. W., Kagawa, A., Kasai, Y., Mebarki, Y., Mikuteit, S., Nassar, R., Notholt, J., Rinsland, C. P., Robert, C., Schrems, O., Senten, C., Smale, D., Taylor, J., T´etard, C., Toon, G. C., Warneke, T., Wood, S. W., Zander, R., and Servais, C.: Vali-dation of ACE-FTS v2.2 measurements of HCl, HF, CCl3F and CCl2F2using space-, balloon- and ground-based instrument ob-servations, Atmos. Chem. Phys., 8, 6199–6221, 2008,
http://www.atmos-chem-phys.net/8/6199/2008/.
Mieruch, S., No¨el, S., Bovensmann, H., and Burrows, J. P.: Anal-ysis of global water vapour trends from satellite measurements in the visible spectral range, Atmos. Chem. Phys., 8, 491–504, 2008,
http://www.atmos-chem-phys.net/8/491/2008/.
Miloshevich, L. M., V¨omel, H., Paukkunen, A., Heymsfield, A. J., and Oltmans, S. J.: Characterization and correction of rela-tive humidity measurements from Vaisala RS80-A radiosondes at cold temperatures, J. Atmos. Oceanic Technol., 18, 135–156, 2001.
Miloshevich, L. M., Paukkunen, A., V¨omel, H., and Oltmans, S. J.: Development and validation of a time lag correction for Vaisala radiosonde humidity measurements, J. Atmos. Oceanic Technol., 21, 1305–1327, 2004.
Miloshevich, L. M., V¨omel, H., Whiteman, D. N., Lesht, B. M., Schmidlin, F. J., and Russo, F.: Absolute accuracy of wa-ter vapour measurements from six operational radiosonde types launched during AWEX-G and implications for AIRS validation, J. Geophys. Res., 111, D09S10, doi:10.1029/2005JD006083, 2006.
Morland, J., Deuber, B., Feist, D. G., Martin, L., Nyeki, S., K¨ampfer, N., M¨atzler, C., Jeannet, P., and Vuilleumier, L.: The STARTWAVE atmospheric water database, Atmos. Chem. Phys., 6, 2039–2056, 2006,
http://www.atmos-chem-phys.net/6/2039/2006/.
Palm, M., Melsheimer, C., No¨el, S., Notholt, J., Burrows, J., and Schrems, O.: Integrated water vapor above Ny ˚Alesund, Spits-bergen: a multisensor intercomparison, Atmos. Chem. Phys. Dis-cuss., 8, 21171–21199, 2008,
http://www.atmos-chem-phys-discuss.net/8/21171/2008/. Philipona, R., D¨urr, B., Marty, C., Ohmura, A., and Wild, M.:
Ra-diative forcing - measured at Earth’s surface – corroborate the increasing greenhouse effect, Geophys. Res. Lett., 31, L03202, doi:10.1029/2003GL018765, 2004.
Philipona, R., D¨urr, B., Ohmura, A., and Ruckstuhl, C.: Anthro-pogenic greenhouse forcing and strong water vapor feedback in-crease temperature in Europe, Geophys. Res. Lett., 32, L19809, doi:10.1029/2005GL023624, 2005.
Pougatchev, N. S., Connor, B. J., and Rinsland, C. P.: Infrared mea-surements of the ozone vertical distribution above Kitt Peak, J. Geophys. Res., 100, 16689–16697, 1995.
Rinsland, C. P., Boughner, R. E., Larsen, J. C., Stokes, G. M., and Brault, J. W.: Diurnal variations of atmospheric nitric oxide: ground-based infrared spectroscopic measurements and their in-terpretation with time dependent photochemical model calcula-tions, J. Geophys. Res. 89, 9613–9622, 1984.
Randel, D. L., Vonder Haar, T. H., Ringerud, M. A., Stephens, G. L., Greenwald, T. J., and Combs, C. L.: A New Global Water Vapor Dataset, B. Am. Meteor. Soc., 77, 1233–1246, 1996. Ross, R. J. and Elliott, W. P.: Radiosonde-Based Northern
Hemi-sphere Tropospheric Water Vapor Trends, J. Climate, 14, 1602– 1612, 2001.
Rothmann, L. S., Barbe, A., Benner, D. C., Brown, L. R., Camy-Peyret, C., Carleer, M. R., Chance, K., Clerbaux, C., Dana, V., Devi, V. M., Fayt, A., Flaud, J. M., Gamache, R. R., Goldman, A., Jacquemart, D., Jucks, K. W., Lafferty, W. J., Mandin, J. Y., Massie, S. T., Nemtchinov, V., Newnham, D. A., Perrin, A., Rins-land, C. P., Schroeder, J., Smith, K. M., Smith, M. A. H., Tang, K., Toth, R. A., Vander Auwera, J., Varanasi, P., and Yoshino, K.: The HITRAN molecular spectroscopic database: edition of 2000 including updates through 2001, J. Quant. Spectr. Radiat. Transfer, 82, 5–44, 2003.
Schneider, M., Hase, F., and Blumenstock, T.: Water vapour profiles by ground-based FTIR spectroscopy: study for an optimised re-trieval and its validation, Atmos. Chem. Phys., 6, 811–830, 2006, http://www.atmos-chem-phys.net/6/811/2006/.
Soden, B. J., Jackson, D. L., Ramaswamy, V., Schwarzkopf, M. D., and Huang, X.: The radiative signature of upper tropospheric moistening, Science, 310, 841–844, 2005.
Suortti, T. M., Kats, A., Kivi, R., K¨ampfer, N., Leiterer, U., Milo-shevich, M. L., Neuber, R., Paukkunen, A., Ruppert, P., V¨omel, H., and Yushkov, V.: Tropospheric Comparisons of Vaisala Radiosondes and Balloon-Borne Frost-Point and Lyman-α Hy-grometers during the LAUTLOS-WAVVAP Experiment, J. At-mos. Oceanic Technol., 25, 149–166, 2008.
Sussmann, R. and Sch¨afer, K: Infrared spectroscopy of tropospheric trace gases: combined analysis of horizontal and vertical column abundances, Appl. Opt., 36, 735–741, 1997.
Sussmann, R. and Camy-Peyret, C.: Ground-Truthing Center Zugspitze, Germany for AIRS/IASI Validation, Phase I Re-port, EUMETSAT, 2002, 18 pp., http://www.imk-ifu.kit.edu/ downloads/AIRSVAL Phase I Report.pdf, 2002.
Sussmann, R. and Camy-Peyret, C.: Ground-Truthing Center Zugspitze, Germany for AIRS/IASI Validation, Phase II Re-port, EUMETSAT, 2003, 15 pp., http://www.imk-ifu.kit.edu/ downloads/AIRSVAL Phase II Report.pdf, 2003.
Sussmann, R. and Buchwitz, M.: Initial validation of EN-VISAT/SCIAMACHY columnar CO by FTIR profile retrievals at the Ground-Truthing Station Zugspitze, Atmos. Chem. Phys., 5, 1497–1503, 2005,
http://www.atmos-chem-phys.net/5/1497/2005/.
Sussmann, R., Stremme, W., Buchwitz, M., and de Beek, R.: Val-idation of ENVISAT/SCIAMACHY columnar methane by so-lar FTIR spectrometry at the Ground-Truthing Station Zugspitze, Atmos. Chem. Phys., 5, 2419–2429, 2005,
http://www.atmos-chem-phys.net/5/2419/2005/.
Sussmann, R., Stremme, W., Burrows, J. P., Richter, A., Seiler, W., and Rettinger, M.: Stratospheric and tropospheric NO2 vari-ability on the diurnal and annual scale: a combined retrieval from ENVISAT/SCIAMACHY and solar FTIR at the Permanent Ground-Truthing Facility Zugspitze/Garmisch, Atmos. Chem. Phys., 5, 2657–2677, 2005,
http://www.atmos-chem-phys.net/5/2657/2005/.
Sussmann, R. and Borsdorff, T.: Technical Note: Interference errors in infrared remote sounding of the atmosphere, Atmos. Chem. Phys., 7, 3537–3557, 2007,
http://www.atmos-chem-phys.net/7/3537/2007/.
Tikhonov, A.: On the solution of incorrectly stated problems and a method of regularization, Dokl. Acad. Nauk SSSR, 151, 501–
R. Sussmann et al.: Trends in column-integrated water vapor from the FTIR network 8999
504, 1963.
Tobin, D. C., Revercomb, H. E., Knuteson, R. O., Lesht, B. M, Strow, L. L., Hannon, S. E.: Feltz, W. F., Moy, L. A., Fetzer, E. J., and Cress, T. S.: Atmospheric Radiation Measurement site atmospheric state best estimates for Atmospheric Infrared Sounder temperature and water vapor retrieval validation, J. Geo-phys. Res., 111, D09S14, doi:10.1029/2005JD006103, 2006. Trenberth, K. E., Fasullo, J., and Smith, L.: Trends and variability in
column-integrated atmospheric water vapor, Clim. Dynam., 24, 741–758, doi:10.1007/s00382-005-0017-4, 2005.
Trenberth, K. E., Jones, P. D., Ambenje, P., Bojariu, R., Easterling, D., Klein Tank, A., Parker, D., Rahimzadeh, F., Renwick, J. A., Rusticucci, M., Soden, B., and Zhai, P.: Observations: Surface and Atmospheric Climate Change. In: Climate Change 2007: The Physical Science Basis. Contribution of Working Group I to the Fourth Assessment Report of the Intergovernmental Panel on Climate Change, edited by: Solomon, S., Qin, D., Manning, M., et al., 10 Cambridge University Press, Cambridge, UK and New York, NY, USA, 2007.
Vonder Haar, T. H., Forsythe, J. M., McKague, D., Randel, D. L., Ruston, B. C., Woo, S.: Continuation of the NVAP global water vapor data sets for Pathfinder science analy-sis, Science and Technology Corporation Technical Report 3333, 44 pp., http://eosweb.larc.nasa.gov/PRODOCS/nvap/sci tech report 3333.pdf, 2003.
Vonder Haar, T. H., Forsythe, J. M., Juo, J., Randel, D. L., and Woo, S.: Water vapor trends and variability from the global NVAP dataset, 16th Symposium on Global Change and Climate Varia-tions, 9–13 January 2005, San Diego, California, American Me-teorological Society, P5.16, 2005.
Wagner, T., Beirle, S., Grzegorski, M., and Platt, U.: Global trends (1996–2003) of total column precipitable water observed by Global Ozone Monitoring Experiment (GOME) on ERS-2 and their relation to near-surface temperature, J. Geophys. Res., 111, D12102, doi:10.1029/2005JD006523, 2006.
Wang, J., Cole, H. L., Carlson, D. J., Miller, E. R., Beierle, K., Paukkunen, A., and Laine, T. K.: Corrections of humidity mea-surement errors from the Vaisala RS80 radiosonde – Application to TOGA COARE data, J. Atmos. Oceanic Technol., 19, 981– 1002, 2002.
Wentz, F. J. and Schabel, M.: Effects of satellite orbital decay on MSU lower tropospheric temperature trends, Nature, 394, 661– 664, 1998.
Wentz, F. J. and Schabel, M.: Precise climate monitoring using complementary satellite data sets, Nature, 403, 414–416, 2000. Zander, R., Mahieu, E., Demoulin, P., Duchatelet, P., Roland, G.,
Servais, C., De Mazi`ere, M., Reimann, S., and Rinsland, C. P.: Our changing atmosphere: Evidence based on long-term infrared solar observations at the Jungfraujoch since 1950, Sci. Total En-viron., 391, 184–195, 2008.


![[PDF] Cours pour apprendre le langage Html par la pratique PDF - Cours HTML](data:image/gif;base64,R0lGODlhAQABAIAAAP///wAAACH5BAEAAAAALAAAAAABAAEAAAICRAEAOw==)