UNIVERSITÉ DE MONTRÉAL
BIOLOGICAL ION EXCHANGE FILTERS
AS AN ALTERNATIVE TO BIOLOGICAL ACTIVATED CARBON IN DRINKING WATER
NARGESS AMINI
DÉPARTEMENT DES GÉNIES CIVIL, GÉOLOGIQUE ET DES MINES POLYTECHNIQUE MONTRÉAL
MÉMOIRE PRÉSENTÉ EN VUE DE L’OBTENTION DU DIPLÔME DE MAÎTRISE ÈS SCIENCES APPLIQUÉES
(GÉNIE CIVIL) JUILLET 2018
UNIVERSITÉ DE MONTRÉAL
ÉCOLE POLYTECHNIQUE DE MONTRÉAL
Ce mémoire intitulé :
BIOLOGICAL ION EXCHANGE FILTERS
AS AN ALTERNATIVE TO BIOLOGICAL ACTIVATED CARBON IN DRINKING WATER
présenté par : AMINI Nargess
en vue de l’obtention du diplôme de : Maîtrise ès sciences appliquées a été dûment accepté par le jury d’examen constitué de :
Mme PRÉVOST Michèle, Ph. D., présidente
M. BARBEAU Benoit, Ph. D., membre et directeur de recherche Mme BASU Onita, Ph. D., membre
DEDICATION
ACKNOWLEDGEMENTS
It was quite a journey. I learned so much and got a chance to meet amazing people. To make it simple, this journey changed my life path and taught me a new one.
Without doubt, the first person to acknowledge is my supervisor, Professor Benoit Barbeau. Someone who is respected because of his vast knowledge, his work/ research attitude, and also because of his admirable personality, patience and support. Thank you for believing in me from the first day and providing me with the best possible resources. Thank you for bearing with me during my medical leave and understanding my situation. Moreover, thank you for this amazing project. It brought me so much joy and excitement with every single result. This project was such an amazing and successful adventure, which I hope it could make a big change in drinking water treatment industry, helping the environment.
This project would have not been possible without all the wonderful and proficient people involved in it. My special thanks to dear Isabelle Papineau. I learned so much from you. Thank you for guiding me through each step of this project. Thank you for the bright sight you gave me to learn what needs to be done and for providing me with many references and strategies. Thank you for all of that. I can easily describe you as a very kind and caring person with a vast knowledge along creativity. I deeply appreciate your presence in each step of this project. Also, I’d like to thank the whole drinking water lab team, beautiful Julie, Jacinthe, Mireille, Yves, Gabriel and also Jérôme from wastewater lab. Thank you for your support, your knowledge and answering all my questions. You made working in the lab so fun and easy. Thank you for making it as an enjoyable memory for me. Many thanks to my adorable interns, Wendy and Claire for being part of this project and participating in sampling and analysis. Thank you Kim and Evelyn for editing my French abstract (Résumé). I am also thankful to Veronika, for taking over this project during my medical leave and her positivity when I got back to continue my research.
This project gave me the opportunity to meet Professor Pierre Berube and Professor Madjid Mohseni at University of British Columbia. Thank you for your ideas and worthy comments. Working with you and being part of RES’EAU – WaterNet was truly a pleasure. Thank you for all the meetings that carved memorable times.
Also, many thanks to my friends and officemates at Polytechnique, Fatemeh, Milad, Sanaz, Laleh, Kim, Emile, Hadis, Flavia, Hamed and Celso,… . Sincere thanks to my amazing lifetime friends, Mitra, Shima, Parsa, Fardad, Mikail for being by my side. Thank you, Mitra for all your support from the first day I foot step in Montreal. You’re the sweetest person and a true angel. And also. many thanks to all my friends at Concordia University and McGill University for becoming my second family and making life much happier. You are amazing.
The last and not the least, I’d like to thank my parents and my dearest brother, Hooman. Thank you for your support in any possible way, your good thoughts and believing in me in each and every single decision I have ever made. I am so grateful that you are my precious family.
RÉSUMÉ
Enlèvement de la matière organique naturelle (mon) pose un problème pour les utilitaires de la petite eau potable. Échec d’optimiser la suppression du NOM et sa présence dans l’eau affecte le système de l’eau qui provoque la mauvaise qualité esthétique de l’eau avec le compromis de goût et d’odeur. En outre, le problème de santé associé à la présence de NOM dans les résultats de système de distribution de l’eau dans la formation de produits cancérogènes connus comme désinfectant sous-produit (DBP). En outre, le NOM perturbe le processus de traitement de l’eau dans des arrêts comme membrane fouling et une diminution du taux d’oxydation du fer et du manganèse. En ce qui concerne les impacts négatifs précités du NOM, différentes stratégies ont été étudiés et a suggéré de supprimer le NOM des ressources en eau comme la coagulation, membrane, oxydation, adsorption réversible, charbon actif (AC) et l’échange d’ions (IEX). Parmi ces méthodes, IEX est considéré comme un traitement alternatif pour supprimer la couleur, SPD et réduire la demande en chlore car il est robuste et facile à utiliser. Cependant, l’inconvénient de filtration IEX est qu’il nécessite une infrastructure permettant de gérer la production de saumure et disposition pour rétablir la capacité de la résine par la régénération. En outre, les résines anioniques servent un environnement propice à la prolifération de la biomasse en absence de régénération, qu’il prévoit la situation pour IEX d’effectuer en mode biologique (BIEX).
Considérant les avantages et les inconvénients de ces méthodes conventionnelles, l’objectif de cette étude est d’étudier l’impact de la promotion de l’activité biologique sur résines comme un coefficient d’absorption pour le NOM et d’évaluer le rendement de BIEX au pilote. Également, comme la nitrification est un processus biologique, étudient la possibilité d’enlèvement de NH3 par échange d’ions biologique pourrait accroître la valeur de l’étude actuelle.
Dans la présente étude, les performances des filtres BIEX a été suivie en parallèle aux filtres GAC, BAC et IEX pendant 442 jours commençant le 28 février 2017. Les colonnes de flux descendant échelle pilote sont trouvaient à Pont-Viau eau potable traitement plante (DWTP). Les colonnes avec 2 mètres de hauteur ont été remplie à moitié avec les médias et exploité avec un débit de 2 m/h. La source d’eau transportent directement depuis Les Priraies rivière aux filtres fournit une situation réelle dans laquelle il a subi les changements saisonniers et fluctuation de turbidité pendant 442 jours. Ports de prélèvement d’échantillons liquides et solides ont été intégrées à un niveau égal au sein de chaque profondeur de la colonne (5, 15, 30, 50, 60, 90 et 100 cm
correspondant à 0,15, 4.5, 9, 15, 18, 27 et 30 minutes de temps de Contact des lit vide (EBCT)). Pour étroitement et précisément contrôler l’état opérationnel et évaluer les performances des filtres en ce qui concerne la suppression du NOM et de la nitrification, des colonnes effluents et eaux de source ont été échantillonnés par semaine ainsi que de l’échantillonnage des médias au sein de 5 cm de profondeur des médias à surveiller capacité de la résine et l’activité biologique. Afin d’étudier la cinétique de colonnes, les profil échantillonnage a été effectué au sein de la profondeur de médias de colonnes en avril, juillet, novembre et après régénération BIEX en janvier. Après régénération colonne BIEX jour 331, expérience continue à observer la performance BIEX pendant 111 jours (15 mai 2018).
Les résultats ont montré des changements de mode de BIEX tout au long de l’année de IEX mode à fonctionnant en mode épuisement IEX, puis transfert vers un mode biologique à chaud (> 15 ºC) et froid (< 15 °C) température. Pour les 64 premiers jours de fonctionnement, la colonne BIEX gardé DOC sous l’objectif de traitement (≈1.4 mg/L, élimination de DOC de 80 %). BIEX atteint à percée DOC après 92 jours d’opération (15.5ºC) sans régénération qui a conduit à une élimination de DOC ≈76 % plutôt qu’à 80 % par le biais de hebdomadaire régénéré IEX comme un% ≈2 enlèvement de DOC par BAC. Épuisement de la résine toute de la colonne BIEX simultanée à la percée de BIEX DOC indique la fonction BIEX altérant le mode biologique. BIEX gardé d’exploitation pour les prochains jours 240 sans régénération et enlevé ≈51 % DOC en mode biologique comparé à ≈ 8 % de BAC. Après la régénération BIEX sur 23 janvier 2018, le filtre BIEX commence à effectuer tout aussi au filtre IEX en supprimant le NOM puis le même modèle que le début du projet. Correspondant à la suppression de la DOC, BIEX gardé la possibilité de formation de DBP aussi bas que l’objectif de traitement standard pour les deux premiers mois de l’opération. La formation de DBP augmentait avec la percée de la DOC, puis a diminué sous l’objectif de traitement pendant le mode de la biodégradation de BIEX à haute température. Après 50 jours d’opération BIEX, ainsi que l’augmentation de la température de l’eau (> 7ºC) et croissance de biofilm sur des billes de résine, BIEX commence à éliminer l’ammoniac (retrait de ≈43 %). Jour 78 de l’opération (11.3ºC), BIEX enlevé AMMONIAC presque égal au filtre du BAC (72,24 % contre enlèvement 74,90 % respectivement). BIEX atteint la suppression totale du NH3 (100 %) le jour 162 (22.8ºC) par rapport à 98,5 % d’enlèvement par BAC.
capacite d’Echange ionique, optimale retrait de NOM de la même façon pour le filtre IEX (inférieures à 2 mg/L) par la suite et puis a suivi le même schéma d’élimination comme le début du projet. Le filtre BIEX n’a pas obtenu l’enlèvement de l’ammoniac tout de suite après la régénération. Finalement, comme pour le début du projet, BIEX commencé nitrification et atteint impressionnante nitrification (≈ 98%) 109 jours après la régénération BIEX (12.4ºC). Dans l’ensemble, les résultats après 111 jours de régénération BIEX manifestent que le filtre BIEX suivi modèle de performance similaire pour d’autres facteurs aussi bien.
ABSTRACT
Natural organic matter (NOM) removal poses a challenge to small drinking water utilities. Failure to optimize the removal of NOM and its presence in water affects the water system, thereby causing poor aesthetic quality of water with compromised taste and odor. In addition, a health concern associated with the presence of NOM in water distribution systems is the formation of carcinogenic products known as disinfectant by-products (DBPs). Besides, NOM disrupts the process of water treatment in cases such as membrane fouling and a decrease in the oxidation rate of iron and manganese. Considering the aforementioned adverse impacts of NOM, different strategies have been studied and suggested to remove NOM from water resources such as coagulation, membrane filtration, oxidation, reversible adsorption, activated carbon (AC) filtration, and ion exchange (IEX).
Among these methods, IEX is considered an alternative treatment to remove color and DBPs and to reduce the chlorine demand, as it is robust and easy to operate. However, the drawback of IEX filtration is that it requires an infrastructure to manage brine production and disposal to restore resin capacity through regeneration. Furthermore, anionic resins serve as a favorable environment for biomass proliferation in the absence of regeneration, which provides suitable conditions for IEX to perform in the biological mode (BIEX).
Considering the advantages and disadvantages of these conventional methods, the objective of this study is to investigate the impact of promoting biological activity on resins as a removal factor for NOM and to assess the BIEX performance at a pilot scale. Additionally, as nitrification is a biological process, investigating the possibility of NH3 removal by BIEX could enhance the current study’s value.
In the current study, the BIEX filter performance was monitored in parallel to GAC, BAC, and IEX filters for 442 days starting from February 28, 2017. The down-flow pilot-scale columns were located at the Pont-Viau Drinking Water Treatment Plant (DWTP). The columns with 2 m height were half-filled with media and operated at a 2 m/h flow rate. The source water transported directly from the Les Prairies River to the filters provided an actual situation in which it underwent seasonal changes and turbidity fluctuation during the 442 days. Liquid and solid sampling ports were embedded at equal levels within each column depth (5, 15, 30, 50, 60, 90, and 100 cm corresponding to 0.15, 4.5, 9, 15, 18, 27, and 30 min Empty Bed Contact Time (EBCT)). To closely
and precisely control the operational condition and evaluate the performances of the filters for NOM removal and nitrification, the columns’ effluents and source water were sampled weekly along with sampling media within 5 cm depth of the media to monitor resin capacity and biological activity. To study the kinetics of columns, profile sampling was performed within the media depth of the columns in April, July, November, and after BIEX regeneration in January. After regenerating the BIEX column on day 331, the experiment was continued to observe the BIEX performance for 111 days (until May 15, 2018).
The results showed changes in the BIEX mode throughout the year from operating in the IEX mode to the IEX exhaustion mode and then to a biological mode in warm (> 15°C) and cold (< 15°C) temperatures. For the first 64 days of operation, the BIEX column kept the DOC below the treatment objective (≈1.4 mg/L, 80% DOC removal). BIEX reached the DOC breakthrough after 92 days of operation (15.5°C) without regeneration, which led to ≈76% DOC removal rather than ≈80% through weekly regeneration of IEX as well as ≈2% DOC removal through BAC. The complete resin exhaustion of the BIEX column concurrent to the BIEX DOC breakthrough indicates the change in BIEX function to the biological mode. BIEX continued operation for the next 240 days without regeneration and removed ≈51% DOC in the biological mode compared to ≈8% by BAC. After BIEX regeneration on January 23, 2018, the performance of the BIEX filter became equivalent to that of the IEX filter for NOM removal and followed the same pattern as that in the beginning of the project. Further, BIEX reduced the potential of DBP formation and kept it as low as the standard treatment objective for the first two months of operation. The DBP formation increased with DOC breakthrough and then decreased below the treatment objective during the biodegradation mode of BIEX at a high temperature. After 50 days of BIEX operation, along with an increase in water temperature (>7°C) and biofilm growth on the resin beads, BIEX started to remove ammonia (≈43% removal). On day 78 of the operation (11.3°C), BIEX removed ammonia nearly equal to that removed by the BAC filter (72.24% vs. 74.90% removal, respectively). BIEX completely removed NH3 (100%) on day 162 (22.8°C) compared to 98.5% removal by BAC. BIEX was regenerated successfully after 331 days of operation. The BIEX filter recovered the IEX capacity, optimally removing NOM similar to the IEX filter (below 2 mg/L) afterward, and then followed the same removal pattern as that in the start of the project. The BIEX filter failed to achieve ammonia removal right after the regeneration. Eventually, similar to the beginning of the
project, BIEX started nitrification and achieved impressive nitrification (≈98%) 109 days after the BIEX regeneration (12.4°C). Overall, the results after 111 days of BIEX regeneration showed that the BIEX filter followed a similar performance pattern for other factors as well.
TABLE OF CONTENTS
DEDICATION ... III ACKNOWLEDGEMENTS ... IV RÉSUMÉ ... VI ABSTRACT ... IX TABLE OF CONTENTS ... XII LIST OF TABLES ... XVI LIST OF FIGURES ... XVII LIST OF SYMBOLS AND ABBREVIATIONS...………XX LIST OF APPENDICES .………XXIII
CHAPTER 1 INTRODUCTION ... 1
1.1. Bacground ... 1
1.2. Research objectives and hypothesis ... 2
1.3. Structure of thesis ... 5
CHAPTER 2 LITERATURE REVIEW ... 6
2.1. Natural organic matter ... 6
2.1.1. NOM characteristics ... 6
2.1.2. Issues caused by NOM in drinking water ... 10
2.1.3. Processes for NOM removal from drinking water ... 10
2.2. Biological filtration ... 14
2.2.1. History of activated carbon vs. other types of media ... 14
2.2.2. Biological activated carbon mechanism ... 17
2.2.2.1. Natural organic matter removal... 20
2.2.2.1.1.Kinetics ... 21
2.2.2.2. Nitrification ... 22
2.2.2.2.1.Kinetic ... 23
2.3.1. Different types of ion exchange ... 24
2.3.2. Kinetic ... 32
2.3.3. Regeneration ... 34
2.3.4. Limitations of ion exchange ... 35
2.3.5. Biological ion exchange ... 35
CHAPTER 3 METHODOLOGY AND EXPERIMENTAL PLAN ... 37
3.1. Experimental approach ... 37
3.1.1. Location and water matrix ... 38
3.1.2. Pilot plant description ... 39
3.1.3. Analytical methods ... 44
3.1.3.1. Temperature, turbidity and pH ... 44
3.1.3.2. Ion exchange analysis... 44
3.1.3.2.1.Ion exchange capacity: ... 44
3.1.3.2.2.Chloride release: ... 45
3.1.3.3. Biological activity analysis ... 45
3.1.3.3.1.Biodegradable dissolved organic carbon (BDOC) ... 49
3.1.3.3.2.Total biomass using adenosine triphosphate (ATP) ... 49
3.1.3.3.3.Nitrifying bacteria ... 50
3.1.3.4. Organic composition of water ... 51
3.1.3.4.1.Total organic carbon ... 51
3.1.3.4.2. Dissolved organic carbon ... 52
3.1.3.4.3.UVA254/ true colour ... 52
3.1.3.4.4.LC-OCD ... 52 3.1.3.4.5.THM- UFC, HAA-UFC ... 53 3.1.3.4.6.Mass balance... 53 3.1.3.5. Nitrogen analysis ... 53 3.1.3.5.1.Ammonia ... 53 3.1.3.5.2.Nitrites/ Nitrates ... 54 3.1.3.5.3.LC-OND ... 54 CHAPTER 4 ARTICLE 1- LONG-TERM PERFORMANCE OF BIOLOGICAL ION
EXCHANGE FOR THE REMOVAL OF NATURAL ORGANIC MATTER AND AMMONIA
FROM SURFACE WATERS ... 55
4.1. Introduction ... 57
4.2. Materials and methods ... 59
4.2.1. Source water characteristics ... 59
4.2.2. Experimental set-up and operating conditions ... 59
4.2.3. Monitoring filter performance ... 60
4.2.4. Statistical analysis ... 62
4.3. Results ... 62
4.3.1. Evolution of source water temperature ... 62
4.3.2. Natural organic matter removal ... 62
4.3.3. Exhaustion of ion exchange capacity ... 66
4.3.4. Biomass measurement on colonized media ... 69
4.3.5. Nitrification ... 70
4.3.6. Removal of THM and HAA precursors ... 71
4.4. Discussion ... 72
4.5. Conclusion ... 75
CHAPTER 5 SUPPLEMENTARY RESULTS ... 78
5.1. Evolution of source water characteristics during seasonal changes ... 78
5.2. Natural organic matter removal... 80
5.3. Removal of THM and HAA precursors ... 85
5.4. Exhaustion of ion exchange capacity ... 86
5.5. Biomass measurement on colonized media ... 88
5.6. Nitrification ... 88
5.7. Overall BIEX performance: ... 91
CHAPTER 6 GENERAL DISCUSSION ... 93
6.1. Performance of different media for NOM removal (resins vs. activated carbon) and modes of operation ... 93
6.2. Possibility to nitrify on BIEX medium ... 94
6.4. Impact of temperature and turbidity on BIEX performance. ... 94
CHAPTER 7 CONCLUSION AND RECOMMENDATIONS ... 96
BIBLIOGRAPHY ... 98
LIST OF TABLES
Table 1.1: Hypotheses and related experimental approaches ... 4
Table 2.1: NOM fraction and characteristics ... 9
Table 2.2: Alternative processes for NOM removal ... 13
Table 2.3: Evolution of biological filtration ... 16
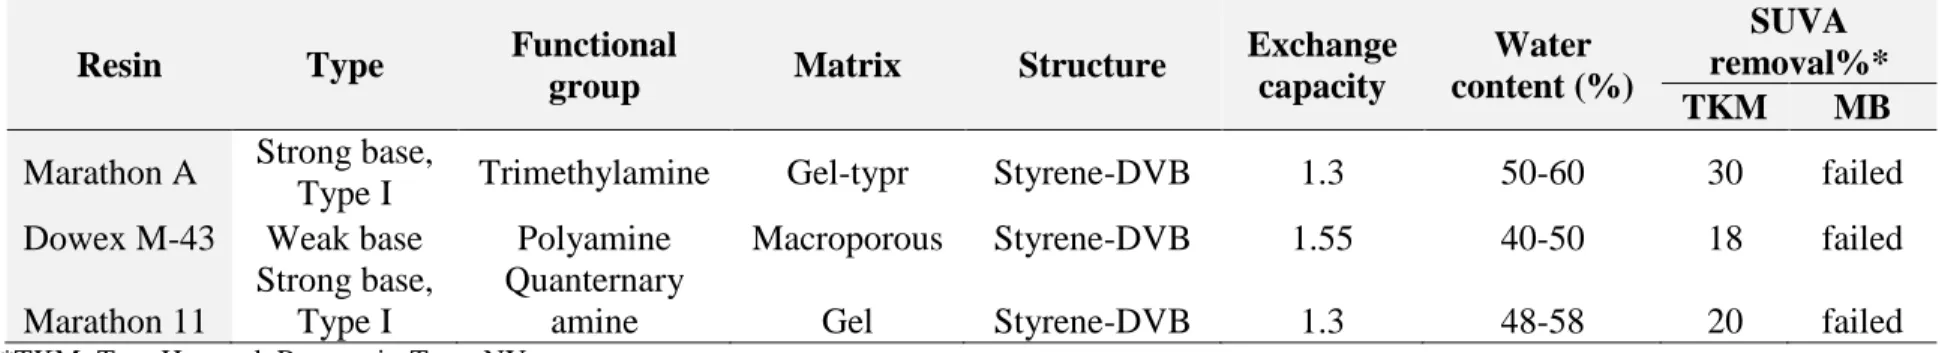
Table 2.4: Anion exchange resins studied by Afcharian et al. (1997) ... 25
Table 2.5: Anion exchange resins studied by Croué et al. (1999) ... 28
Table 2.6: Anion exchange resins studied by Bolto et al. (2002) and Bolto et al. (2004) ... 28
Table 2.7: Anion exchange resins studied by Tan et al. (2005) and Tan, and Kilduff (2007) ... 29
Table 2.8: Anion exchange resins studied by Humbert et al. (2005), Humbert et al. (2008) and Humbert et al. (2005b) ... 30
Table 2.9: Anion exchange resins studied by Cornelissen et al. (2008) ... 30
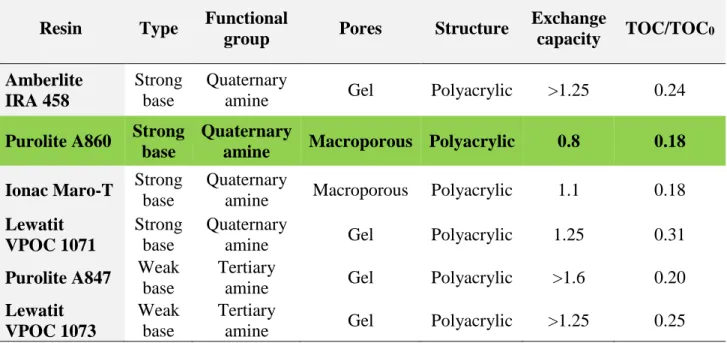
Table 2.10: Anion exchange resins studied by Graf et al. (2014)... 31
Table 2.11: Anion exchange resins studied by Bazri et al. (2016) ... 32
Table 2.12: Regenerant's comparison ... 35
Table 2.13: Removed NOM fraction based on Winter et al. (2016) study ... 36
Table 3.1: Conditions of current study differing from conditions used by Schulz et al. (2017) and Winter et al. (2018) for the study of BIEX ... 37
Table 3.2: Source water characteristics (February 28th, 2017 – May 15th, 2018) ... 38
Table 3.3: Sampling points ... 41
Table 3.4: Pilot design and operation ... 42
Table 3.5: Regeneration conditions for ion exchange ... 43
Table 3.6: Analytical methods ... 46
Table 4.1: Source water characteristics of the Des Prairies River (February 2017 to April 2018). ... 59
Table 4.2: Organic carbon mass balances in the BIEX and IEX filters ... 68
LIST OF FIGURES
Figure 2.1: Concentration profile of a contaminant during bioregeneration ... 19
Figure 2.2: Simulated TOC concentration as a function of EBCT for various k values ... 21
Figure 2.3: Distribution analysis of TOC removal and k constants with and without ozone. The boxes represent 25th, 50th (median) and 75th percentiles, the diamonds represent averages, the error bars represent 5th and 95th percentiles, and the "x" represents outliers (Terry and Summers, 2017) ... 22
Figure 2.4: Mass transfer zone in time ... 33
Figure 3.1: Location of the experimental plan ... 38
Figure 3.2: Schematic of the experimental set-up ... 39
Figure 3.3: (A) Experimental Set-up, (B) Isolated set-up from heat, cold and light, (C) Backwash outlet valves, (D) Effluent and backwash inlet valves, (E) Liquid and solid sampling points. .... 40
Figure 3.4 : TOC online ... 52
Figure 4.1: Pilot-plant schematic consisting of four downflow filtration columns filled with GAC, BAC, BIEX or IEX filter medium. V = 2 m/h. EBCT = 30 min ... 60
Figure 4.2: Weekly dissolved organic carbon (DOC) monitoring in the source water (SW) and GAC, BAC, BIEX and IEX effluents over a period of 390 days of operation. EBCT = 30 min, V = 2 m/h, 48 BV/d. ... 64
Figure 4.3: Weekly UV absorbance at 254 nm (UVA254) monitoring in the source water (SW) and GAC, BAC, BIEX and IEX effluents over a period of 390 days of operation. EBCT = 30 min, V = 2 m/h, 48 BV/d. ... 64
Figure 4.4: Summary of dissolved organic carbon (DOC) concentrations in the source water and the GAC, BAC, BIEX and IEX effluents (n = 36 samples over 338 days, i.e. until the first BIEX regeneration). The groups A, B, C and D were statistically different one from ... 65
Figure 4.5: Estimation of the energies of activation (temperature effect) for the a. IEX, b. BIEX and c. BAC columns. The slope of the regression line is equal to Ea/R (J/mole). For example, Ea for IEX is given by 2430 x 8.31 = 20 193 J/mole = 20.2 kJ/mole. Ea of IEX and BIEX were calculated with data obtained after 100 days of operation. ... 66
Figure 4.6: Monitoring of ion exchange capacity exhaustion (through chloride release) in parallel with DOC breakthrough in the (a) IEX column and (b) BIEX column. BIEX regeneration occurred at t = 331 days = 15,888 BV. ... 67
Figure 4.7: Monitoring of ion exchange capacity exhaustion (through chloride release) in parallel with DOC breakthrough in the (a) IEX column and (b) BIEX column. BIEX regeneration occurred
at t = 331 days = 15,888 BV. ... 68
Figure 4.8 Biomass density (ATP) profiles through depth of the BAC, BIEX and IEX after (a) 7 weeks of operation (T= 10oC) and (b) 19 weeks of operation (T=23oC). (c) Typical effluent turbidity ripening after performing a backwash.: ... 70
Figure 4.9: Ammonia removal with respect to (a) ammonia through time and (b) impact of temperature on ammonia removal. Nitrate and nitrite formation through depth of the BAC, BIEX and IEX columns after (c) 7 weeks of operation and (d) 35 weeks of operation. ... 71
Figure 4.10: THM (a) and HAA (b) precursors concentrations measured under uniform formation conditions (UFC) in source water and in BIEX, IEX, GAC and BAC effluents. Source water temperature: dotted line. EBCT = 30 min. ... 72
Figure S4.11: Impact of EBCT on DOC removal by BAC, BIEX and IEX after (a) 7 weeks of operation, (b) 19 weeks of operation and (c) 35 weeks of operation ... 76
Figure S4.12:THM-UFC in the effluents from the pilot plant (BAC, BIEX, IEX) vs. the full-scale plant (Clarifier effluent, Ozonation, BAC effluent) after 19 weeks of operation (July 2017). .... 76
Figure 4.13: Chloride release by BAC, BIEX and IEX as a function of EBCT after (a) 7 weeks or (b) 35 weeks of operation. ... 77
Figure S4.14.14: Resin morphology for (a) Unused IEX, (b) IEX used for one year, (c) BIEX used for 331 days before regeneration, and (d) BIEX used for 331 days after regeneration. ... 77
Figure 5.1: Water temperature profiles during the study (oC) ... 78
Figure 5.2: Turbidity ... 79
Figure 5.3: Acidity (pH) in source water and filtered effluents ... 79
Figure 5.4: DOC removal and turbidity during the pilot study... 80
Figure 5.5: DOC removal and temperature... 81
Figure 5.6: [DOC] distribution during 442 days of operation ... 81
Figure 5.7: BIEX functional mode ... 82
Figure 5.8: [DOC] distribution of BIEX filtered waters during functional modes of operation .. 83
Figure 5.9: Impact of EBCT on DOC removal after, (a) 7 weeks of operation, (b) 19 weeks of operation, (c) 35 weeks of operation, (d) 48 weeks of operation ... 84 Figure 5.10: Liquid chromatography with organic carbon detection (LC-OCD) for (a) GAC, (b)
BAC, (c) BIEX and (d) IEX in March, April, July, 2017 - Source water: The average of three
source water measurements in March, April and July ... 85
Figure 5.11: THM-UFC concentration of source water and filter effluents ... 86
Figure 5.12: HAA-UFC concentration of source water and filter effluents ... 86
Figure 5.13: Evidence of resin exhaustion in parallel to chloride release ... 87
Figure 5.14: Impact of EBCT on chloride release after, (a) 7 weeks of operation, (b) 35 weeks of operation, (c) 48 weeks of operation... 88
Figure 5.15: Biomass assessment through ATP ... 88
Figure 5.16: Ammonia concentration through time with respect to source water temperature .... 89
Figure 5.17: Impact of EBCT on nitrate and nitrite removal after, (a) 7 weeks of operation, .... 90
Figure 5.18: Liquid chromatography with organic nitrogen detection (LC-OCD) for (a) GAC, (b) BAC, (c) BIEX and (d) IEX in March, April, July, 2017 – Source water: The average of three source water measurements in March, April and July ... 91
Figure 5.19: BIEX performance: Ammonia removal versus DOC removal ... 92
Figure A.1: Weekly effluent flowrate of columns ... 110
Figure A.2: Controlling pressure drop, starting 90 days after operation ... 110
Figure A.3: Dissolved O2 [mg/L]... 111
Figure A.4: UV absorbance at 254 nm through time ... 111
Figure A.5: Colour concentration for 140 days of operation ... 111
Figure A.6: Impact of EBCT on BDOC removal after, (a) 7 weeks of operation, (b) 19 weeks of operation, (c) 35 weeks of operation... 112
Figure A.7: Cl2 demand prior to assessing THM-UFC and HAA-UFC concentration ... 112
Figure A.8: Impact of EBCT, (a) on sulfate removal after 35 weeks of operation, (b) on sulfate removal after 48 weeks of operation, (c) on alkalinity removal after 35 weeks of operation .... 112
Figure A.9: Impact of column depth on presence of ATP after, (a) 7 weeks of operation, (b) 19 weeks of operation, (c) 48 weeks of operation ... 113
Figure A.10: Impact of EBCT on NH3 removal after, (a) 7 weeks of operation, (b) 19 weeks of operation, (c) 48 weeks of operation... 113
LIST OF SYMBOLS AND ABBREVIATIONS
AC Activated carbon
AE Activation energy
AEC Anion exchange capacity
AOB Ammonia-oxidizing bacteria
AOP Advanced oxidation process
ATP Adenosine triphosphate
BAC Biological activated carbon
BDOC Biodegradable dissolved organic carbon
BIEX Biological ion exchange
BOM Biodegradable organic matter
BV Bed volume
CDWQG Canadian drinking water guideline CFR Co-flow regeneration
DO Dissolved oxygen
DOC Dissolved organic carbon
DWTP Drinking water treatment plant
EBCT Empty ced contact time
EDTA Athylenediaminetetraacetic acid
EPS Axtracellular polymeric substance
ES Effective size
FA Fulvic acid
GAC Granular activated carbon
HA Humic acid
HAA Haloacetic acid
HIA Hydrophilic acid
HIB Hydrophilic base
HIN Hydrophilic neutral
HMM High molar mass
HMW High-molecular-weight
HOB Hydrophobic base
HON Hydrophobic neutral
HPC Heterotrophic plate count
HPLC High-performance liquid chromatography
IC Ion chromatography
IEX/ IX Ion exchange
IMM Intermediate molar mass
LC-OCD Liquid chromatography - organic carbon detection LC-OND Liquid chromatography of organic nitrogen detection LMM Low molar mass
LMW Low-molecular-weight
MF Microfiltration
MIEX Magnetic ion exchange
MTZ Mass transfer zone
NBDOC Non-biodegradable compounds
NF Nanofiltration
NOM Natural organic matter
NTU Nephelometric turbidity unit
PAU Potential acetate uptake
PGR Potential glucose respiration
PZG Plane of zero gradient
RFR Reverse-flow regeneration
RO Reverse osmosis
SSF Slow sand filtration
SUVA Specific ultra-violet absorbance
THM Trihalomethane
TOC Total organic carbon
UF Ultrafiltration
UFC Uniform formation condition
US EPA United states environmental protection agency UVA Ultra-violet absorbance
WHO World health organization
LIST OF APPENDICES
CHAPTER 1 INTRODUCTION
1.1. Background
Natural organic matter (NOM) refers to a series of chemical compounds originating from animals, plants, and microorganisms after they are transformed into particulate and dissolved organic carbon (Aiken and Cotsaris, 1995; Hong and Elimelech, 1997). NOM is present in most drinking water resources as proteins, polysaccharides, humic acids, fulvic acids, and amino acids. The NOM present in water may be from internal sources (autochthonous) or external sources (allochthonous). Allochthonous NOM arises from the transfer of land-based NOM to water by rainfall or drainage (Aiken and Cotsaris, 1995; Hong and Elimelech, 1997) while allocthonous NOM is produced in the aquatic environment (e.g., by algae growth). Depending on the characteristics of the watershed and seasonal changes, the concentrations and characteristics of NOM from external and internal sources vary.
In addition to the aesthetic issues and disruptions in water treatment and distribution caused by the presence of NOM in water, NOM reacts with the chlorine added to water in the final disinfection step. This reaction produces chemical compounds known as disinfectant byproducts (DBP), which have potential adverse impacts on human health (Kleiser and Frimmel, 2000; Singer, 2006) (Xie, 2003). NOM is not regulated by Canadian drinking water guidelines (CDWQG), the United States Environmental Protection Agency (US EPA), or the World Health Organization (WHO). Because of health concerns arising from DBP formation, NOM concentration reduction has been suggested before chlorination. In Canada, the objective is to limit trihalomethane (THM) and haloacetic acid (HAA) concentrations to <100 µg/L and <80 µg/L, respectively. The Quebec Drinking Water Quality Standards stipulate even lower limits of 80 µg/L and 60 µg/L, respectively, as measured using a running average of trimestral worst-case samples collected from a distribution system. WHO guidelines regulate THM contents using separate values for chloroform (0.3 mg/L), bromoform (0.1 mg/L), dibromochloromethane (0.1 mg/L), and bromodichloromethane (0.06 mg/L).
To avoid exceeding DBP regulations, NOM is typically removed from drinking water via methods including coagulation, membrane filtering, oxidation processes, activated carbon (AC) adsorption,
or ion exchange (IEX), among which IEX has a particularly good cost performance metric. The IEX process is defined based on the exchange of ions between resin beads and contaminants. Among varying types of resin, anion exchange using negatively charged compounds can remove NOM. Upon successive investigations of resins for NOM removal, macroporous strong-base polyacrylic-structured Purolite A860™ resin demonstrated the best total organic carbon (TOC) removal of 93% and highest regeneration efficiency compared to other alternatives (Bazri, 2016; Bazri et al., 2016). However, the necessity of frequent regeneration complicates this method because of the required disposal of spent brine, which negatively impacts the environment. IEX resins are typically regenerated every two to three days. Earlier work from our group in RES’EAU WaterNet has shown that operating IEX filters without regeneration allowed maintenance of long-term (one-year) NOM removal. The study reported herein was conducted at the laboratory scale with 0.45-µm pre-filtered surface water (Schulz et al., 2017; Winter et al., 2018). To further investigate this mode of operation on natural surface water, four columns including granular activated carbon (GAC), biological activated carbon (BAC), IEX, and biological IEX (BIEX) filters were set up in parallel and operated for a period of >1 year at the Pont-Viau water treatment plant (WTP). These four filters were fed directly with Des Prairies River water without pretreatment. Routine influent/effluent water quality assessments and solid media characterizations were performed to gain a better understanding of the differences of the filter media (BAC vs. resin) and operation modes (with and without regeneration) on the process performance. This thesis reports the results of this investigation, which confirmed that the BIEX mode of operation offers significant advantages over the traditional mode of operation of IEX while also providing significantly better performance than BAC and GAC filtering.
1.2. Research objectives and hypothesis
The idea of IEX in the biological mode was introduced at the University of British Columbia (Winter et al., 2016). They studied the performance of BIEX in comparison to IEX (Purolite A860) using 0.45-µm pre-filtered water, diluted with tap water to a constant dissolved organic carbon (DOC) concentration of 5 mg/L. They operated their lab-scale systems for two continuous months at room temperature (22°C), with the columns backwashed and regenerated monthly via three methods of regeneration (see section 2.3.5). Unlike previous studies, this experiment used natural surface water and thus considered natural changes in the water resource characteristics and
seasonal temperature changes.
The general objective of the current project was to confirm the viability of BIEX filter operation for NOM removal in direct feeding by colored and turbid surface water. A BIEX column was therefore operated for more than one year in parallel to an IEX column (regenerated weekly), as well as GAC and BAC columns. The specific objectives were:
1. Compare different media for NOM removal (resins vs. AC) 2. Assess operation modes in BIEX media
3. Test potential nitrification on BIEX media
4. Confirm the feasibility of regenerating BIEX media after long-term operation 5. Evaluate the effects of temperature and turbidity on BIEX performance 6. Measure biofilm colonization on the various media
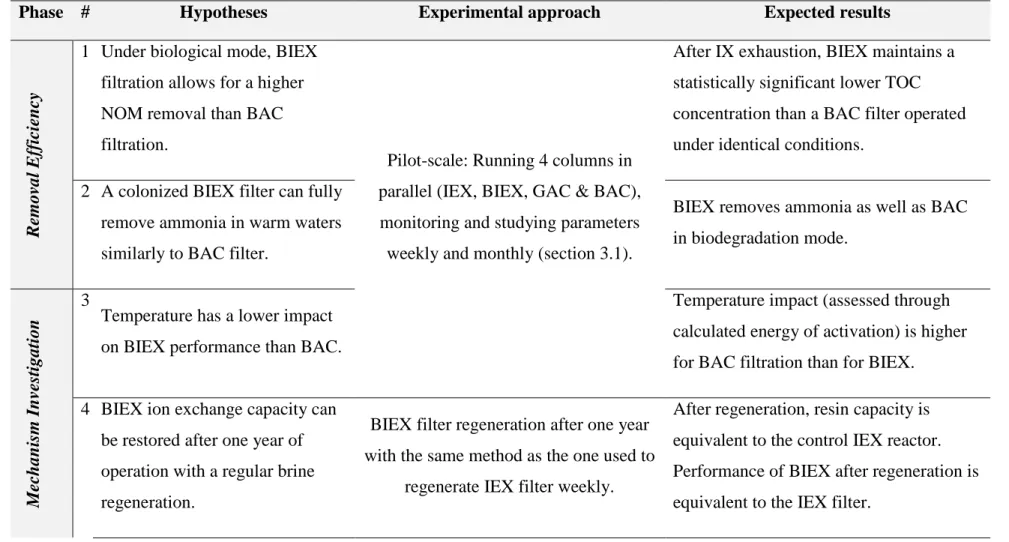
Table 1.1 summarizes the various research hypothesis evaluated in this project, as well as the experimental approaches used to test them.
Table 1.1: Hypotheses and related experimental approaches
Phase # Hypotheses Experimental approach Expected results
R
emoval Eff
icie
n
cy
1 Under biological mode, BIEX filtration allows for a higher NOM removal than BAC filtration.
Pilot-scale: Running 4 columns in parallel (IEX, BIEX, GAC & BAC), monitoring and studying parameters weekly and monthly (section 3.1).
After IX exhaustion, BIEX maintains a statistically significant lower TOC concentration than a BAC filter operated under identical conditions.
2 A colonized BIEX filter can fully remove ammonia in warm waters similarly to BAC filter.
BIEX removes ammonia as well as BAC in biodegradation mode. Me ch an ism In ve sti gati o n 3
Temperature has a lower impact on BIEX performance than BAC.
Temperature impact (assessed through calculated energy of activation) is higher for BAC filtration than for BIEX.
4 BIEX ion exchange capacity can be restored after one year of operation with a regular brine regeneration.
BIEX filter regeneration after one year with the same method as the one used to
regenerate IEX filter weekly.
After regeneration, resin capacity is equivalent to the control IEX reactor. Performance of BIEX after regeneration is equivalent to the IEX filter.
1.3. Structure of thesis
This thesis is divided into six chapters as follows:
- Chapter 1: An overview on the background of the current study and its research objectives/hypothesis;
- Chapter 2: A literature review on NOM characteristics and concerns, information on conventional NOM removal methods, and discussion of removal mechanisms;
- Chapter 3: The experimental plan and detailed methodology;
- Chapter 4: An article published in the Journal of Water Research, titled “Long-Term Performance of Biological Ion Exchange for the Removal of Ammonia and Natural Organic Matter from Surface Waters before regeneration;”
- Chapter 5: The results for the remaining parameters, before and after regeneration of BIEX; - Chapter 6: General conclusions and recommendations for future studies.
CHAPTER 2 LITERATURE REVIEW
2.1. Natural organic matter
NOM is primarily composed of carbon (~50%), oxygen (~40%), and hydrogen (~4%), with minor heteroatom constituents (~2%) including nitrogen, sulfur, and phosphorus (Hertkorn et al., 2008). It originates from plants, animals, and microorganisms, which are biodegraded and altered into particulate organic carbon and DOC (Aiken and Cotsaris, 1995; Hong and Elimelech, 1997). NOM is present in almost all drinking water resources at various concentrations depending on the source of NOM (Matilainen and Sillanpaa, 2010; Pelekani and Snoeyink, 1999).
2.1.1. NOM characteristics
NOM characteristics depend on its origin, which is usually the degradation of plants, animals, and microorganisms (Pelekani and Snoeyink, 1999). NOM sources are typically classified as allochthonous or autochthonous. Allochthonous organic compounds are decayed vegetation transported from the watershed to the water body, streams, or groundwater flow via rainfall or drainage (Aiken and Cotsaris, 1995). Allochthonous compounds are higher in carbon content than autochthonous compounds, so allochthonous NOM is more prevalent in water sources with higher TOC (Ruttner, 1963). The quantities of externally and internally sourced NOM depend on the watershed characteristics of a water body. Allochthonous NOM is typically found in lakes with large volumes of water flowing through them, like river lakes and mountain lakes (Ruttner, 1963). Drainage from areas with trapped decaying vegetation, such as bogs and swamps, provides significant humic substances. These humic substances can either be released directly into a water body as dissolved NOM or be transported as particles (Kornegay et al., 2000). Meanwhile, autochthonous compounds are usually found in rivers with low surface runoff influx (Ruttner, 1963). Drainage from soils rich in mineralized compounds contains small amounts of carbon, which indicate high quantities of autochthonous organic matter (Kornegay et al., 2000). In addition, because the occurrence of autochthonous compounds is due to the activity of algae, bacteria, and macrophytes (photosynthetic activity) (Ruttner, 1963), the presence of waterborne nutrients (nitrogen and phosphorous) and the water temperature are important in the formation of autochthonous organic matter (Kornegay et al., 2000).
both aquatic humic and non-humic substances. About 50% of DOC consists of aquatic humic substances (40% fulvic acid (FA) and 10% humic acid (HA)), while the remaining 50% consists of non-humic substances, such as 30% hydrophilic acid, 10% carbohydrates, <8% carboxylic acids, <3% amino acids, and <1% hydrocarbons.
Humic substances have higher molecular weights than non-humic substances (Edzwald, 2011). Among humic substances, humic acids have molecular weights two to ten times higher than fulvic acids; they also have higher aromatic contents, inducing lower solubility relative to fulvic acids (Vik and Eikebrokk, 1989). Because of the lower molecular weights of non-humic substances, their formation processes, and sources, non-humic substances are considered the major biodegradable fraction of NOM (Kornegay et al., 2000). Various studies on the biodegradability of humic substances indicate that they are the sole carbon source for biofilm growth in distribution systems. Other studies have indicated poor biodegradability of humic substances in experimental conditions (Prévost et al., 2005).
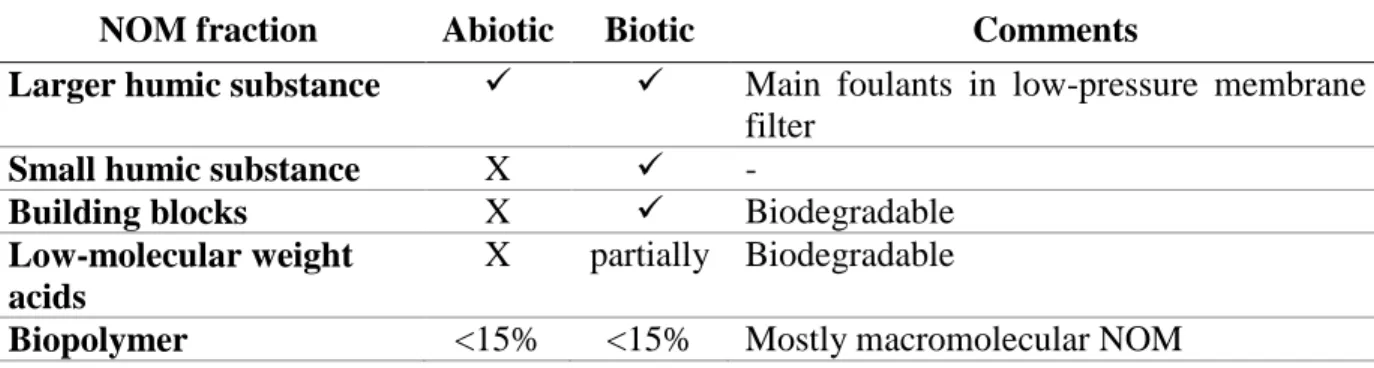
NOM can also be categorized based on its hydrophobicity, which is correlated with the aromatic structures of the fractions of hydrophobic acids (HOA), hydrophobic bases (HOB), hydrophobic neutrals (HON), hydrophilic acids (HIA), hydrophilic bases (HIB), and hydrophilic neutrals (HIN) (Table 2.1).
Table 2.1: NOM fraction and characteristics
NOM Structure MW (Da)1 Hydrophobicity Biodegradibility2 Details
Non -h u m ic Su b stance s
Tannins Aromatic 500-3000 Weak hydrophobic
acid
Biodegradable Originated from decaying vegetation and leaves
negatively charge at neutral pH
Phenols Aromatic N/A Weak hydrophobic
acid
Biodegradable Negatively charge at neutral pH
Hydrocarbons Aliphatic 100-70,000 Hydrophobic neutral Biodegradable Typically negligible in most
waters
Sugars Aliphatic N/A Hydrophilic acid Biodegradable Originated from structural
components of microorganisms cell wall3
Polysaccharides Aliphatic 120-900 Hydrophilic neutral Biodegradable Originated from algal
by-products,
Microorganisms constituents 4
Proteins Aliphatic 250-850 Hydrophobic base Biodegradable N/A
1 (CBCL-Limited., 2011)
2(Kornegay et al., 2000; Prévost et al., 2005)
3 (Biber et al., 1996) 4 (Edzwald, 2011)
Table 2.1: NOM fraction and characteristics (continued)
NOM Structure MW (Da)1 Hydrophobicity Biodegradibility2 Details
Non -h u m ic Su b stance s
Amino Acids Aromatic/
aliphatic 75-205 Hydrophilic base
Readily
biodegradable N/A
Fatty Acids Aliphatic 250-850
Hydrophilic polar head group/ Hydophobic alphitic tail Biodegradable N/A Aqu atic Hu m ic Su b stan ce s Humic Acids HAs are more aromatic than FAs 1000s Hydrophobic Acid# Difficulty to
biodegrade Negative form at pH range of natural waters Fulvic Acids Several 100s Hydrophobic Acid# 1 (CBCL-Limited., 2011)
2.1.2. Issues caused by NOM in drinking water
Failure to an optimized NOM removal and its presence in water affects water systems in two manners: deteriorating the drinking water quality and disrupting water treatment processes, with the following possible results:
Poor aesthetic quality of the water;
Issues with taste and odors (Christman and Ghassemi, 1966);
Disinfectant By-Product (DBP) formation (Kleiser and Frimmel, 2000; Xie, 2003);
Bacterial regrowth and biofilm formation in the water distribution system (Vanderkooij, 1992);
Adverse effects on the adsorption capacity and oxidation kinetics of micropollutants (Smith and Weber, 1985);
Potential membrane fouling (Amy and Cho, 1999; Nilson and DiGiano, 1996; Schäfer et al., 2000);
Negative impact on ultraviolet (UV) light-based advanced oxidation processes (AOPs) (Sarathy et al., 2011);
Reduced oxidation of iron and manganese (Graveland and Heertjes, 1975).
Because of the negative impacts of NOM in water, NOM elimination is an important goal in drinking water treatment. Different methods have been studied and suggested for NOM removal, as reviewed in the next section (section 0).
2.1.3. Processes for NOM removal from drinking water
Many methods of NOM removal have been studied. Because of the variability of NOM fractions and specific characteristics, most methods can only achieve partial NOM removal (Table 2.2). Listed below are brief descriptions of the most common methods applied for NOM removal in water treatment:
Coagulation:
Coagulation involves the addition of chemicals to destabilize colloids and promote their adherence to each other (Davis and Cornwell, 2013). These hydrolyzing chemicals are usually aluminum salts, iron salts, or organic quaternary amine-based polymers. NOM removal by coagulation
depends on factors including the coagulant type, coagulant dose, NOM characteristics, temperature, pH, and other available ions in the water (Matilainen and Sillanpaa, 2010; Matilainen et al., 2010).
Membrane filtration:
Membrane filtration is a modern water treatment technology based on steric, diffusion, or charge separation mechanisms. The four available membrane types are microfiltration (MF), ultrafiltration (UF), nanofiltration (NF), and reverse osmosis (RO). Among different membrane types, NF and RO filters can remove NOM (Davis and Cornwell, 2013). However, UF and MF can be used to remove the flocs induced by coagulation agents.
Oxidation processes:
The mechanism of oxidation processing relies on electron transfer from an electron donor to an electron acceptor. Oxidation processes in water treatment for NOM removal include conventional methods, combinations with biological filters, and advanced oxidation processes (AOP). Conventional oxidation, using oxidants such as chlorine, is selective, while AOP converts almost any type of waterborne organic compound, including synthetic organic compounds, to carbon dioxide (Crittenden et al., 2012; Matilainen and Sillanpaa, 2010). Oxidation processes generate oxidation byproducts. The control of oxidations processes in source waters with variable characteristics can be complex.
Activated carbon:
AC, derived by carbonizing natural substances such as wood and coal, is used to remove organic and inorganic matter from water (CBCL-Limited., 2011). It works by an adsorption mechanism. After a few months of operation, AC begins working in a biological mode. This biological activity increases the removal of the biodegradable fraction of NOM (Zearley and Summers, 2012). This method is further discussed in section 2.2.
Ion exchange:
The IEX mechanism consists of the exchange of one ion with another; it is convenient for the removal of charged particles in NOM (CBCL-Limited., 2011; Matilainen, 2007). It is commonly
used in small systems because of its simple operation. Because 60–90% of NOM is charged (Fettig, 1999), the removal rate performance of this process can be high. The main drawback of IEX is the need to regenerate the media every 48–72 h with 80–120 g/L sodium chloride or other regenerants, as described in section 2.3.3; this procedure generates brine waste that may be difficult to dispose because many environmental legislations restrict the release of chlorides to the environment. This method is further discussed in section 2.3.
Table 2.2: Alternative processes for NOM removal
Method NOM fraction
removed+ Effectiveness + Drawbacks Reference Coagulation Hydrophobic, mostly HMW Moderate: HMM: 94% IMM: 12-55% LMM: 3-14%
Depending on the coagulant: High alkalinity consumption;
Large footprint related to next treatment processes and production of sludge;
Energy intensive. (CBCL-Limited., 2011) Membrane (NF & RO) Depends on the membrane molecular weight cut-off High: HMM: 100% IMM: 52-100% Membrane fouling; Complexity of process; Energy and water intensive; Expensive; Pre-treatment is required. (Matilainen, 2007) (Vickers et al., 1995) Oxidation Processes Hydrophobic, mostly LMW Moderate: Expensive; Complexity;
Post-filtration is required to remove transformed NOM, otherwise it would lead to DBP formation.
(CBCL-Limited., 2011) Activated Carbon Variable Moderate: HMM: 0% IMM: 30% LMM: Slightly
Fast exhaustion (=expensive);
Inefficient NOM removal (variable for various NOM fractions);
Variable adsorptive capacity from one GAC to another;
Dependency of adsorptive Nom capacity to other parameter. (McCreary and Snoeyink, 1980) (CBCL-Limited., 2011) Ion Exchange
Variable High Brine disposal
2.2. Biological filtration
2.2.1. History of activated carbon vs. other types of media
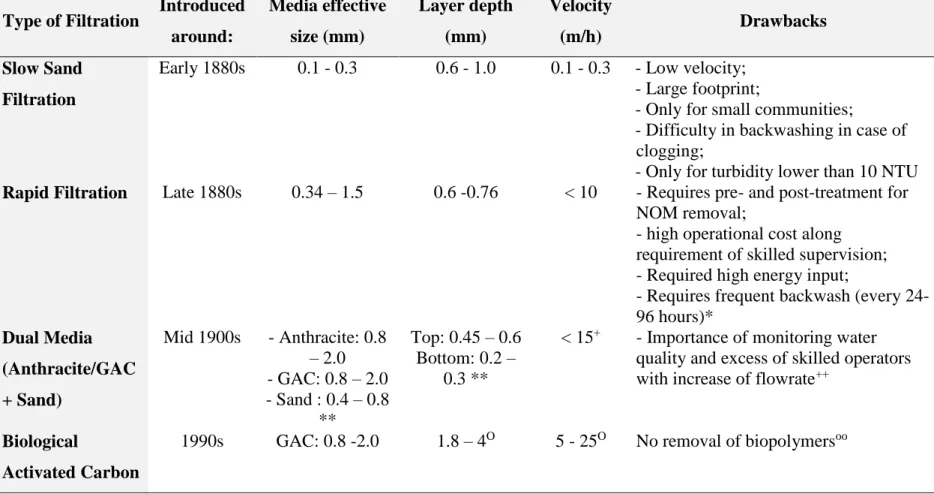
Filtration is a common process used in most water treatment plants to remove particles, sediments, algae, and various organic and inorganic substances. Particularly for the removal of microorganisms from surface water, filtration is considered important in tandem with chemical disinfection. For this purpose, different types of biological filtration have been practiced, evolving from slow sand filtration (SSF) to BAC (Table 2.3).
The concept of SSF was first proposed in the early 1800s for small communities in Europe. In studies on SSF performance, DOC removal reaching 31% (Collins et al., 1992), AOC removal reaching 40%, and biodegradable organic compound (BDOC) removal reaching 75% have been observed, depending on the temperature and source of the water (Lambert and Graham, 1995). The mechanism of high-molecular-weight (HMW) compound removal by this method is based on adsorption, while for low-molecular-weight (LMW) fractions, adsorption and biodegradation are correlated (de Haan, 1977; Schneider et al., 1984). The performance of SSF is mostly impacted by the biological layer (Schmutzdecke) formed on the top 5 cm of the sand bed. Biodegradation is observed in this layer, as well as ionic reduction (Campos et al., 2002). Regardless of the efficacy of NOM removal by SSF, the slow flow rate of 0.1–0.3 m/h (Campos et al., 2002) limits the applicability of this method for small communities, as it requires a large footprint. In addition, once the Schmutzdecke layer is clogged by particles, it must be physically removed, which introduces a long ripening period necessary to re-establish the biological layer (Davis and Cornwell, 2013).
The need for faster filtration inspired the introduction of rapid filtration, with a flowrate 10 to 50 times higher than that in SSF. The uniformity of the filtering medium with the effective size of 0.34–1.5 mm (Benham and Ross, 2009) in rapid filtration allows the optimization of water passage through the filter (Davis and Cornwell, 2013). Therefore, water can be filtered by the entire bed depth, which reduces the probability of clogging as observed in SSF (Edzwald, 2011). The efficiency of rapid filtration depends on the initial turbidity of water, filter bed configuration, filtration velocity, and filtration run.
To obtain better performance throughout the bed depth, the application of rapid filtration via two media (dual media) was suggested in which the top medium comprises larger particles while the lower medium comprises smaller particles. This arrangement reduces the phenomenon of clogging (Davis and Cornwell, 2013). The top medium is usually a 0.45–0.60-m-thick layer of anthracite or GAC over 0.2–0.3 m of sand (Edzwald, 2011).
The evolution in water treatment practices in the 1980s demonstrated that the adsorption mechanism of GAC filters was progressively converted into biodegradation over long-term operation. GAC provides an environment for heterotrophic bacteria to grow on the media and degrade both organic compounds and micropollutants. All previously mentioned media can potentially establish such conditions for bacteria and biofilm formation, but the irregular shape of GAC facilitates the attachment of bacteria to the surface, especially in cold water conditions (Prévost et al., 2005).
Table 2.3: Evolution of biological filtration
Type of Filtration Introduced
around: Media effective size (mm) Layer depth (mm) Velocity (m/h) Drawbacks Slow Sand Filtration
Early 1880s 0.1 - 0.3 0.6 - 1.0 0.1 - 0.3 - Low velocity; - Large footprint;
- Only for small communities;
- Difficulty in backwashing in case of clogging;
- Only for turbidity lower than 10 NTU
Rapid Filtration Late 1880s 0.34 – 1.5 0.6 -0.76 < 10 - Requires pre- and post-treatment for
NOM removal;
- high operational cost along requirement of skilled supervision; - Required high energy input;
- Requires frequent backwash (every 24-96 hours)* Dual Media (Anthracite/GAC + Sand) Mid 1900s - Anthracite: 0.8 – 2.0 - GAC: 0.8 – 2.0 - Sand : 0.4 – 0.8 ** Top: 0.45 – 0.6 Bottom: 0.2 – 0.3 **
< 15+ - Importance of monitoring water quality and excess of skilled operators with increase of flowrate++
Biological
Activated Carbon
1990s GAC: 0.8 -2.0 1.8 – 4O 5 - 25O No removal of biopolymersoo
* (Bruni, 2012) **(Edzwald, 2011)
+ (Davis and Cornwell, 2013) ++(Engelhardt, 2012) O(Çeçen and Aktas, 2012)
2.2.2. Biological activated carbon mechanism
BAC filters operate via the two simultaneous removal mechanisms of adsorption and biodegradation. Early in the formation of biofilms on AC, biological activity is limited and the reaction mechanism is simple adsorption via GAC. In this phase, biodegradation is negligible and the removal of organic and inorganic substances is mainly accomplished by adsorption. Later in operation, the adsorption capacity of the GAC is exhausted and biological activity becomes dominant in the removal of contaminants. In this phase, the GAC reactor has changed to the biological mode of operation, typically referred to as BAC (or BGAC).
Adsorption:
Adsorption on AC is defined as the accumulation of substances from the liquid phase on the solid after traversing the interfacial boundary layer (Walter et al., 1972). Adsorption is achieved by two driving forces: the hydrophobicity of the solute and the electrical affinity of the solute for the solid (physisorption and chemisorption). Hydrophilic substances preferentially remain dissolved in solution in the water system, while hydrophobic substances generally become attached to solids (Çeçen and Aktas, 2012). Physisorption arises from weak van der Waals interactions, instead of electron exchange, driving the adsorptive attachment of a substance to a solid surface. The formation of multiple layers is expected in this type of adsorption. At temperatures below 150°C, physisorption is a significant mechanism of adsorption. At lower temperatures and in reversible processes, adsorbates are not strongly attached to the solid surface; in such conditions, physisorption is mostly associated with lower binding energies (Çeçen and Aktas, 2012; Inglezakis and Poulopoulos, 2006). Unlike physisorption, chemisorption occurs by a chemical reaction between the adsorbate and adsorbent; chemical bond formation occurs after electron exchange between the solid surface and the adsorbate. Chemisorption is generally associated with higher binding energies and is more prevalent at higher temperatures, where only monolayer molecular sorption is anticipated (Inglezakis and Poulopoulos, 2006; Walter et al., 1972).
Adsorption is influenced by various factors including the specific surface area and porosity of the AC, solute characteristics, pH, and temperature.
surface for adsorption (Çeçen and Aktas, 2012).
Porosity of AC: The number of pores, their physical characteristics, and their
distribution influence adsorption. Pores with different sizes affect adsorption in specific manners. Macropores with large widths exhibit the same adsorption mechanism as flat surfaces, while that on mesopores is mainly based on the capillary adsorbate concentration. Meanwhile, all substances of sizes smaller than the pore diameters can be adsorbed on micropores (Dabrowski, 2001).
Solute characteristics: Different properties of the solute impact the adsorption.
LMW compounds are more soluble than HMW ones; therefore, HMW compounds are more prone to adsorption by AC. Polarity also affects adsorption; for AC, nonpolar substances are simply adsorbed. The structure and atomic arrangement of the solute affect the adsorption level as well. Longer molecular chains experience greater adsorption, and aromatic compounds are more easily adsorbed than aliphatic compounds.
pH: pH varies depending on two factors: the charges of ions released from organic
matter and the acidity of AC. Acidity arises from the functional groups of AC, which are easily released upon exposure to distilled water. In different pH environments, organic molecules possess different charges. Neutral pH typically presents peak NOM adsorption (Karanfil et al., 1999).
Temperature: Liquid adsorption on solid surfaces is affected by temperature. As
the temperature is decreased, the adsorption capacity increases, because of the thermodynamics of adsorption reactions (exothermic). Meanwhile, increases in temperature accompany faster solute diffusion into the pores of AC, which may induce faster kinetics (Hassler, 1963).
Bioregeneration:
After a few months of operation, GAC displays another removal mechanism called bioregeneration. Microorganisms have a significant role in bioregeneration, as they revive the adsorptive capacity of the carbon and thus permit further adsorption by AC (Çeçen and Aktas, 2012). Biofilm growth affects the GAC mechanism in the following ways:
Removal of (slowly) biodegradable substances and non-adsorbable compounds, Under shocking loads of toxic organic pollutants, only the outer layer of the
biofilm is affected while the inner layer remains active,
As the bulk liquid concentration decreases, desorption from carbon particles occurs into the surrounding biofilm or the bulk liquid; desorbed materials may then be biodegraded.
The substrate within the biofilm moves to carbon until the carbon is saturated, providing sufficient time for slowly biodegradable substances to be biodegraded,
Transition of GAC reactor to BAC reactor through time (Çeçen and Aktas, 2012). Different theories for bioregeneration mechanism have been suggested:
Bioregeneration by concentration gradient:
According to this mechanism, biodegradation occurs based on the concentration gradient of organic matter desorbed from the AC surface to the bulk liquid (deJonge et al., 1996; Kim et al., 1997). This can be defined more specifically by the hypothetical line in a biofilm layer called the plane of zero gradient (PZG). This line separates the zone of substances biodegrading in the bulk liquid from the zone of biodegraded substances adsorbed on the AC surface. By the degradation of substances in the bulk liquid and thus the decrease of their concentration, the equilibrium is impaired, driving substrate desorption from the AC and thus inducing AC bioregeneration, which drives the PZG toward bulk liquid (Figure 2.1). Adverse movement of PZG occurs if the concentration increases in the bulk liquid. In this situation, bioregeneration does not happen (Çeçen and Aktas, 2012).
Figure 2.1: Concentration profile of a contaminant during bioregeneration
Bioregeneration by exoenzymes:
According to this theory, bioregeneration occurs by the diffusion of extracellular enzymes excreted by microorganisms into the AC pores and their reaction with adsorbed substances (Kim et al.,
1997; Sirotkin et al., 2001). Different studies have proven the dependency of this mechanism on various factors. Based on these investigations, the adsorption and desorption of extracellular enzymes are prerequisites of bioregeneration Regarding the molecular size of the enzymes, they can only be adsorbed to pores of >10 nm, including macropores and some mesopores. For micropore-adsorbed LMW substances, enzyme adsorption into AC pores is impossible (Martin et al., 2002). In addition, the enzyme penetration of the carbon pores is reduced because of the limited pore size (Klimenko et al., 2002). This mechanism is considered a very slow process because of the slow diffusion of large enzymes into pores. The involvement of exoenzymes in the bioregeneration mechanism requires further investigation (Aktas and Cecen, 2007).
2.2.2.1.Natural organic matter removal
The mechanism for NOM removal is divided into three distinct phases of initial, intermediate, and final. In the initial phase, usually lasting for several months, NOM is removed by adsorption on GAC particles. In this stage, BDOC are adsorbed more than non-biodegradable compounds (NBDOC), favoring the removal of humics, HMW, and LMW depending on the GAC characteristics (Nishijima and Speitel Jr., 2004; Von Gunten et al., 2009).
In the intermediate phase, adsorption and microorganism-induced biodegradation are combined by microorganisms. A decrease in the adsorption of NOM on the AC occurs with the increase of NOM biodegradation. In addition, the biosorption of NOM into the biofilm is observed in this phase; the surface charges of the NOM and biofilm and the NOM molecular size are significant in determining biosorptivity (Çeçen and Aktas, 2012). Because NOM is negatively charged, a negatively charged biofilm obstructs NOM sorption and transport (Carlson and Silverstein, 1998). In this phase, the fraction mainly removed consists of LMW substances because of the biological activity (Von Gunten et al., 2009).
In the final phase, when the GAC adsorption capacity is almost exhausted and the medium begins performing as a biological filter, NOM biodegradation is considered the main mechanism of removal. Therefore, biodegradable fraction and LMW substances are removed in this phase (Çeçen and Aktas, 2012; Von Gunten et al., 2009).
2.2.2.1.1. Kinetics
Different parameters such as temperature, media type, empty bed contact time (EBCT), and pre-oxidation are involved in predicting the removal efficiency of TOC by biological filtration. To simplify the analysis of the impact of these parameters, pseudo-first-order kinetics is often used to model TOC removal (Equation 2.1):
C = Co (e –k.EBCT) (Equation 2.1)
in which C and Co represent the effluent and influent biodegradable concentrations, respectively,
and k is the observed apparent rate constant. The simulated TOC concentration based on Equation 2.1 for different associated k values is represented in Figure 2.2. This shows that TOC concentration by biofiltration does not reach zero because the non-biodegradable fraction of TOC remains, as it is not removable by biofiltration.
Figure 2.2: Simulated TOC concentration as a function of EBCT for various k values A recent review on biofiltration performance for TOC removal (Terry and Summers, 2017) showed that increases in temperature in the range 0.5—35°C increase the average TOC removal for non-ozonated and ozonated conditions from 7–10% to 15% and from 11–13% to 20%, respectively. The oxidation condition of water also changes the efficiency of TOC removal; the average is increased from 10% to 15% for ozonated water to non-ozonated water, respectively. In this regard, studies have indicated that the highest TOC removal occurs at temperatures >20°C for ozonated water. The medium type has a minor impact on TOC removal; regardless of other
conditions, the average TOC removal rates are approximately 16%, 14%, and 13% for GAC, sand, and anthracite, respectively. This shows that, regardless of the temperature and oxidation conditions, biofilters remove an average of 12% TOC (minimum of 2%, maximum of 47%) in the EBCT range 2–38 min (average: 12 min).
Terry, and Summers (2017) presented data gathered for TOC removal and k constant values under various conditions for ozonated and non-ozonated water (Figure 2.3).
Figure 2.3: Distribution analysis of TOC removal and k constants with and without ozone. The boxes represent 25th, 50th (median) and 75th percentiles, the diamonds represent averages, the error bars represent 5th and 95th percentiles, and the "x" represents outliers (Terry and Summers,
2017)
2.2.2.2.Nitrification
Ammonia is a substance commonly found in water; it can be removed through the biological process called nitrification. The presence of ammonia in water decreases its quality and may promote microorganism growth. Ammonia also increases chlorine demand (Çeçen and Aktas, 2012). Nitrification consists of a two-step oxidation process (section 2.2.2.2.1) of ammonia into nitrite and nitrite into nitrate by aerobic autotrophic bacteria. These bacteria use carbon dioxide as a carbon source, while they obtain energy from the electrons taken from NH4+ and NO2− by dissolved oxygen, which is either available within the cell or taken from outside the cell (Lájer, 2012; Metcalf & Eddy Inc. et al., 2014). This group of bacteria in charge of nitrification is typically called ammonia-oxidizing bacteria (AOB), or nitrifiers.