HAL Id: hal-00329364
https://hal.archives-ouvertes.fr/hal-00329364
Submitted on 28 Feb 2005
HAL is a multi-disciplinary open access
archive for the deposit and dissemination of
sci-entific research documents, whether they are
pub-lished or not. The documents may come from
teaching and research institutions in France or
abroad, or from public or private research centers.
L’archive ouverte pluridisciplinaire HAL, est
destinée au dépôt et à la diffusion de documents
scientifiques de niveau recherche, publiés ou non,
émanant des établissements d’enseignement et de
recherche français ou étrangers, des laboratoires
publics ou privés.
sheet and in the ionosphere
R. Nakamura, O. Amm, H. Laakso, N. C. Draper, M. Lester, A. Grocott, B.
Klecker, I. W. Mccrea, A. Balogh, H. Rème, et al.
To cite this version:
R. Nakamura, O. Amm, H. Laakso, N. C. Draper, M. Lester, et al.. Localized fast flow disturbance
observed in the plasma sheet and in the ionosphere. Annales Geophysicae, European Geosciences
Union, 2005, 23 (2), pp.553-566. �hal-00329364�
Annales Geophysicae (2005) 23: 553–566 SRef-ID: 1432-0576/ag/2005-23-553 © European Geosciences Union 2005
Annales
Geophysicae
Localized fast flow disturbance observed in the plasma sheet and in
the ionosphere
R. Nakamura1, O. Amm2, H. Laakso3, N. C. Draper4, M. Lester4, A. Grocott4, B. Klecker5, I. W. McCrea6,
A. Balogh7, H. R`eme8, and M. Andr´e9
1Inst. f¨ur Weltraumforschung der ¨Osterreichischen Akademie der Wissenschaften, A-8042, Graz, Austria 2Finnish Meteorological Institute, Space Research, FIN-00101 Helsinki, Finland
3Solar and Solar Terrestrial Missions Div., ESTEC, 2200 AG Noordwijk, The Netherlands 4Radio and Space Plasma Physics Group, Dept. of Phys. and Astron., Leicester LE17RH, UK 5Max-Planck Inst. f¨ur Extraterrestrische Physik, D-85748 Garching, Germany
6Space Science and Technology Dept., Rutherford Appleton Lab., Chilton, Didcot, Oxon OX11QX, UK 7Space and Atmospheric Phys. Group, Blackett Lab., Imperial College, London SW72BZ, UK
8Centre d’Etude Spatiale des Rayonnements, F-31028 Toulouse Cedex 4, France 9Swedish Institute of Space Physics, SE-75121 Uppsala, Sweden
Received: 22 June 2004 – Revised: 10 November 2004 – Accepted: 19 November 2004 – Published: 28 February 2005
Abstract. An isolated plasma sheet flow burst took
place at 22:02 UT, 1 September 2002, when the Clus-ter footpoint was located within the area covered by the Magnetometers-Ionospheric Radars-All-sky Cameras Large Experiment (MIRACLE). The event was associated with a clear but weak ionospheric disturbance and took place during a steady southward IMF interval, about 1 h preceding a ma-jor substorm onset. Multipoint observations, both in space and from the ground, allow us to discuss the temporal and spatial scale of the disturbance both in the magnetosphere and ionosphere. Based on measurements from four Cluster spacecraft it is inferred that Cluster observed the dusk side part of a localized flow channel in the plasma sheet with a flow shear at the front, suggesting a field-aligned current out from the ionosphere. In the ionosphere the equivalent cur-rent pattern and possible field-aligned curcur-rent location show a pattern similar to the auroral streamers previously obtained during an active period, except for its spatial scale and ampli-tude. It is inferred that the footpoint of Cluster was located in the region of an upward field-aligned current, consistent with the magnetospheric observations. The entire disturbance in the ionosphere lasted about 10 min, consistent with the time scale of the current sheet disturbance in the magnetosphere. The plasma sheet bulk flow, on the other hand, had a time scale of about 2 min, corresponding to the time scale of an equatorward excursion of the enhanced electrojet. These ob-servations confirm that localized enhanced convection in the magnetosphere and associated changes in the current sheet structure produce a signature with consistent temporal and spatial scale at the conjugate ionosphere.
Correspondence to: R. Nakamura
Key words. Ionosphere (Electric fields and currents) – Mag-netosphere (MagMag-netosphere-ionosphere interactions; Plasma convection)
1 Introduction
High-speed plasma flows in the near-Earth and mid-tail plasma sheet are considered to play a key role in the flux and energy transport in the magnetotail. Most likely, these fast flows are due to acceleration in the reconnection re-gion. The flows near the boundary of the plasma sheet con-sist of field-aligned beams, whereas the flows in the cen-tral plasma sheet tend to have a large bulk flow component. The latter flows organize themselves in 10-min time scale flow enhancements, which are called bursty bulk flow (BBF) events, embedding velocity peaks of 1-min duration, which are called flow bursts, and have characteristics distinctly dif-ferent from plasma sheet boundary layer flows (Baumjohann et al., 1990; Angelopoulos et al., 1992).
To understand the magnetic flux transport process or to discuss the energy budget problems in the magnetosphere, it is crucial to quantify the bursty bulk flow signatures. Many studies using quite different methods with single spacecraft have come to the conclusion that a BBF is expected to be limited in dawn-dusk extent with a spatial scale of 3–5 RE
(Angelopoulos et al., 1997; Kauristie et al., 2000; Nakamura et al., 2001). These results were obtained by comparison be-tween satellite and ground-based data, and low-altitude ob-servations of convection, equivalent current, and auroral pat-tern. In-situ multi-point observations by ISEE and Cluster provided more direct evidence on the spatial scale, which in-ferred a scale size of 1–3 RE(Sergeev et al., 1996; Nakamura
Close relationships between the bursty bulk flow and the auroral signatures were reported by a number of studies (Fairfield et al., 1999; Sergeev et al., 1999; Zesta et al., 2000; Nakamura et al., 2001; Grocott et al., 2004). The relationship between the ionosphere and magnetosphere during fast flows is also essential to understand the role of these fast flows in larger-scale processes such as substorms. A review of the current understanding of the various ionospheric phenomena related to fast flows is given by Amm and Kauristie (2002). One major question they pose concerns the difference be-tween substorm and non-substorm events. They also point out, however, that many of the observed ionospheric effects can be shielded or greatly obscured during substorm expan-sions, by the inherent large-scale electrodynamics. In fact, Grocott et al. (2004) obtained for the first time an iono-spheric flow pattern consistent with the BBF observed by Cluster during a small pseudobreakup. These observations suggest that during quiet conditions, in the course of a sub-storm growth phase, some 10 min after a southward turning of the IMF, the BBF associated convection pattern could be observed as a mapped pattern in the ionosphere. Therefore, localized precipitation and associated field-aligned currents inferred from the IMAGE auroral data and electric potentials were not significant to affect the mapping of the electric field. Several mechanisms have been proposed to account for the auroral precipitation or field-aligned current directly associ-ated with the fast flows. The bursty bulk flows, which are usually limited in cross-tail scale and are often underpopu-lated flux tubes, called “bubbles”, are considered to become electrically polarized and thereby launching Alfv´en waves in a sense where the upward field-aligned current is created at the duskward edge, similar to the substorm current wedge (e.g. Chen and Wolf, 1993, 1999). Birn and Hesse (1996) and Birn et al. (1999) showed that the earthward reconnec-tion flows are diverted dawnward and duskward in associ-ation with the dipolarizassoci-ation of the magnetic field. Conse-quently, flow shear is created well inside the closed field line region and generates magnetic shear corresponding to the field-aligned currents of the current wedge in a bubble (Birn et al., 2004). The observed equivalent current pattern during flow bursts also supports the direct connection of the transient plasma sheet flows to the ionospheric current via a small field-aligned current wedge (Kauristie et al., 2000).
Cluster multi-point observations of BBFs combined with conjugate observations on the ground allow us to discuss the spatial structure of the disturbances simultaneously in the ionosphere and the magnetosphere to further compare with the theories. In this paper an isolated flow burst at 22:02 UT, 1 September 2002, is studied when the Cluster footpoint was located within the MIRACLE area. With a tetrahedron scale of 4000 km during summer 2002, Cluster is in an ideal con-figuration to study the spatial structure of the flow. We exam-ine the spatial and/or temporal scale of the flow burst and its relevant counterparts in the ionosphere and discuss the elec-trodynamics of the flow-associated disturbance in the iono-sphere and the magnetoiono-sphere.
2 Overview of the event
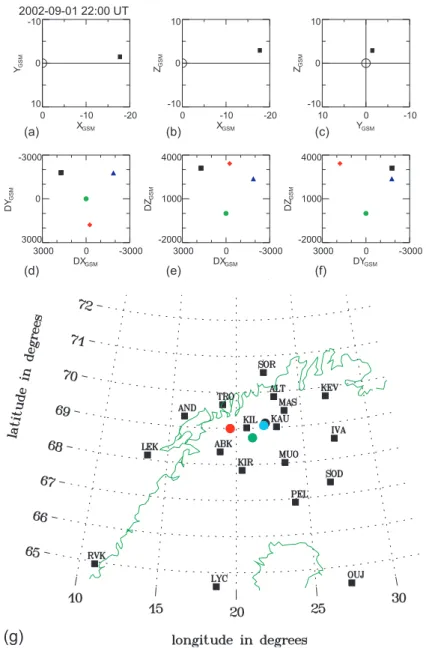
Figure 1 shows the location of the Cluster spacecraft in (a) the X−Y plane, (b) the X−Z, and (c) the Y −Z plane in the top three panels. Unless noted, the geomagnetic solar mag-netospheric coordinate (GSM) system is used throughout this paper. Cluster was located near midnight at X=−18 RE. The
relative location of the four Cluster spacecraft to the refer-ence spacecraft (SC3) in (d) the X−Y plane, (e) the X−Z plane, and (f) the Y −Z are shown in the next three panels in Fig. 1 for 22:00 UT, 1 September 2002. SC 2 was the most western satellite, SC 3 the most southward, SC 4 the most tailward and SC1 the most earthward. Figure 1g shows the geographic location of the MIRACLE magnetometer sta-tions between latitude 64◦and 71◦. Also shown are the foot-points of the four Cluster spacecraft calculated using the Tsy-ganenko (1989) model (T89). For this event, the footpoints were calculated also using the Hybrid Input Algorithm (HIA) model (Kubyshkina et al., 1999), which uses input from sev-eral spacecraft measurements to modify the tail and ring cur-rents of the T89 model, in order to obtain a best fit to the satellite observations. For this particular event data from the Cluster, POLAR and LANL satellites were used to modify the model. Yet the mapped location for this event did not differ significantly from the T89, Kp=4 mapping. The
ex-pected errors are <0.1◦in latitude and <0.5◦in longitude. KIL was the station closest to the Cluster footpoints.
Magnetotail data from Cluster, solar wind data from Geo-tail and ground magnetograms from selected MIRACLE sta-tions ordered with increasing latitude are shown in Fig. 2. Cluster observations from the fluxgate magnetometer (FGM) experiment (Balogh et al., 2001) obtained by the four space-craft, and proton data from the Composition and Distribution Function Analyser (CODIF) of the Cluster ion spectrometry (CIS) experiment (R`eme et al., 2001) from Cluster 4 are also shown in Fig. 2. For the ion data we use proton data from the CODIF instrument for Cluster 1 and 4, while ion data from the Hot Ion Analyser (HIA) instrument are used for Cluster 3. Geotail was located at X=18, Y =23, and Z=0.4 RE in the
solar wind. Data from the Geotail magnetic field measure-ment (Kokubun et al., 1994) showed quite stable southward IMF after 21:00 UT. It can be seen that the total pressure in the magnetotail observed by Cluster, gradually increased un-til around 23:00 UT, suggesting that a pileup of the magnetic flux took place. The pressure dropped significantly, associ-ated with the enhancement of the westward electrojet in the MIRACLE stations, which is a typical signature of the ex-pansion phase of a major substorm. Cluster stayed mainly in the plasma sheet until 23:05 UT when the spacecraft went out into the lobe associated with the major substorm expansion phase onset. The details of the substorm expansion phase onset at 23:05 UT were studied in Draper et al. (2004). The bursty bulk flow event which will be studied in detail in this paper occurred at around 22:00 UT, as shown as a grey bar in Fig. 2. The event took place about 1 h before the major onset during a prolonged interval of southward IMF with a very weak signature in the auroral electrojet in the midnight
R. Nakamura et al.: Fast flow in plasma sheet and ionosphere 555 2002-09-01 22:00 UT 0 -10 -20 XGSM 10 0 -10 YGSM 0 -10 -20 XGSM -10 0 10 ZGSM 10 0 -10 YGSM -10 0 10 ZGSM 3000 0 -3000 DXGSM 3000 0 -3000 DY GSM 3000 0 -3000 DXGSM -2000 1000 4000 DZ GSM 3000 0 -3000 DYGSM -2000 1000 4000 DZ GSM (a) (b) (c) (d) (e) (f) (g) 2002-09-01 22:00 UT 0 -10 -20 XGSM 10 0 -10 YGSM 0 -10 -20 XGSM -10 0 10 ZGSM 10 0 -10 YGSM -10 0 10 ZGSM 3000 0 -3000 DXGSM 3000 0 -3000 DY GSM 3000 0 -3000 DXGSM -2000 1000 4000 DZ GSM 3000 0 -3000 DYGSM -2000 1000 4000 DZ GSM
(a) (b) (c)
(d) (e) (f)
(g)
Fig. 1. Location of the four Cluster spacecraft in (a) X−Y plane and (b) X−Z, plane and (c) Y −Z plane, and location relative to the reference spacecraft (Cl 3) in (d) X−Y plane and (e) X−Z, plane and (f) Y −Z plane in the GSM coordinates. (g) Location of the MIRACLE stations and that of the Cluster footpoints in geographic coordinates. Clusters 1, 2, 3 and 4 data are indicated with black, red, green, and blue, respectively.
region. This rather steady magnetospheric/ionospheric con-dition allows us to investigate the BBF related disturbance without any significant contamination from other activities. In the following sections, we will first investigate the tem-poral and spatial characteristics of the bursty bulk flows and then examine the associated ionospheric signatures.
3 BBF signatures in the magnetosphere
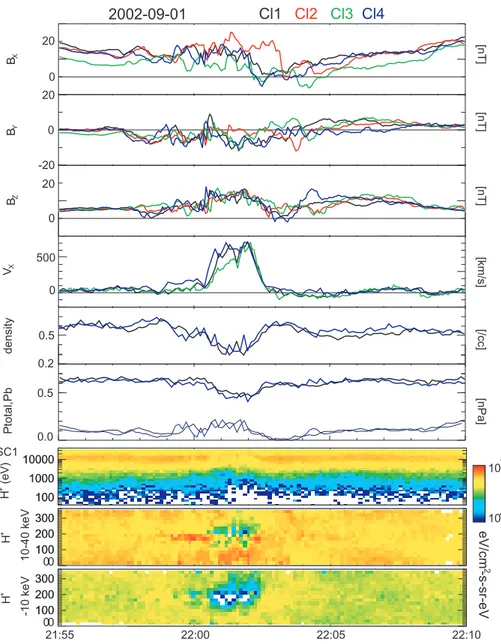
Figure 3 shows the Cluster magnetic field and ion obser-vations during the flow interval. Earthward flow with a speed exceeding 700 km/s was observed for the three space-craft between 22:00 and 22:04 UT associated with a sharp
enhancement in Bz, indicating dipolarization, which is
vis-ible also on SC2; but since CIS is not operational on SC2, we discuss on plasma flows on SC2, later using other ob-servations. The flow burst was accompanied by a decrease in density and an increase in magnetic field pressure, which is a typical signature for a plasma bubble (Sergeev et al., 1996). Compared to the high-speed flow features, mag-netic field fluctuation lasted somewhat longer. The fluctu-ations in all three components were visible already starting before 21:58 UT. All spacecraft entered the neutral sheet re-gion by the end of the flows and the fluctuations ceased after 22:08 UT. The enhanced difference among the traces of the four spacecraft suggests that the local current density con-tained small-scale structures.
IMAGE magnetometer
20 21 22 23 00 Hour (UT) X-COMPONENT 500 nT 1 minute averages SOR KIL MUO PEL GEOTAIL -10 0 10 BZ [nT] [nT] [nT] [nT] [km/s] [nPa] 2002-09-01 Cl1 Cl2 Cl3 Cl4 -20 10 40 BX_GSM -30 0 30 BY_GSM -30 0 30 BZ_GSM -600 300 1200 VX_GSM 0.01 0.10 1.00 10.00 100.00 beta 0.0 0.5 1.0 Ptotal, PB a b c d e f g hFig. 2. Cluster, Geotail and ground magnetogram from selected MIRACLE stations between 20:00 and 24:00 UT, on 1 September 2002. Cluster observation of (a) X, (b) Y , and (c) Z component of the magnetic field from the four Cluster spacecraft, (d) X component of the ion flow, (e) proton beta, (f) total pressure (thick line) and magnetic pressure (thin line) for Cluster 4. Clusters 1, 2, 3 and 4 data are shown in black, red, green, and blue, respectively. (g) Geotail magnetic field data in the solar wind. (h) X component of the ground magnetic field data from selected MIRACLE stations. The grey vertical line indicates the bursty bulk flow event around 22:00 UT.
The bottom three panels of energy flux spectra and angular distribution data from SC 1 show that the distribution at the maximum flow interval (22:01–22:02 UT) has a signifi-cant perpendicular component (close to 90◦) to the magnetic field. Before this flow, some enhancement in the tailward (180◦) component can be seen in the low-energy part be-tween 21:58–21:59 UT. Bebe-tween 21:59 and 22:00 UT, the energetic component (>10 keV) consists of a tailward field-aligned beam and a perpendicular component, whereas for
the lower energies, the perpendicular component is domi-nant. The energy of the field-aligned component is therefore increased. The ion velocity distribution significantly changes between 22:00 UT and 22:01 UT, which will be discussed later. There is also a signature of a beam (180◦) after the bulk flows. The field-aligned beam weakens between 22:04 and 22:05 UT. Taking into account all of these features, we can say that the time period of the ion flow and beam disturbance at Cluster was between about 21:58 and 22:05 UT, which has
R. Nakamura et al.: Fast flow in plasma sheet and ionosphere 557 0 20 BX -20 0 20 BY 0 20 BZ 0 VX 0.5 density 21:55 22:00 22:05 22:10 0.0 0.5 0.2 Ptotal,Pb 2002-09-01 [nT] [nT] [nT] [km/s] [/cc] [nPa] Cl1 Cl2 Cl3 Cl4 100 1000 10000 SC1 H + (eV) 100 1000 10000 104 107 0 100 200 300 H + 10-40 keV 1000 200 300 0 100 200 300 H + -10 keV 0 100 200 300 500 eV/cm 2 -s-sr-eV
Fig. 3. X, Y and Z component of the magnetic field from the four Cluster spacecraft, X component of the ion flows from Clusters 1, 3, and 4, and proton density and pressures obtained by Clusters 1 and 4 between 21:55 and 22:10 UT. The thick lines in the pressure panel represent to the total pressure, whereas the thin lines the magnetic field pressure. The bottom three panels show the proton energy spectra, pitch angle distribution of high energy (10–40 keV) and low energy (100 eV–10 keV) protons for Cluster 1.
a somewhat shorter time scale than the current sheet distur-bance discussed before.
Both the flow and magnetic field traces showed differences among the spacecraft. Cluster 3 was about 3000 km south of the other spacecraft but still over the Northern Hemisphere, which is consistent with the small values in Bx before and
after the event. But during the flow burst interval, the traces are more complicated. It can be seen that Cluster 2 stayed in a large Bx region longer than the other three spacecraft.
Note that Cluster 2 was located most duskward and therefore the difference implies a dawn-dusk localized structure of the flow. Since there is no ion data from Cluster 2, we use the electric field data from the Electric Field and Wave (EFW) instrument (Gustafsson et al., 2001) to further investigate the
spacecraft difference. A detailed in-flight calibration of the electric field measurements was done by comparing with the quiet time CIS moments for Clusters 1, 3, and 4 before and after the BBF event. On Cluster 2, the calibration was based on a typical default value, and so one needs to remember that the electric field in the Sun direction on this spacecraft may still contain a small error. The three components of the electric field are obtained by assuming E·B=0.
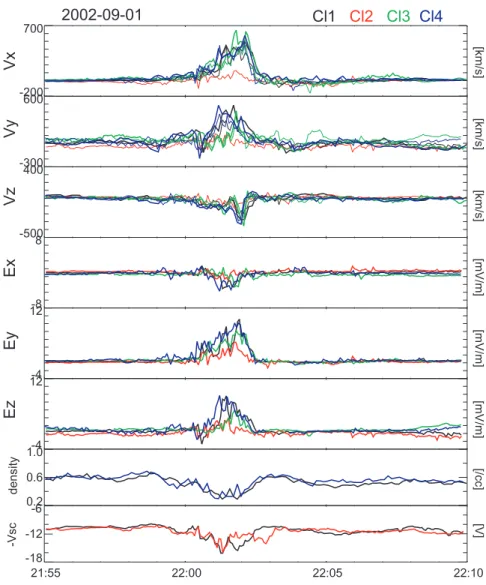
Figure 4 shows the flow perpendicular to the magnetic field and the electric field and density profile between 21:55 and 22:10 UT using measurements from CIS and EFW. The three upper panels show the ion flow velocity perpendicu-lar to the magnetic field (thick lines) and E×B drift velocity (thin lines). It can be seen that although there are some minor
-200 700 Vx -300 600 -500 400 -8 8 -4 12 -4 12 0.2 0.6 1.0 density 21:55 22:00 22:05 22:10 -18 -12 -6 -Vsc 2002-09-01 [km/s] [km/s] [km/s] [mV/m] [mV/m] [mV/m] [/cc] [V] Cl1 Cl2 Cl3 Cl4 Ez Ey Vz Vy Ex
Fig. 4. CIS and EFW observations of X, Y , and Z component of the flow perpendicular to the magnetic field and the electric field, and density. The flow velocity obtained by the CIS instrument is shown as thick line, whereas E×B drift velocity obtained by the EFW and FGM measurements are shown as a thin line. The electric field data are plotted using the EFW measurement and the assumption of E·B=0. The bottom two panels show the proton density from Clusters 1 and 4 and the negative value of the spacecraft potential from Clusters 1 and 2.
discrepancies in the magnitude, the general trend between CIS and EFW coincides during the flow event, suggesting that the perpendicular flow moment from CIS is mainly due to the E×B velocity. It can also be seen that it is Ez that
deflects the BBF toward the azimuthal direction rather than Ex for this event. The bottom two panels show the density
profile from Clusters 1 and 4 and the negative value of the spacecraft potential, −Vsc, from Clusters 1 and 2. The latter
is a good indicator of the density, which can be seen in the similar temporal profile between the Cluster 1 traces in the two bottom panels. The profile shows that Cluster 2 also en-countered the plasma bubble. Yet the electric field plot from EFW, as well as the flow plots, show that Cluster 2 observed significantly smaller velocities and electric fields compared to the other spacecraft during the BBF event.
One can see that the Vy and Ez values on Cluster 2
be-fore the BBF event also differ a little from the values on the other spacecraft. As given above, Ex calibration cannot be
quite accurately performed for Cluster 2, which may explain these negative Vy and Ezoffsets. The differences could be,
however, also real and due to spatial changes. Nevertheless, these differences at non-BBF times are small enough so that one can conclude that both the Eyand Ez, or Vxand Vy, are
significantly smaller for Cluster 2 during the BBF.
There is also a clear spacecraft difference in the timing of the dipolarization in Fig. 3. The dipolarization started at Cluster 4, followed by Clusters 1 and 2, and then Cluster 3. Note that Cluster 4 was located most tailward, as shown in Fig. 1. Cluster 3 was located about 3000 km south of the other three spacecraft. Thus, a disturbance in dipolarization
R. Nakamura et al.: Fast flow in plasma sheet and ionosphere 559
Table 1. Minimum (maximum) variance direction of the magnetic (electric) field of the dipolarization front.
SC UT min, max n1 n2 n3 λ2,1or λ3,2 C1 22:00:20–22:00:40 min 0.79 0.27 −0.54 12 C2 22:00:21–22:00:41 min 0.34 0.53 −0.78 10 C2 22:00:21–22:00:41 max 0.41 0.76 −0.51 3 C3 22:00:30–22:00:50 min 0.96 0.08 −0.26 11 C4 22:00:13–22:00:33 min 0.75 0.31 −0.58 8 C4 22:00:13–22:00:33 max 0.67 0.53 −0.52 7 ∆X ∆Y ∆X (a) (b) (c) 2002-09-01 ∆Z ∆Z ∆Y 3000 0 -3000 3000 0 -3000 200 km/s 200 km/s 200 km/s 3000 0 -3000 -2000 1000 4000 200 km/s 200 km/s 200 km/s 3000 0 -3000 -2000 1000 4000 1 2 3 2 1 3 1 2 3 11 2 3 11 2 3 11 2 3 11 2 3 11 2 3 2 3 11 Cl1 Cl2 Cl3 Cl4
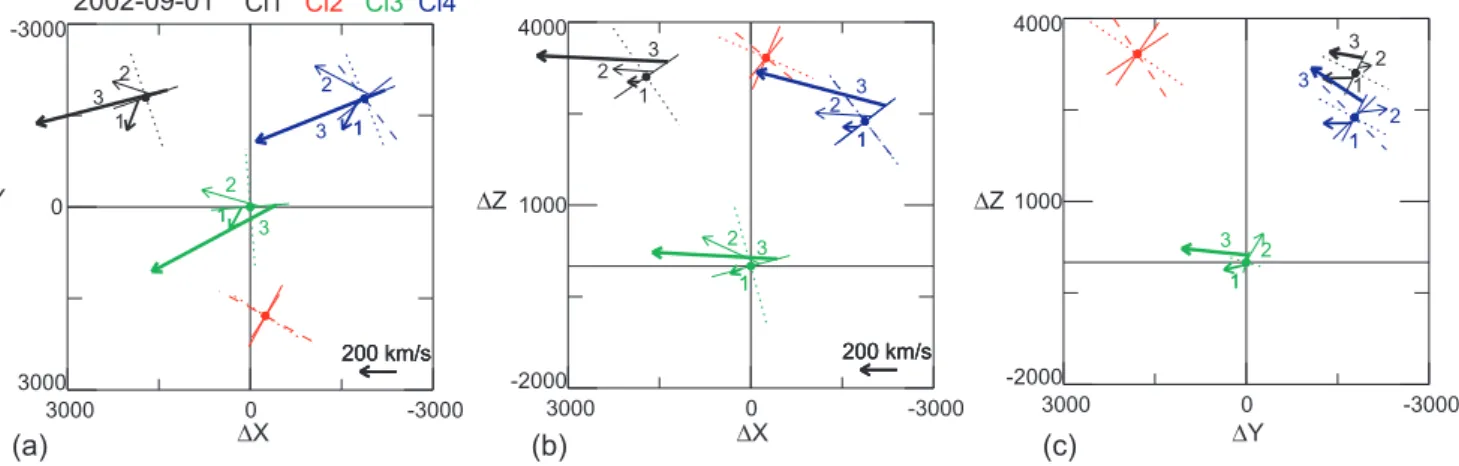
Fig. 5. The direction of the dipolarization front for the four spacecraft plotted as the projection in (a) the X−Y plane, in (b) the X−Z plane and in (c) the Y −Z plane together with the flow vectors for selected sequences from Clusters 1, 3, and 4. Dotted lines are the orientation obtained from the minimum variance analysis of the magnetic field and as dashed lines for the orientation obtained from the maximum variance analysis obtained from the electric field. The normal direction to the front is presented with a thin line crossing the dotted or dashed line. For each spacecraft the longest arrow marked with 3 corresponds to the maximum flow during the BBF event. The thin arrow drawn from an earthward proceeding point along the normal direction, corresponds to the flow vector at the time of the minimum angle after the dipolarization front and is marked with 2. The short thick arrow, marked with 1, drawn from a point further earthward along the normal direction, corresponds to the flow vector at the time of the first maximum deflection before the dipolarization front. Clusters 1, 2, 3 and 4 data are indicated with black, red, green, and blue, respectively.
was propagating toward Earth and toward the equator. Such motion of the dipolarization front was also obtained by Clus-ter during a dawnside flow burst (Nakamura et al., 2002).
The structure of the fast flows can be determined by ex-amining the orientation of the dipolarization front by per-forming the minimum variance analysis of the magnetic field (Sergeev et al., 1996; Nakamura et al., 2002). We used the 1-s averaged FGM data to determine the orientation of the boundary. We performed also the maximum variance anal-ysis of the electric field (Sonnerup and Scheible, 1998, and references therein), using 1-s averaged EFW data for Clus-ters 2 and 4 from which high resolution data were avail-able. The resulting normal vectors to the dipolarization front are shown in Table 1. As a quality check of the minimum (maximum) variance analysis, the ratio between intermedi-ate (maximum) and minimum (intermediintermedi-ate) eigenvalues is also given in the table. In spite of the fact that the quality of the analysis is rather poor for the electric field data, agree-ment between the two methods of boundary determination
for Cluster 2 and 4 is quite good. The projection of the dipo-larization front in (a) the X−Y plane, in (b) the X−Z plane and in (c) the Y −Z plane are shown in Fig. 5 as dotted lines for the orientation obtained from minimum variance analysis of the magnetic field data and as dashed lines for the orienta-tion obtained from maximum variance analysis of the electric field data. The normal direction is presented with a thin line crossing the dotted or dashed lines. The orientation of the dipolarization front of the three northern spacecraft, Clus-ters 1, 2, and 4, shows a clear dependence in the Y direction, that is, the dipolarization front of Cluster 2, which is located most duskward, is more tilted toward the X direction com-pared to Clusters 1 and 4, which have a dipolarization front more aligned in the Y direction. The difference suggests that Cluster 2 sees the edge effect of a localized flow channel. The difference in orientation can also be seen in the X−Z plane, which comes from the fact that the field configuration of Cluster 2 is more tail-like (large Bx). There is no ion data
azimuth angle latitmude angle 0 400 800
V
-90 0 90 21:59 22:00 22:01 22:02 22:03 -90 0 90V
relative to dipolarization front0 400 800
V
-90 0 90 azimuth angle 21:59 22:00 22:01 22:02 22:03 -90 0 90 latitmude angleV
relative to dipolarization frontFig. 6. Clusters 1, 3, and 4 observations of the ion flow speed and direction of the flow relative to the normal direction of the dipolarization front in the X−Y plane and in the X−Z plane. Here the relative azimuth angle corresponds to the angle between the flow and the normal direction in the X−Y plane, whereas the relative latitude angle corresponds in the X−Z plane. The left panels are for the total ion flow, whereas the right panels for the perpendicular component of the flows. The vertical dashed lines show the period of the dipolarization for each spacecraft presented with the same color (Clusters 1, 3 and 4 data are indicated with black, green, and blue) as the velocity profile.
electric field measurement (Fig. 4) in which the E×B drift for Cluster 2 was significantly smaller compared to the other spacecraft.
Since the shear of the flow could be directly related to the field-aligned current, it is of interest to examine how the flow direction is oriented relative to the dipolarization front. Fig-ure 6 shows the ion flow direction change relative to the nor-mal direction in the X−Y plane and in the X−Z plane for total flow (left panel) and flow perpendicular to the magnetic field (right panel). Here the azimuth angle corresponds to the angle between the flow and the normal direction to the dipo-larization front in the X−Y plane, whereas the latitude angle corresponds to the relative angle in the X−Z plane. The vertical dashed lines show the period of the dipolarization (rapid change in Bz) for each spacecraft presented with the
same color as the velocity profile. It can be seen that domi-nant changes in the direction around the boundary took place in the azimuthal angle. It became positive before and dur-ing the dipolarization, but changed rapidly to negative just after the dipolarization and then changed to a positive di-rection for the perpendicular component of the flow. The fast flow direction then became more aligned with the nor-mal direction to the dipolarization front. These three steps of changes in the direction are presented in Fig. 5 with the ar-rows for the total flow marked with 1–3. For each spacecraft, the longest arrow corresponds to the maximum flow during the BBF event and is marked with 3. The thin arrow, which is marked with 2 and drawn from a point locating earthward along the normal direction, corresponds to the flow vector
at the time of the minimum azimuth angle after the dipo-larization front. The short thick arrow drawn from a point further earthward along the normal direction, corresponds to the flow vector at the time of the first maximum azimuthal deflection before the dipolarization front and is marked with 1. It can be seen from Figs. 5 and 6 that the BBF is preceded by deflections near the dipolarization front, which is first to-ward dusk before the front (arrow 1) and then toto-ward dawn (arrow 2), or toward the radial direction to the Earth, after the passage of the front. As shown in Fig. 5, the flow deflec-tion produced by the arrows 1 and 2 around the dipolarizadeflec-tion front is then anticlockwise looking into the X−Y plane from north (Fig. 5a), or clockwise looking from the tail into the Y −Zplane (Fig. 5c). This is consistent with the flow shear associated with the magnetic shear producing field-aligned current out from the ionosphere (Birn et al., 1999; Birn et al., 2004). An opposite sense of the shear near a dipolarization front dawnside of a flow burst was reported by Nakamura et al. (2002), which suggests that a current wedge like a field-aligned current may be created and associated with the flow burst if we take into account both observations.
4 Ionospheric features
As shown in Fig. 1, the Cluster footpoint was located at the middle of the MIRACLE observation area. We examine the temporal and spatial change in the equivalent current pat-tern around the time interval of the bursty bulk flows. In
R. Nakamura et al.: Fast flow in plasma sheet and ionosphere 561 order to examine the latitudinal variation of the currents, we
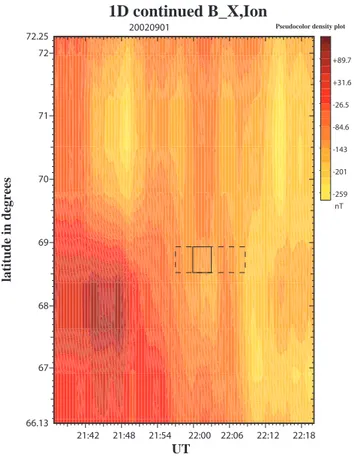
use a technique described by Vanham¨aki et al. (2003) that performs the upward field continuation for a 1-D meridional chain of magnetometers using spherical coordinates. In this technique the magnetic field immediately below the iono-sphere is derived from the magnetic field measured on the ground, assuming that the atmosphere in between is current-free. Figure 7 shows the 1-D-upward field continuation of the X component of the magnetic field, corresponding to the east-west equivalent current, to the ionosphere performed for the north-south IMAGE magnetometer chain. The black rectangle shows the time of the disturbance and footpoint area of the Cluster. The solid rectangle shows the inter-val of the flow disturbance at Cluster, whereas the dashed one presents the interval of the entire current sheet distur-bance at Cluster which was discussed in the previous section. It can be seen that a westward equivalent current centered around 70.5◦ latitude suddenly jumps to 68.5◦ starting at
21:59:50 UT with the most equatorward maximum between 22:03 and 22:04 UT, after which the maximum jumps back polewards. It is interesting to note that the Cluster BBF activ-ity coincides temporally as well as spatially with this sudden equatorward movement of the westward electrojet. The west-ward electrojet center located polewest-ward of the spacecraft took place earlier than the Cluster BBF observations, whereas the equatorward one took place later, suggesting that there is an equatorward propagating disturbance observed both at Clus-ter and on the ground.
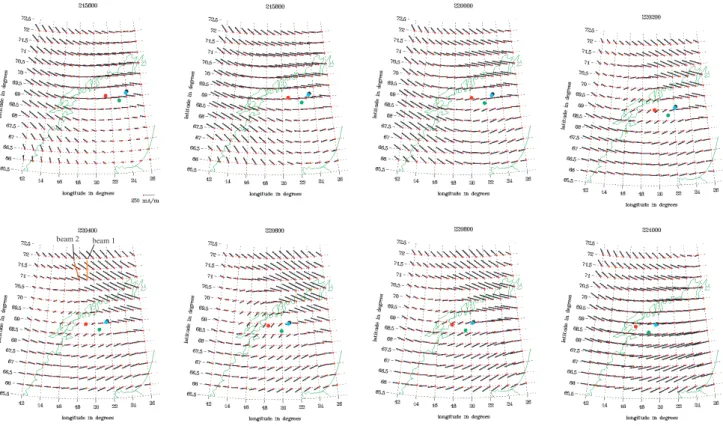
Figure 8 shows the equivalent current pattern using the full 2-D set of IMAGE magnetometer measurements based on the 2-D magnetic field continuation technique to the iono-sphere (Amm, 1997; Amm and Viljanen, 1999) for every 2 min between 21:56 and 22:10 UT. Although the amplitude of the disturbance in the equivalent current associated with the flow is not exceeding several tens nT, a clear localized pattern can be seen: development of a south-westward di-rected current at the Cluster footpoints region and south-west side of it, and a westward directed current at the north-eastside of the former, starting around 22:00 UT and last-ing until 22:08–22:09. A similar equivalent current pattern was also obtained for an N-S aurora during a major substorm time (see Fig. 7a, Amm et al., 1999), except for the much larger amplitude of the current and wider extent of the pat-tern. Based on Amm et al. (1999), the south-westward equiv-alent current region that was located at the south-west side of the north-westward directed equivalent current region cor-responded to the upward field-aligned current region. This was aligned with the edge of the N-S auroral structures cor-responding to the location where the south-westward equiva-lent current changed to a north-westward equivaequiva-lent current. At the eastern side of it where the equivalent current was north-westward, a downward current was widely distributed. Although the conductivity as well as the electric field pattern may differ between these active and quiet times, development of the region of the south-westward equivalent current and north-westward equivalent current can also be clearly iden-tified in Fig. 8 (in 22:02–22:06 UT plots). If we apply the
21:42 21:48 21:54 22:00 22:06 22:12 22:18 66.13 67 68 69 70 71 72 72.25
1D continued B_X,Ion
UT latitude in degreesPseudocolor density plot
20020901 840 782 724 -666 -607 -549 -491 -433 -375 -317 -259 -201 -143 -84.6 -26.5 +31.6 +89.7 nT
Fig. 7. One-dimensional upward field continuation of the X compo-nent of the magnetic field to the ionosphere performed for the north-south IMAGE magnetometer chain. Here the color code shows the east-west equivalent current (westward equivalent current expressed in negative values in nT). The black rectangle shows the time of the disturbance and footpoint area of the Cluster. The solid rectangle shows the interval of the flow disturbance at Cluster, and together with the dashed rectangles, present the interval of the entire current sheet disturbance at Cluster.
equivalent current and the field-aligned current pattern of the N-S aurora by Amm et al. (1999) to the 1 September event, the Cluster footpoint, which was located in a region mainly south-westward equivalent current near the changing loca-tion to the north-westward equivalent current, corresponds to the upward field-aligned current at the auroral region. The upward field-aligned current in the ionosphere is consistent with the field-aligned current out from the ionosphere, in-ferred from the Cluster observation discussed in the previous section.
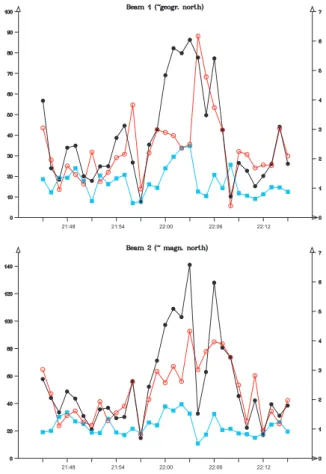
The height-integrated conductances obtained from the Eu-ropean Incoherent SCATter (EISCAT) facility for two VHF beams from the Tromso radar are shown in Fig. 9: Beam 1 looks (almost) to the geographic north, beam 2 (almost) to geomagnetic north. Black points are 6H, blue quadrants 6P
(scale to the left), and red circles α=6H/6P (scale to the
right). Both beams see a clear conductance maximum around 22:03 UT, in good agreement with the expected occurrence of the streamer current system. (The sudden drop at around 22:04 UT for the beam 2 plot is an artifact because the
con-beam 2 beam 1
Fig. 8. Equivalent current pattern using full 2-D set of IMAGE magnetometer based on the 2-D magnetic field continuation technique to the ionosphere for every 2 min between 21:56 and 22:10 UT. Cluster footpoint is also shown in each plot.
ductance fitting has failed at several altitudes.) Beam 2 sees larger conductances than beam 1. This is obvious from the plots of equivalent currents between 22:00 and 22:07 UT in which the location of the two beams is superposed to the equivalent current vectors in 22:04 UT plot in Fig. 8. Beam 2 is closer to the westward flank of the streamer where we ex-pect an upward field-aligned current and the largest conduc-tances. The absolute maximum values of ∼90 S and ∼140 S are rather high. Note, however, that the previous result by Amm et al. (1999) indicated that most of the current system related to a streamer is magnetically invisible, that is, for this event EISCAT measures conductances with a smaller spatial scale than the detectable scale by the method of characteris-tics determined from the magnetic field measurements.
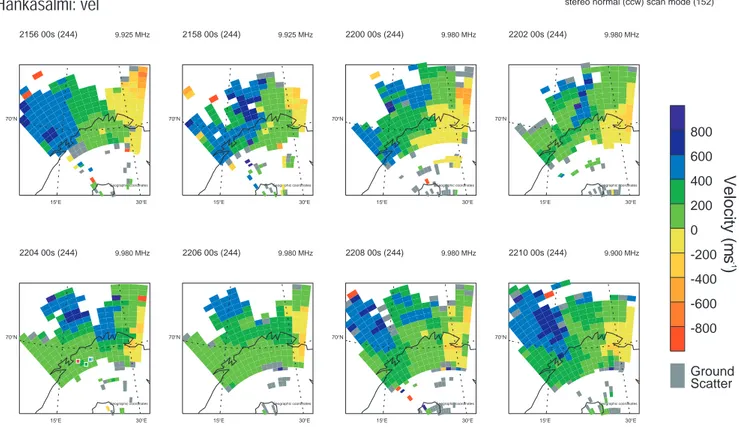
Figure 10 shows two-dimensional maps of the Co-operative UK Twin Auroral Sounding System (CUTLASS) Finland flow data over the interval 21 : 56 − 22 : 10 UT. The Cluster footpoint location is indicated in the 22:04 UT plot. Since there was no area where both of the two radars were observing scatter, we cannot deduce the 2-D ionospheric flow vectors for this event. Yet we can deduce the possible change in the convection pattern from the line-of-sight ve-locity shown in the figure. Here positive (for example, blue) velocity is towards the radar, whereas negative (for example, red) is flow away from the radar. The 21:56 UT plot with change of color from blue to yellow shows the feature of the dawn-side cell, most likely related to a south-eastward drift. This pattern is modified due to a retreat of the blue area at
the western side and an appearance of a blue area at the cen-ter north-eastward of the Cluscen-ter meridian region, which is clearest at 22:04 UT plot. This pattern suggests that strong equatorward convection is developed, taking over the previ-ous dawnward drift. Afterwards, the central blue area retreats and the western blue area appears to reform the initial pattern between 22:08 and 22:10 UT. These plots suggest, therefore, that a localized strong equatorward convection pattern ap-peared, around the Cluster meridian, centered north-east of the Cluster region, during the similar time interval as the equivalent current and conductivity enhancement showed. Grocott et al. (2004) observed a similar localized equator-ward ionospheric flow enhancement but in the dusk cell of the global convection region obtained by SuperDARN, asso-ciated with a bursty bulk flow and pseudobreakup.
5 Discussion
The Cluster spacecraft observations of an isolated flow burst with the spacecraft tetrahedron scale of 4000 km showed a clear difference among the spacecraft, indicating the flow channel to be spatially localized. As shown in Fig. 5a, the dipolarization front of Clusters 1, 2, and 4, that were lo-cated almost in a plane parallel to the X−Y plane, showed hardly any difference along the X direction, but a clear edge effect along the Y direction. There were also some differ-ences in the dipolarization front along the Z direction, as
R. Nakamura et al.: Fast flow in plasma sheet and ionosphere 563 can be seen in Fig. 5b., that is, the dipolarization front is
more tilted against the X−Y plane at Cluster 3 near the neu-tral sheet, compared to the other three spacecraft. Further-more, the dipolarization front in the Cluster 3 direction sug-gests that the Y dimension of the flow channel could have a somewhat different shape close to the equatorial plane. Since Clusters 1 and 2 observed the dipolarization front within 1 s in nearly the same Z, we can assume that the difference is mainly spatial, and the front structure is observed by these two spacecraft, as illustrated in Fig. 11a, and we can deduce the spatial scale of the flow. If we simply assume a circular surface, for simplicity, then the radius corresponds to the half size of the flow. From the Cluster 1 and Cluster 2 difference in the Y component of the normal direction and spacecraft lo-cation, we can deduce a radius of 1.1 RE, whereas from the
Xcomponent of the normal direction and spacecraft location the radius was 0.75 RE. Although the actual front cannot be
a circular surface, and the fronts were observed not exactly simultaneously, this simple estimation provides a typical di-mension of the fast flow, 1.5–2.2 RE. This is comparable
to the statistical studies of the flow burst (Nakamura et al., 2004) which showed that on average its spatial scale is 2– 3RE in the dawn-dusk direction and 1.5–2 RE in the
north-south direction.
All three Cluster spacecraft with plasma measurements, Clusters 1, 3, and 4, showed a systematic change of the flow direction relative to the dipolarization front, as illustrated in Fig. 11a. There is a strong flow shear at the front: at the earthward part flows direct more toward dusk, whereas the flow right behind the front was directed rather toward mid-night (or more radial direction). The flow shear at the dipo-larization front is expected to cause a field-aligned current out from the ionosphere, consistent with the simulation of the bubble (Birn et al., 1999; Birn et al., 2004). It is interest-ing to note that this strong shear at the dipolarization front is due to the deflection of the flow toward radial direction (or conversion of the flow direction) but not due to the diversion of the fast flow as was predicted in the simulation. An op-posite sense of the rotation is created between this radially deflected flow and the major flow behind, although this ro-tation involves much larger spatial scale and therefore may contribute to weaker and broader field-aligned current flow-ing into the ionosphere.
The current sheet disturbance associated with the flow burst in the magnetosphere coincides with a sudden jump in the westward ionospheric equivalent current and the develop-ment of a localized ionospheric equivalent current (obtained from the MIRACLE magnetometers) and electric field pat-tern (inferred from the line-of-sight velocity of SuperDARN) and their recovery within 1–2 min. The onset of the bursty bulk flow, on the other hand, was observed after the cur-rent sheet and ground magnetic field disturbances broke out, but still before the maximum of the ionospheric disturbance. This could be related to the fact that initially the center of the westward electrojet was located at a higher latitude than the Cluster footpoint but then it moved equatorward of the foot-point, possibly indicating that the magnetospheric source
re-21:48 21:54 22:00 22:06 22:12
21:48 21:54 22:00 22:06 22:12 21:48 21:54 22:00 22:06 22:12
21:48 21:54 22:00 22:06 22:12
Fig. 9. The height-integrated conductances with time obtained from EISCAT radar for two VHF beams from the Tromso radar: Beam 1 looks (almost) to the geographic north, beam 2 (almost) to
geomag-netic north. Black points are 6H, blue quadrants 6P (scale to the
left), and red circles α=6H/6P (scale to the right).
gion was moving equatorward. The current sheet disturbance seems to be therefore directly coupled with the ionospheric activity, whereas the flow itself could cause the equatorward jump of the electrojet reaching the maximum of the iono-spheric activity.
Figure 11b shows the curl of the equivalent current at 22:02 UT. This quantity would be proportional to the field-aligned currents if there were uniform conductances. This is not exactly the case since EISCAT observed some local con-ductance enhancement. Yet the observations indicated a very localized enhancement, and it is therefore expected that such a localized conductivity feature would not affect the overall structure of the equivalent current pattern. The Cluster foot-point location is at the south-western edge of this negative curl, corresponding to the region of an upward field-aligned current, as also expected in the magnetosphere. A devel-oped positive curl region can be seen at the further north-east side, forming a possible downward current region. Yet it should be noted that this structure starts to build up al-ready at 21:56:40 UT, with a detached patch of negative curl equatorward of the background system. These observations in the magnetosphere and ionosphere suggest that the 2-min long observation of bursty bulk flow at Cluster could be due
Geographic coordinates 2156 00s (244) 9.925 MHz 70°N 15°E 30°E Geographic coordinates 2158 00s (244) 9.925 MHz 70°N 15°E 30°E Geographic coordinates 2200 00s (244) 9.980 MHz 70°N 15°E 30°E Geographic coordinates 2202 00s (244) 9.980 MHz 70°N 15°E 30°E Geographic coordinates 2204 00s (244) 9.980 MHz 70°N 15°E 30°E Geographic coordinates 2206 00s (244) 9.980 MHz 70°N 15°E 30°E Geographic coordinates 2208 00s (244) 9.980 MHz 70°N 15°E 30°E Geographic coordinates 2210 00s (244) 9.900 MHz 70°N 15°E 30°E
SUPERDARN PARAMETER PLOT
Hankasalmi: vel
1 Sep 2002
(244) stereo normal (ccw) scan mode (152)-800 -600 -400 -200 0 200 400 600 800
Velocity (m
s
-1)
Ground ScatterFig. 10. Two-dimensional maps of the CUTLASS Finland flow data over the interval 21:56-22:10 UT. Cluster footpoint location is indicated in the 22:04 plot. 3000 0 -3000 3000 0 -3000 200 km/s ∆Y ∆X 2202
(a) (c)
(b)
+ 30 x10-30 -7A/m2 2002-09-01 Cl1 Cl2 Cl3 Cl4Fig. 11. (a) Possible shape of the dipolarization front illustrated on top of the relative location of the four Cluster spacecrafts in GSM X−Y plane with flow vectors at three different sequences in the same manner as Fig. 5a. The pink arrows show the sense of the flow shear ahead and behind the dipolarization front. (b) The curl of the equivalent current at 22:02 UT and the footpoints of Cluster. Crosses correspond to the downward (positive) direction and squares to the upward (negative) direction. (c) Equivalent current pattern at 22:02 UT, together with the footpoint of Cluster. The most likely location of the conjugate region of the flow channel (pink) and the most likely center of auroral precipitation region (orange) are illustrated (see text for detail).
R. Nakamura et al.: Fast flow in plasma sheet and ionosphere 565 to the spacecraft passing the flow channel, while a current
system and electric field pattern were activated, expanding the area and recovering again in about 10 min. Cluster also observed tailward field-aligned beams before and after the flow burst. Tailward flows have been predicted in the flux tube behind the earthward moving bubble (Birn et al., 2004). The field-aligned tailward flows behind the flow burst could be explained by such a mechanism. Since the energy spec-tra in Fig. 3 suggests that spacecraft moved from the outer plasma sheet to the inner plasma sheet, the preceding beam may also be interpreted due to the same mechanism.
The BBF event in this study, with an enhanced equa-torward flow in the ionosphere, suggests that the magneto-spheric electric field pattern directly mapped into the iono-sphere could possibly be observed. Due to the low (or very localized) conductance enhancement, as can be seen from the small, overall magnetic disturbance, the resultant Hall-current pattern was reproduced in the equivalent cur-rent pattern. Grocott et al. (2004) determined the curl of the ionospheric convection, which could correspond to the field-aligned current region in a uniform conductivity. A similar pair of curls is seen in the equivalent current, suggesting that the current wedgelet was also observed in this study. Based on a model of a bubble-associated electric field in the mag-netosphere mapped to the ionosphere and uniform Hall con-ductivity, Chen et al. (2004) predicted a similar south-west equivalent current pattern at the south-west of the bubble, as was observed in this study. Figure 11c illustrates the pos-sible spatial relationships between the flow channel in the magnetosphere and conjugate ionospheric disturbance. Tak-ing into account the equivalent current pattern from magne-tospheric and ionospheric observations, the area surrounded by the pink curve shows the expected area conjugate to the flow channel. It is interesting to note that the alignment of the possible region of the auroral streamer is directed northwest-southeast, whereas the main fast flow direction is mapped to a more northeast-southwest direction, meaning that it is the dipolarization front that creates the magnetic shear and causes the possible precipitation and field-aligned current and, therefore, aligned to the auroral streamer direction.
6 Conclusion
The ionospheric and magnetospheric signatures of a plasma sheet fast flow have been determined using simultaneous Cluster and ground-based observations during a steady IMF period with small background ground magnetic activity in the midnight sector. From the orientation of the dipolariza-tion front, it was inferred that Cluster was located at the dusk-side part of a localized plasma sheet flow channel of scalesize 1.5–2 RE, with a shear in the flow, suggesting a field-aligned
current out from the ionosphere at the front. This struc-ture was consistent with the ground-based equivalent current pattern and possible field-aligned current location. These ob-servations confirm that the localized enhanced convection in the magnetosphere and the associated changes in the
cur-rent sheet structure produce consistent ionospheric signa-tures with the similar temporal and spatial scale size at the conjugate region. This example also shows the strength and importance of the inversion technique to identify the iono-spheric 3-D currents related to the localized signatures in the tail, because otherwise, one would have missed the signa-tures in the ionosphere for this very localized and weak event.
Acknowledgements. We thank W. Baumjohann, M. Kubyshkina,
and V. A. Sergeev for helpful discussions and comments. The
authors are grateful to H. Eichelberger, G. Laky, C. Mouikis for helping in the Cluster data analysis, and T. Nagai for providing
Geotail data. We acknowledge CDAWeb, and GSC, WDC-C2,
CSDS, GCDC, ACDC for making available data used in this study. The work of O. Amm was supported by the Academy of Finland. N. C. Draper was funded by a University of Leicester postgrad-uate studentship. A. Grocott was supported by PPARC grant no. PPA/G/O/2003/00013. The 1 September 2002, event was identified as one of the Cluster-Ground-based conjunction event in the Cluster Tail Workshop 2003, Graz.
The Editor in chief thanks P. Newell and T. Nagai for their help in evaluating this paper.
References
Amm, O.: Ionospheric elementary current systems in spherical co-ordinates and their application, J. Geomagn. Geoelectr., 49, 947– 955, 1997.
Amm, O. and Viljanen, A.: Ionospheric disturbance magnetic field continuation from the ground to the ionosphere using spherical elementary current systems, Earth, Planets and Space, 51, 431– 440, 1999.
Amm, O., A. Pajunp¨aa, and U. Brandstr¨om,: Spatial distribution of conductances and currents associated with a north-south auro-ral form during a multiple-substorm period, Ann. Geophys., 17, 1385–1396, 1999,
SRef-ID: 1432-0576/ag/1999-17-1385.
Amm, O.: and K. Kauristie, Ionospheric signatures of bursty bulk flows, Surv. Geophys., 23, 1–32, 2002.
Angelopoulos, V., W. Baumjohann, C. F. Kennel, F. V. Coroniti, M. G. Kivelson, R. Pellat, R. J. Walker, H. Luehr, and G. Paschmann: Bursty bulk flows in the inner central plasma sheet, J. Geophys. Res., 97, 4027–4039, 1992.
Angelopoulos, V., et al.: Magnetotail flow bursts, Association to global magnetospheric circulation, relationship to ionospheric activity and direct evidence for localization, Geophys. Res. Lett., 24, 2271–2274, 1997.
Balogh, A., Carr, C. M., Acu˜na, M. H., Dunlop, M. W., Beek, T. J., Brown, P., Fornacon, H., Georgescu, E., Glassmeier, K.-H., Harris, J., Musmann, G., Oddy, T., and Schwingenschuh, K.: The Cluster magnetic field investigation: overview of in-flight performance and initial results, Ann. Geophys., 19, 1207–1217, 2001,
SRef-ID: 1432-0576/ag/2001-19-1207.
Baumjohann, W., Paschmann, G., and Luehr, H.: Characteristics of high-speed ion flows in the plasma sheet, J. Geophys. Res., 95, 3801–3809, 1990.
Birn, J. and Hesse, M.: Details of current disruption and diversion in simulations of magnetotail dynamics, J. Geophys. Res., 101, 15 345–15 358, 1996.
Birn, J., Hesse, M., Haerendel, G., Baumjohann, W., and Shiokawa, K.: Flow braking and the substorm current wedge, J. Geophys. Res., 104, 19 895–19 904, 1999.
Birn, J., Raeder, J., Wang, Y. L., Wolf, R. A., and Hesse, M.: On the propagation of bubbles in the geomagnetic tail, Ann. Geophys., 22, 1773–1786, 2004,
SRef-ID: 1432-0576/ag/2004-22-1773.
Chen, C. X. and Wolf, R. A.: Interpretation of high-speed flows in the plasma sheet, J. Geophys. Res., 98, 21 409–21 419, 1993. Chen, C. X. and Wolf, R. A.: Theory of thin-filament motion in
Earth’s magnetotail and its application to bursty bulk flows, J. Geophys. Res., 104, 14 613–14 626, 1999.
Chen, C. X., Cai, X., Zhang, J. H., and Xiao, Y. D.: Ground mag-netic field disturbane caused by the Hall current of bubbles in the Earth’s magnetosphere, Chinese J. Geophys., 47, 207–211, 2004. Draper, N. C., Lester, M., Wild, J. A., Milan, S. E., Provan, G., Gro-cott, A., Cowley, S. W. H., Bogdanova, Y., Dewhurst, J. P., Faza-kerley, A. N., Davies, J. A., and Bosqued, J.-M.: A joint Cluster and ground-based instruments study of two magnetospheric sub-storm events on 1st September 2002, Ann. Geophys., 22, 4217– 4228, 2004,
SRef-ID: 1432-0576/ag/2004-22-4217.
Fairfield, D. H., Mukai, T., Brittnacher, M., Reeves, G. D., Kokubun, S., Parks, G. K., Nagai, T., Matsumoto, H., Hashimoto, K., Gurnett, D. A., and Yamamoto, T.: Earthward flow bursts in the inner magnetotail and their relation to auroral brightenings, AKR intensifications, geosynchronous particle in-jections and magnetic activity, J. Geophys. Res., 104, 355–370, 1999.
Grocott, A., Yeoman, T. K., Nakamura, R., Cowley, S. W. H., Frey, H. U., R`eme, H., and Klecker, B.: Multi-instrument observations of the ionospheric counterpart of a bursty bulk flow in the near-Earth plasma sheet, Ann. Geophys., 22, 1061–1075, 2004. Gustafsson, G., M. Andr´e, Carozzi, T., Eriksson, A. I.,
Fltham-mar, C. G., Grard, R., Holmgren, G., Holtet, J. A., Ivchenko, N., Karlsson, T., Khotyaintsev, Y., Klimov, S., Laakso, H., Lindqvist, P. A., Lybekk, B., Marklund, G., Mozer, F., Mur-sula, K., Pedersen, P., Popielawska, B., Savin, S., Stasiewicz, K., Tanskanen, P., Vaivads, A., and Wahlund, J. E.: First results of electric field and density observations by CLUSTER EFW based on initial months of operation, Ann. Geophys., 19, 1219–1240, 2001,
SRef-ID: 1432-0576/ag/2001-19-1219.
Kauristie, K., Sergeev, V. A., Kubyshkina, M., Pulkkinen, T. I., An-gelopoulos, V., Phan, T., Lin, R. P., and Slavin, J. A.: Ionospheric current signatures of transient plasma sheet flows, J. Geophys. Res., 105, 10 677–10 690, 2000.
Kokubun, S., Yamamoto, T., Acuna, M. H., Hayashi, K., Shiokawa, K., and Kawano, H.: The Geotail magnetic field experiment, J. Geomagn. Geoelectr., 46, 7–22, 1994.
Kubyshkina, M. V., Sergeev, V. A., and Pulkkinen, T. I.: Hybrid Input Algorithm: An event-oriented magnetospheric model, J. Geophys. Res., 104, 24 977–24 994, 1999.
Nakamura, R., Baumjohann, W., Sch¨odel, R., Brittnacher, M., Sergeev, V. A., Kubyshkina, M., Mukai, T., Liou, K.: Earthward Flow Bursts, Auroral Streamers, and Small Expansions, J. Geo-phys. Res., 106, 10 791–10 802, 2001.
Nakamura, R., Baumjohann, W., Klecker, B., Bogdanova, Y., Balogh, A., Reme, H., Bosqued, J.-M., Dandouras, I., Sauvaud, J.-A., Glassmeier, K.-H., Kistler, L., Mouikis, C., Zhang, T. L., Eichelberger, H., and Runov, A.: Motion of the dipolarization front during a flow burst event observed by Cluster, Geophys. Res. Lett., 29, 1942, doi:10.1029/2002GL015763, 2002. Nakamura, R., Baumjohann, W., Mouikis, C., Kistler, L. M., Runov,
A., Volwerk, M., Asano, Y., Voeroes, Z., Zhang, T. L., Klecker, B., Reme, H., and Balogh, A.: Spatial scale of high-speed flows in the plasma sheet observed by Cluster, Geophys. Res. Lett., 31, L09804, doi:10.1029/2004GL019558, 2004.
R`eme, H., Aoustin, C., and Bosqued, J. M. et al.: First multispace-craft ion measurements in and near the Earth’s magnetosphere with the identical Cluster ion spectrometry (CIS) experiment, Ann. Geophys., 19, 1303–1354, 2001.
Sergeev, V. A., Angelopoulos, V., Gosling, J. T., Cattell, C. A., and Russell, C. T.: Detection of localized, plasma-depleted flux tubes or bubbles in the midtail plasma sheet, J. Geophys. Res., 101, 10 81710 826, 1996.
Sergeev, V. A., Liou, K., Meng, C.-I., Newell, P. T., Brittnacher, M., Parks, G., and Reeves, G. D.: Development of auroral stream-ers in association with localized impulsive injections to the inner magnetotail, Geophys. Res. Lett., 26, 417–420, 1999.
Sonnerup, B. U. ¨O. and Scheible, M.: Minimum and maximum
variance analysis, in Analysis Methods for Multi-Spacecraft Data, ed. G. Paschmann and P. W. Daly, 185, ESA Publications Division, Noordwijk, 185–220, 1998.
Tsyganenko, N. A.: A magnetospheric magnetic field model with a warped tail current sheet, Planet. Space Sci., 37, 5–20, 1989. Vanham¨aki, H., Amm, O., and Viljanen, A.: 1-dimensional
up-ward continuation of the ground magnetic field disturbance us-ing spherical elementary current systems, Earth Planets Space, 55, 613–625, 2003.
Zesta, E., Lyons, L. R., and Donovan, E.: The auroral signature of earthward flow bursts observed in the magnetotail, Geophys. Res. Lett., 27, 3241–3244, 2000.