HAL Id: hal-00745666
https://hal.inria.fr/hal-00745666
Submitted on 26 Oct 2012
HAL is a multi-disciplinary open access
archive for the deposit and dissemination of
sci-entific research documents, whether they are
pub-lished or not. The documents may come from
teaching and research institutions in France or
abroad, or from public or private research centers.
L’archive ouverte pluridisciplinaire HAL, est
destinée au dépôt et à la diffusion de documents
scientifiques de niveau recherche, publiés ou non,
émanant des établissements d’enseignement et de
recherche français ou étrangers, des laboratoires
publics ou privés.
Incremental Spectral Clustering with the Normalised
Laplacian
Charanpal Dhanjal, Romaric Gaudel, Stéphan Clémençon
To cite this version:
Charanpal Dhanjal, Romaric Gaudel, Stéphan Clémençon. Incremental Spectral Clustering with the
Normalised Laplacian. DISCML - 3rd NIPS Workshop on Discrete Optimization in Machine Learning
- 2011, Dec 2011, Sierra Nevada, Spain. �hal-00745666�
Incremental Spectral Clustering with the Normalised
Laplacian
Charanpal Dhanjal
LTCI (UMR 5141, Télécom ParisTech/CNRS) 46 rue Barrault F-75634 Paris Cedex 13, France [email protected]
Romaric Gaudel
LIFL (UMR 8022, univ. Lille/CNRS) & INRIA Lille Nord-Europe Université de Lille – F-59653 Villeneuve d’Ascq Cedex, France
Stéphan Clémençon
LTCI (UMR 5141, Télécom ParisTech/CNRS) 46 rue Barrault F-75634 Paris Cedex 13, France
Abstract
Partitioning a graph into groups of vertices such that those within each group are more densely connected than vertices assigned to different groups, known as
graph clustering, is often used to gain insight into the organization of large scale networks and for visualization purposes. Whereas a large number of dedicated techniques have been recently proposed for static graphs, the design of on-line graph clustering methods tailored for evolving networks is a challenging problem, and much less documented in the literature. Motivated by the broad variety of applications concerned, ranging from the study of biological networks to graphs of scientific references through to the exploration of communications networks such as the World Wide Web, it is the main purpose of this paper to introduce a novel, computationally efficient, approach to graph clustering in the evolutionary context. Namely, the method promoted in this article is an incremental eigenvalue solution for the spectral clustering method described by Ng. et al. (2001). Be-yond a precise description of its practical implementation and an evaluation of its complexity, its performance is illustrated through numerical experiments, based on datasets modelling the evolution of a HIV epidemic and the purchase history graph of an e-commerce website.
1
Introduction
Graph-mininghas recently received increasing attention in the machine-learning literature, moti-vated by application domains such as the Internet, social networks, epidemics of transmissible in-fectious diseases, sensor and biological networks. A crucial task in exploratory analysis and data visualization is graph clustering [1, 2], which aims to partition the vertices in a graph into groups or clusters, with dense internal connections and few connections between each other. There is a large body of work on graph clustering. A possible approach is to consider a certain measure that quan-tifies community structure and formulate the clustering issue as an optimization problem (which is generally NP-hard), for which fairly good solutions can be obtained recursively or by using
ade-quate metaheuristics, see [3, 4, 5, 6] for example. In this paper, focus is on the spectral clustering approach [7], which performs well empirically, is often simple to implement and benefits computa-tionally from fast linear algebra libraries. The general principle of spectral clustering is to compute the smallest eigenvectors of some particular matrix L (refer to Section 2 for further details) and then cluster the vertices based on their representation in the corresponding eigen-space. The popularity of this approach arises from the fact that the obtained clustering of vertices is closely connected to the spectral relaxation of the minimization of the normalized cut criterion, see [8].
In many applications such as communications networks (e.g. the Web and Internet), biological net-works (of proteins, metabolic reactions, etc.), social netnet-works or netnet-works of scientific citations for instance, the graphs of interest slowly change with time. A naive approach to this incremental problem is to cluster each graph in the sequence separately, however this is computationally
expen-sive for spectral clustering as the cost of solving the eigenvalue problem is O(n3) at each iteration,
where n is the number of vertices. There has been some previous work on the incremental spec-tral clustering problem, for example [9, 10, 11] however only [10, 11] update the eigen-system. In this paper we propose an efficient method for clustering a sequence of graphs which leverages the eigen-decomposition and the clustering on the previous graph to find the new clustering. Firstly,
a fast approximation of a rank-k eigen-decomposition of Lt+1knowing that of Ltis derived from
the Singular Value Decomposition (SVD) updating approach used for Latent Semantic Indexing in [12]. Here, the update is efficient to compute when the change (that will be described more precisely
in the subsequent analysis) between Ltand Lt+1is a low-rank matrix. Secondly the clustering of
vertices is updated accordingly to the new eigen-space. The efficiency of the complete approach, in term of clustering accuracy, is demonstrated on real data.
The paper is organised as follows. A Laplacian-based graph clustering approach is recalled in Sec-tion 2. Then SecSec-tion 3 details the proposed eigen-decomposiSec-tion update and SecSec-tion 4 describes its use in the framework of spectral clustering. Numerical results are gathered in Section 5, and the paper ends with Section 6 discussing results and planned future work.
Notation: A bold uppercase letter represents a matrix, e.g. X, and a column vector is displayed
using a bold lowercase letter, e. g. x. The transpose of a matrix or vector is written XT. The
concatenation of the columns of two matrices A and B is written[A B].
2
Laplacian Based Graph Clustering
Consider an undirected graph G = (V, E), composed of a set of vertices {v1, . . . , vn} = V and
edges E ⊆ V × V such that for every edge (vi, vj) there is also an edge (vj, vi). One way of
representing the edges of G is using an adjacency matrix A which has Aij = 1 if there is an edge
from the i-th to the j-th vertex otherwise Aij = 0. More generally, the weight matrix W allows one
to assign nonzero numerical values on edges, and thus Wij6= 0 when there is an edge from the i-th
to the j-th vertex.
In the perspective of spectral clustering, a useful way of representing G is through its Laplacian matrix [13]. There are several definitions of the Laplacian matrix, however we are interested in the
normalised Laplacian matrix, which is symmetric and positive semi-definite:
Definition 2.1. The unnormalised Laplacian matrix of a graph G is defined as L= D − W where D
is the degree matrix with diagonal entries Dii= deg(vi), denoting by deg(vi) =PjWijthe degree of the i-th vertex, and zeros elsewhere, and W is the weight matrix. The normalised Laplacian matrix of a graph G is then defined as ˜L= D−1
2LD−1
2.
The normalised Laplacian matrix is used in the spectral clustering approach of Ng et al. [14]. The algorithm computes the Laplacian and then finds the k smallest eigenvectors which form the columns of a matrix V. This matrix is then normalised so that its rows have unit norm, which are then clustered with the k-means algorithm. In general the Laplacian matrix is often sparse and one can use power or Krylov subspace methods such as the Lanczos method to find the eigenvectors. There are several variants of this algorithm, such as that of [8] which uses the so-called random walk Laplacian and clusters the smallest eigenvectors in a similar way. One of the motivations for these clustering methods is from the spectral relaxation of the minimisation of the normalised cut criterion.
A naive approach to spectral clustering on a sequence of graphs has a large update cost due to the
computation of the eigen-decomposition of ˜Ltat each iteration t. A more efficient approach is to
up-date relevant eigenvectors from one iteration to the next. In [9] the authors use the spectral clustering of [14] however they do not update the eigenvectors incrementally but instead the clustering directly. The iterative clustering approach of Ning et al. [10, 11] uses the spectral clustering method given in [8] and updates eigenvectors incrementally. The algorithm incrementally updates the generalised
eigenproblem Lv = λDv by finding the derivatives on the eigenvalues/vectors with perturbations
in all of the quantities involved. An iterative refinement algorithm is given for the eigenvalues and eigenvectors given a change in the edges or vertices of a graph. One then clusters the resulting k smallest eigenvectors using k-means clustering. In order to limit errors which can build up cumula-tively, the authors recompute the eigenvectors after every R-th graph in the sequence.
A disadvantage of the approach of [10, 11] is that to update an eigenvector one must invert a small matrix for each weight change which makes updates costly. The size of this matrix is proportional to the number of neighbours of the vertices incident to the changed edge.
3
Incremental Eigen-approximation
In this section we address the updating problem upon the rank-k eigen-decomposition of a sym-metric matrix, i.e. we are interested only in the largest k eigenvalues/vectors of the corresponding
matrix: (ATA)k+ U, where U = Y1YT2 + Y2YT1 and(A
T
A)kis the rank-k eigen-decomposition
of ATA.1
This update is a general operation, however it will be explained in the context of spectral
clustering later in Section 4. We assume that Y1, Y2∈ Rn×pand one does not have direct access to
A∈ Rm×n
but only the matrice ATA.
To compute this update, we first project the columns of Y1 into the space orthogonal to the
eigenvectors Qk of (A
T
A)k, a process known as deflation. Hence the matrix Y1 is deflated
as follows: ¯Y1 = (I − QkQ
T
k)Y1. Note that ¯Y1Θ1 for some Θ1, is orthogonal to Qk since
QTkY¯1Θ1 = (QTkY1− QkTY1)Θ1 = 0. If we take the SVD ¯Y1 = ¯P1Σ¯1Q¯
T
1 then ¯P1 is
orthog-onal to Qk since ¯P1= ¯Y1Q¯1Σ¯ −T
1 assuming ¯Σ1has nonzero diagonal entries.
At the next stage we would like to orthogonalise the columns of Y2 with respect to both Qk and
¯
P1. Hence we deflate Y2in the following way: ¯Y2 = (I − ¯P1P¯
T
1 − QkQ T
k)Y2where we have used
the fact that ¯P1 is orthogonal to Qk. Proved in a similar way to the step used earlier, the matrix
in the column space of ¯Y2, ¯Y2Θ2for some Θ2, is orthogonal to Qk and ¯P1. Hence, we compute
the SVD ¯Y2 = ¯P2Σ¯2Q¯ T
2 and note that the matrices ¯P1, ¯P2 and Qk are mutually orthogonal and
span the space spanned by(ATA)k + U. This allows one to write (ATA)k+ U = ˜Q∆ ˜Q
T with ˜ Q= [Qk P¯1P¯2] ∈ Rn×(k+2p)and ∆= Ωk+ QTkUQk QTkU¯P1 QTkY1Q¯2Σ¯2 ¯ PT1UQk P¯ T 1U¯P1 Σ¯1Q¯ T 1Q¯2Σ¯2 ¯ Σ2Q¯T2YT1Qk Σ¯2Q¯T2Q¯1Σ¯1 0 ,
where, the above expression of ∆ is simply an expansion of the matrix ˜QT((ATA)k+ U) ˜Q since
˜
Q is a basis of the space occupied by((ATA)k + U). We take the rank-k eigen-decomposition
∆k = HkΠkHTk and then the final eigen-approximation is given by( ˜QHk)Πk( ˜QHk)T.
The deflation and SVD of ¯Y1 and ¯Y2 cost O(npk) and O(np2) respectively and the
eigen-decomposition of ∆ isO((k + 2p)3) as ∆ ∈ R(k+2p)×(k+2p). In order to compute ∆ one can
reuse the computations of QTkY1, QTkY2, ¯P
T
1Y2which are used for deflations and also the matrices
used for the SVD decompositions. Thus ∆ is found inO(p3+ p2k+ pk2), and the overall
com-plexity of this algorithm isO((k2+ p2)(p + k) + np(p + k)). Of note here is that the dimension
n of ATA scales the complexity in a linear fashion, however costs are cubically related to k and p.
1
We have written the update in terms of a symmetric matrix ATA to improve notation. Note that any positive semi-definite symmetric matrix M can be decomposed into the form M = ATA, where A is real, for example by using an eigen-decomposition.
Under the specific circumstances of working with sparse matrices and updating graph clustering this cost is later shown to reduce.
Eigenupdates corresponding to the addition and deletion of rows/columns are a particular case of the considered update, in which some rows/columns have zero values before or after the update. However, these are not detailed due to space limitations.
4
Incremental Cluster Membership
We return to the eigen-problem ˜Lv = λv in which we are interested in the eigenvectors with the
smallest eigenvalues. We define the shifted Laplacian as ˆL= 2I − ˜L = I + D−1
2WD−12, which
is positive semi-definite since ˜L is positive semi-definite with largest eigenvalue2. Since we are
interested in the smallest eigenvectors of ˜L they correspond exactly to the maximum eigenvectors of
ˆ
L and we can use the eigen-update methods described above.
Putting the ingredients together allows us to outline an efficient incremental method for performing graph clustering called Incremental Approximate Spectral Clustering (IASC), see Algorithm 1. At a high level the algorithm is quite simple: at each iteration t one mostly recovers the steps of standard
spectral clustering. In this case, we use the shifted Laplacian matrix ˆLtinstead of the normalised
Laplacian matrix, which does not affect the clustering as both matrices have same eigen-vectors. Furthermore we use the eigen-approximation method above to approximate the largest eigenvectors
of ˆLtusing the eigenvectors computed at the previous iteration, instead of (costly) recomputing the
exact eigen-decomposition at each iteration. Similarly, we initialise k-means with centers at previous
iteration. Finally, we store the first k2eigenvectors of ˆLt, with k2≥ k1, to reduce cumulative errors
introduced in the loop at the expense of increased computation.
Algorithm 1 Incremental Approximate Spectral Clustering using the Normalised Laplacian
Require: Graphs G1, . . . , GT of sizes n1, . . . , nT, no. of clusters k1, matrix approximation rank
k2≥ k1, eigen-decomposition recomputation step R
1: for t= 1 → T do
2: Compute the shifted Laplacian for Gt, ˆLt
3: if i% R == 1 then
4: Compute rank-k2eigen-decomposition of ˆLt, Q
(t) k2Ω (t) k2Q (t) k2 T 5: else
6: Use rank-k2eigen-decomposition of ˆLt−1and approximated eigen-update of Section 3 to
compute rank-k2eigen-decomposition of ˆLt, Q
(t) k2Ω (t) k2Q (t) k2 T 7: end if 8: Let Q(t)k
1 be the matrix of the first k1columns of Q
(t) k2
9: Normalise the rows of Q(t)k1, i.e. Q
(t) k1 ← diag(Q (t) k1(Q (t) k1) T)−1 2Q(t)k 1
10: Use k-means on rows of Q(t)k1, using ct−1to find initial centroids (if not at first iteration), and
store indicators ct∈ {1, . . . , k1}nt
11: end for
12: return Cluster membership vectors c1∈ {1, . . . , k}n1, . . . , cT ∈ {1, . . . , k}nT
The complexity of Algorithm 1 is dictated by the sparsity of the graphs and the extent of the change
between successive graphs in the input sequence. At iteration t and step 2 one can compute ˆLtfrom
the weight and degree matrix at a cost of O(nt+ |Et|). In the following step, if there is a change
between edges incident to vertices S= {vI1, . . . , vIℓ} then the rows and columns corresponding to
the union of the neighbours of S, n(S), will change in the corresponding shifted Laplacian. In this
case p= |n(S)| in Y1, Y2∈ Rn×pand if n(S) is small, this update can be efficiently computed.
5
Computational Results
In this section we compare the clustering quality of: standard spectral clustering (denoted Exact) Ning et al.’s incremental strategy, and IASC. We use the clustering methods on two real datasets.
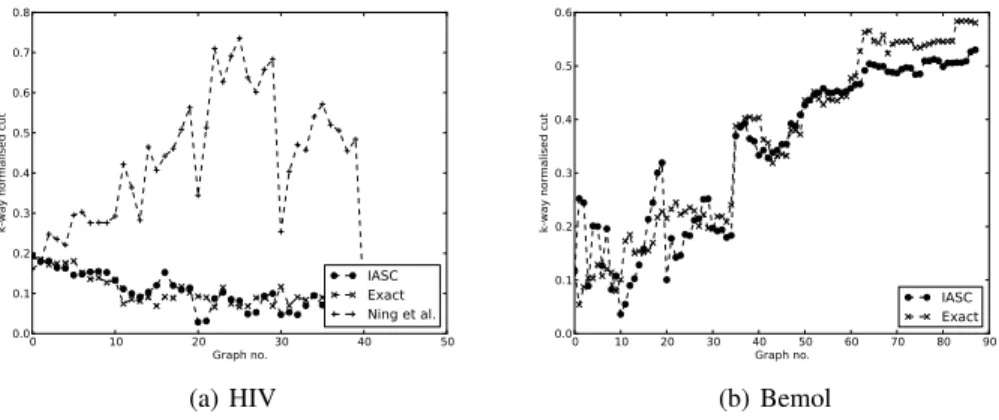
0 10 20Graph no.30 40 50 0.0 0.1 0.2 0.3 0.4 0.5 0.6 0.7 0.8 k-wa y n orma lise d c ut IASC Exact Ning et al. (a) HIV 0 10 20 30 40Graph no.50 60 70 80 90 0.0 0.1 0.2 0.3 0.4 0.5 0.6 k-wa y n orma lise d c ut IASC Exact (b) Bemol
Figure 1: The k-way normalised cuts using the HIV and e-commerce graphs.
The first one represents individuals in Cuba who have been detected as having HIV between 1986 and 2004, see [15] for precise details of the dataset. Edges in the graph represent a sexual contact between two individuals as determined using contact tracing, which is a technique used in epidemi-ology to limit the spread of an infection whereby contacts of an infected person are identified and diagnosed. The full sexual contact graph at the end of 2004 consists of 5389 people however we consider the largest connected component of size 2387. We examine the epidemic graph at 3 month steps and cluster using the 3 approaches starting at the point in which the graph has 500 vertices.
The experiment is run using k1 = 25, k2 = 100 and R = 10 for IASC. For the method of Ning et
al. we also use 25 clusters and recompute exact eigenvectors after every10 iterations. Note that in
our implementation of k-means clustering, k is an upper bound on the number of clusters.
The next dataset was introduced in [16] and corresponds to the purchase history of an e-commerce website over a period of almost two years. The dataset is a bipartite graph between users and product with more than 700,000 users and 1,200,000 products. In the current experiment we focus on the first 5000 users. A graph is constructed between users with edge weights equal to the number of commonly purchased products between two users.
To evaluate the learned clusters we measure the k-way normalised cut, defined as follows:
N = 1 k k X ℓ=1 P ijWijδ(ci, cℓ)(1 − δ(cj, cℓ)) P ijWijδ(ci, cℓ) .
A cut between two clusters A and B is the sum of the weights between the clusters and the nor-malised cut is this sum divided by the sum of the weights of all edges incident to vertices in cluster A. Hence the k-way normalised cut is the mean normalised cut between each cluster and its com-plementary vertices, and the lower it is the better.
Figure 1 shows the k-way normalised cuts for both datasets. In both IASC and the Ning et al. method, since eigenvectors are recomputed every 10 iterations, this manifests itself as sudden changes in the k-way normalised cuts. These changes are more pronounced in the Ning et al. case. Except for the first few iterations, IASC matches or improves results on the exact approach, while keeping only 10% or fewer of the eigenvectors. The Ning et al. approximation leads to cuts worse than those obtained with the exact approach, except for the first few iterations immediately after exact recomputations of the eigenvectors. For the Bemol graphs Ning et al. failed to complete in a reasonable time frame, however on a smaller dataset of 1000 vertices, it resulted in cuts considerably worse than either IASC or the exact spectral approach.
6
Discussion
We have presented a novel incremental method for spectral graph clustering which updates the eigenvectors of the normalised Laplacian in a computationally efficient way. Such an algorithm
is useful for finding clusterings in time evolving graphs such as biological and social networks, and the Internet. We compare our approach empirically to a naive spectral clustering approach which recomputes eigenvectors for each graph, and the method of Ning et al. and demonstrate improvements in the clustering on HIV and product information datasets as well as good cluster stability.
Recall that the approximation error of our proposed approach is kept under control by recomputing the exact eigen-decomposition after every R iterations. One promising extension to this work is to estimate this approximation error. This would would allow one to limit the frequency of this computationally expensive step and offer a way to detect abrupt changes in the evolution of a graph sequence.
References
[1] S.E. Schaeffer. Graph clustering. Computer Science Review, 1(1):27–64, 2007.
[2] S. Fortunato. Community detection in graphs. Physics Reports, 486(3-5):75–174, 2010. [3] M.E.J. Newman and M. Girvan. Finding and evaluating community structure in networks.
Physical review E, 69(2):026113, 2004.
[4] M. E. J. Newman. Fast algorithm for detecting community structure in networks. Physical
Review E, 69(6):066133, Jun 2004.
[5] G.W. Flake, R.E. Tarjan, and K. Tsioutsiouliklis. Graph clustering and minimum cut trees.
Internet Mathematics, 1(4):385–408, 2004.
[6] V. Satuluri and S. Parthasarathy. Scalable graph clustering using stochastic flows: applications to community discovery. In Proceedings of the 15th ACM SIGKDD international conference
on Knowledge discovery and data mining, pages 737–746. ACM, 2009.
[7] U. Von Luxburg. A tutorial on spectral clustering. Statistics and Computing, 17(4):395–416, 2007.
[8] J. Shi and J. Malik. Normalized cuts and image segmentation. Pattern Analysis and Machine
Intelligence, IEEE Transactions on, 22(8):888–905, 2000.
[9] C. Valgren, T. Duckett, and A. Lilienthal. Incremental spectral clustering and its application to topological mapping. In Robotics and Automation, 2007 IEEE International Conference on, pages 4283–4288. IEEE, 2007.
[10] H. Ning, W. Xu, Y. Chi, Y. Gong, and T.S. Huang. Incremental spectral clustering by efficiently updating the eigen-system. Pattern Recognition, 43(1):113–127, 2010.
[11] H. Ning, W. Xu, Y. Chi, Y. Gong, and T. Huang. Incremental spectral clustering with applica-tion to monitoring of evolving blog communities. In SIAM Int. Conf. on Data Mining. Citeseer, 2007.
[12] H. Zha and H.D. Simon. On updating problems in latent semantic indexing. SIAM Journal on
Scientific Computing, 21:782, 1999.
[13] F.R.K. Chung. Spectral graph theory. Amer Mathematical Society, 1997.
[14] A. Ng, M. Jordan, and Y. Weiss. On spectral clustering: Analysis and an algorithm. In
Advances in Neural Information Processing Systems 14: Proceeding of the 2001 Conference, pages 849–856, 2001.
[15] B. Auvert, H. de Arazoza, S. Clémençon, J. Perez, and R. Lounes. The HIV/AIDS epidemic in Cuba: description and tentative explanation of its low HIV prevalence. BMC Infectious
Diseases, 7(30), November 2007.
[16] Emile Richard, Nicolas Baskiotis, Theodoros Evgeniou, and Nicolas Vayatis. Link discovery using graph feature tracking. In J. Lafferty, C. K. I. Williams, J. Shawe-Taylor, R.S. Zemel,
and A. Culotta, editors, Proceedings of the 23rd Annual Conference on Neural Information