A Constitutive Model for the Mechanical
Behavior of Single Crystal Silicon at Elevated
Temperature
H.-S. Moon, L. Anand, and S. M. Spearing
Abstract-- Silicon in single crystal form has been the material of choice for the first demonstration of the MIT microengine project. However, because it has a relatively low melting temperature, silicon is not an ideal material for the intended operational environment of high temperature and stress. In addition, preliminary work indicates that single crystal silicon has a tendency to undergo localized deformation by slip band formation. Thus it is critical to obtain a better understanding of the mechanical behavior of this material at elevated temperatures in order to properly exploit its capabilities as a structural material. Creep tests in simple compression with n-type single crystal silicon, with low initial dislocation density, were conducted over a temperature range of 900 K to 1200 K and a stress range of 10 MPa to 120 MPa. The compression specimens were machined such that the multi-slip <100> or <111> orientations were coincident with the compression axis. The creep tests reveal that response can be delineated into two broad regimes: (a) in the first regime rapid dislocation multiplication is responsible for accelerating creep rates, and (b) in the second regime an increasing resistance to dislocation motion is responsible for the decelerating creep rates, as is typically observed for creep in metals. An isotropic elasto-viscoplastic constitutive model that accounts for these two mechanisms has been developed in support of the design of the high temperature turbine structure of the MIT microengine.
Index Terms—single crystal silicon, constitutive model, finite element analysis, microengine.
I. INTRODUCTION
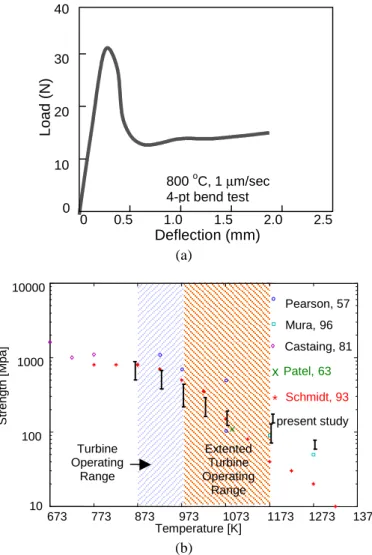
The design of the MIT microengine is limited in part by the capabilities of Si as a structural material at temperatures higher than its brittle-to-ductile transition temperature (BDT), 900 K. Fig. 1 illustrates the thermal-softening and strain-softening of Si. In order to circumvent this limitation, it has been proposed to reinforce the Si with CVD SiC in strategic locations to create a Si/SiC hybrid microengine turbine spool. The feasibility of this hybrid turbine spool design has been investigated by a series of finite element analyses involving primitive material models [1, 2, 3]. While this has confirmed the potential of the Si/SiC hybrid microturbine structure for improving engine efficiency, as well as maintaining structural integrity, the thermomechanical structural analyses conducted thus far have not addressed the following three specific questions:
1) Can the upper yield strength of Si be relied on in designing a part that is to be in service at temperatures higher than the BDT?
2) Can the admissible operating conditions and service life of a part be reliably estimated?
3) Will stress concentrations, such as fillet radii, be susceptible to localized creep/plasticity deformation?
An isotropic elasto-viscoplastic constitutive model for the deformation of single crystal Si in multi-slip <100> and <111> orientations is presented in the following section. The next section shows a calibration of the model against our compression creep experiments in order to determine the material parameters appearing in the model. The calibrated model is then used to predict the response of silicon in 4-point bending at an elevated temperature. This paper concludes with remarks on possible additional improvements to the model, as well as its usefulness as a design tool.
II. BACKGROUND
In the range of 0.5 to 0.8 homologous temperatures, single crystal Si, initially having a small grown-in dislocation density on the order of 106 to 107 #/m2, deforms fairly elastically until yielding with a noticeable peak in the stress-deformation response as shown in Fig. 1. Once it begins to deform plastically, facilitated by the number of dislocations that rapidly increases by the multiplication mechanisms such as a Frank-Read sources, Si softens with the increase of strain. In other words, the lattice resistance to the movement of dislocations, which defines the macroscopic material strength, decreases with the increase of the dislocation density. This rapid multiplication of dislocations is also responsible for the initial accelerating primary, or incubation creep stage of single crystal Si. The infrared photomicrographs shown in Fig. 2 illustrate the dislocations formed within a Si crystal in its early creep stages and a multiplication mechanism, a Frank-Read source. The plastic flow favored by the fast dislocation multiplication in diamond-structured materials was investigated by many researchers, including Hassen and co-workers [4, 5].
(a)
(b)
Figure 1. (a) Upper yield strength of Si as a function of temperature. (b) 4-point bending test result at 800 °C and 1 mm/sec ram speed. [Chen, K-S., Ph. D. Thesis, Dept. of Mechanical Engineering, MIT, Cambridge, MA, 1999] As the Si crystal deforms further, the influence of interactions of dislocations becomes important. The increase of the dislocation density, to the extent of forming subgrain structures, leads to a deformation mechanism where the thermally-activated deformation theory operates, as is often observed in metals at elevated temperature. Myshlyaev and co-workers accounted for the activation energy as being about equal to that for self-diffusion and a high stress dependence of Si in this deformation regime [6, 7]. The TEM micrographs in Fig. 2 show the subgrain structures formed within Si, which in turn implies the high interaction of dislocations during the deformation.
III. CONSTITUTIVE EQUATIONS
We outline below an elasto-viscoplastic constitutive model the deformation of single crystal Si, initially containing a low density dislocations in the multi-slip <100> and <111> orientations, at homologous temperatures of 0.5 to 0.8 based on the deformation mechanisms described above.
(a)
(b)
Figure 2. (a) Infrared microphoto of deformed Si. Dislocations and trails decorated with Cu. [W. C. Dash, J. Appl. Phys. 29, 705 (1985)]. (b) TEM micrograph of cell structure during decelerated strain stage, revealed by chemical etching. . [M. M. Myshlyaev, et al., Dislocation Structure and Macroscopic Characteristics of Plastic Deformation at Creep of Silicon Crystals, Phys. Stat. Sol., Vol. 36, 1969]
The constitutive model employs two scalar internal variables: a mobile dislocation density, ρm, , taken equal to the total dislocation density, ρm = ρ, whichgoverns the magnitude of the plastic shearing rate in the initial stages of deformation where the dislocation density is rapidly multiplying, and an isotropic resistance to plastic flow, s, which has dimensions of stress, and represents (in a collective sense) the resistance to plastic flow offered by the dislocation substructure in the later stages of deformation after a sufficiently large mobile dislocation density has been generated. The transition between the two deformation regimes takes place at a certain critical dislocation density, above which the material history cannot be described by a single measure of the dislocation density but by the high degrees of interactions among dislocations. This critical dislocation density appears to be a function of only the effective shear stress. The frame-work of our Deflection (mm) 40 30 20 10 0 0.5 1.0 1.5 2.0 2.5 0 Load ( N ) 800 oC, 1 µm/sec 4-pt bend test 673 773 873 973 1073 1173 1273 1373 10 100 1000 10000 Temperature [K] x Patel,63 * Schmidt, 93 Pearson, 57 Mura,96 Castaing, 81 S trengt h [ M pa] present study Turbine Operating Range Extented Turbine Operating Range
constitutive model is based on the previous work by Anand and co-workers [e.g., 8, 9].
The governing variables in this constitutive model are:
)
,
,
,
,
,
(
T
F
F
pθ
ρ
s
, (1)where
T
is the Cauchy stress,F
is the deformationgradient tensor,
F
pis the plastic deformation gradient tensor, θ is the absolute temperature in Kelvin, ρ is the dislocation density, and s is the isotropic slip resistance. The basic constitutive equation for Si is given by the following linear relation:] ) ( [E 0 1 T= −
α
Tθ
−θ
e C , (2)where
T
is the symmetric second Piola-Kirchoff stress tensor,E
eis the strain tensor defined by the Green elastic strain measure, which in turn is set equal to the logarithmic strain, C is a fourth-order isotropic elasticity tensor, and1
T
α
is the second-order isotropic thermal expansiontensor, and θ and θ0 are the absolute temperature and a reference temperature, respectively. The evolution equation of the plastic deformation is given by
p p p
F
D
F
&
=
, (3) withτ
γ
2
'T
D
p=
&
p , (4)where
T
' is the deviatoric part ofT
,τ
=
21T
'⋅
T
'is the equivalent shear stress, and
γ
&
pis the equivalent plastic shear strain rate.A. regime 1
(
ρ ≤
ρ
crit)
This regime has been extensively investigated by many researchers, including Hassen and co-workers [4, 5], and an isotropic constitutive model has been previously proposed by Dillon and co-workers [12]. The plastic strain rate produced by a crystal is, in general, determined by the Orowan equation [10], v b m p ρ γ =& , (5)
where ρm is the mobile length of dislocations per cubic centimeter, b is the Burgers vector magnitude, and
v
is the average velocity of these dislocations. For small deformation, the mobile dislocation ρm can be replaced with the total dislocation density ρ. They found that a statistical arrangement of the dislocations produces a mean internal stress ,,
ρ
αµ
τ
i=
b
(6)where µ is a shear modulus and α is a constant. They also found that it is an effective stress, the difference between the internal stress and the applied stress, i.e.:
i
eff
τ
τ
τ
= − , (7)that determines the dislocation velocity and the
multiplication rate. Combining the Orowan equation and the dislocation multiplication law (which states that the
multiplication of moving dislocations occurs in proportion to their moving length and the distance traveled or dρ =
ρ⋅v⋅dt⋅δ, where δ is the multiplication parameter) yields the multiplication rate as
eff
K
τ
δ =
, (8)with K is a multiplication rate constant.
Then, in regime 1, the plastic shear strain rate as taken as
(
)
(
)
( )
− = τ τ τ θ ρ γ sign k Q bv eff m p / 1 0 0exp / / 0 & 0 0 > ≤ eff eff if if τ τ (9) where v0 is a reference value for the dislocation velocity, Qis an activation energy, k denotes the Boltzmann’s constant, τ0 is a reference stress and m is a strain rate sensitivity parameter.
The evolution equation for the dislocation density in regime 1 is taken as
p
h
γ
ρ
&= & , effb K h
τ
= . (10) B. regime 2 (ρ >ρcrit)In this regime the previous work of Myshlyaev and his co-workers [6, 7] is important. They showed that over a wide range temperatures and stresses (900 °C to 1300 °C and 20 to 150 MPa) the steady creep rate may be represented by
− ∆ − = ∆− = θ σ γ θ γ γ k V F k G p exp exp 0 * 0 & & & , (11)
where ∆G* is the activation free enthalpy or the Gibb’s free energy for activation, ∆F is the activation free energy required to overcome the obstacles to slip without the aid of an applied shear stress, and V is the activation volume. This kinetic equation can be rearranged as
−
∆
−
=
s
k
F
pτ
θ
γ
γ
&
&
0exp
1
(12)with the isotropic shear resistance s = ∆F/V, which is now a specific form of the suggestion by Kocks et al. [11],
− ∆ − = q p p s k F
τ
θ
γ
γ
& &0exp 1(13) with p = 1 and q = 1. Here
γ
&
0is a reference shearing rate and s is a constant slip resistance.To allow for both primary and steady-state creep we allow s to vary and adopt the following simple evolution equation for the slip resistance s:
p
h
s
&
=
γ
&
,
−
=
*
1
0s
s
h
h
’ (14)where h0 and s* are additional non-zero positive-valued
C. Transition between two regimes
A simple criterion for the transition between regimes 1 and 2 is that as long as the dislocation density is less than a critical value then the flow and evolution equations for regime 1 are operative, and regime 2 becomes operative as soon as the dislocation density reaches the critical value. The critical value
ρ
crit is taken to be a power-law function of the equivalent shear stress:
>
=
)
1
(
0 0 0 0ρ
ρ
τ
τ
ρ
ρ
crit n critA
0 0 crit crit if ifρ
ρ
ρ
ρ
< ≥ (15) Here, the parameter ρcrit0 is set to be somewhat greater than the initial dislocation density ρ0 so that the inequality condition does not fail at the first root. Further, in order to guarantee the smooth transition between the two regimes, the plastic shear strain rates for each regime should be the same when the transition. By equating these two plastic shear strain rates for each regime at the transition, i.e.,2
1 pregime
regime
p
γ
γ
&
=
&
at (ρ =ρcrit). (16)the shear resistance, s, can be initialized for the Myshlyaev regime as follows: F k s crit Hassen p ∆ + = =
θ
γ
γ
τ
ρ ρ 02 0 log 1 & & . (17)IV. MODEL CALIBRATION & VERIFICATION
The constitutive model has been implemented by writing a subroutine VUMAT for a commercial finite element
program, ABAQUS EXPLICITTM. The material
parameters in the model have been calibrated using compression creep experiments on Si performed at MIT and also those reported in the literature [6, 12]. The material parameters in the model can be classified into three groups based on what they do: material parameters for regime 1, which govern the initial accelerating creep or incubation stage and strain softening, regime 2 material parameters, which determine the transition of the primary and the secondary creep and strain-hardening, and the transition parameters. These three material parameter groups are somewhat independent of each other. In the model calibration, finite element calculations using
ABAQUS/EXPLICITTM are performed for simple
compression with a single ABAQUS-C3D8R element, a reduced order three-dimensional continuum element, subjected to the appropriate load and temperature. The material parameters were fitted to the experimental results through this finite element calculation. The calibrated material parameters for the model are given in Table 1. Fig. 3 shows the calibration at two different temperatures, 600 °C and 800 °C; the fit is reasonably satisfactory. At low temperatures the model can predict the observed incubation creep stage. At high temperatures, the
incubation creep stage almost is negligibly small, and the model can be satisfactorily fit to the primary and secondary creep regimes. 0 100 200 300 400 500 600 0 0.005 0.01 0.015 0.02 0.025 0.03 0.035 0.04 TIME [min] C R EE P ST R A IN ε c SOLID: MODEL DOTTED: EXPERIMENT 120 MPa 100 MPa 80 MPa 60 MPa (a) 0 100 200 300 400 500 600 0 0.005 0.01 0.015 0.02 0.025 0.03 0.035 0.04 TIME [min] C R EE P ST R A IN ε c 80 MPa 60 MPa 40 MPa 20 MPa SOLID: MODEL DOTTED: EXPERIMENT (b)
Figure 3. Calibration results of the Si model fitted against the experimental creep data. (a) 600 °C and (b) 800 °C.
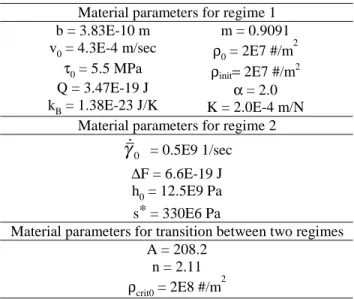
Table 1. Calibrated material parameters for the model Material parameters for regime 1
b = 3.83E-10 m v0 = 4.3E-4 m/sec τ0 = 5.5 MPa Q = 3.47E-19 J kB = 1.38E-23 J/K m = 0.9091 ρ0 = 2E7 #/m2 ρinit= 2E7 #/m2 α = 2.0 K = 2.0E-4 m/N Material parameters for regime 2
0
γ
&
= 0.5E9 1/sec∆F = 6.6E-19 J h0 = 12.5E9 Pa s* = 330E6 Pa
Material parameters for transition between two regimes A = 208.2
n = 2.11
ρcrit0 = 2E8 #/m 2
The responses of the model to a monotonic loading have been investigated further. Using the same finite element mesh, the uniaxial compression testing was simulated for a series of loading conditions with various temperatures, strain rates, and the grown-in dislocation densities. Fig. 4 illustrates the qualitative behaviors of this model for the response to a dynamic loading. The compression testing of Si, when performed with a constant strain rate, is characterized by a pronounced upper yield strength followed by strain-softening, an easy glide region, and strain-hardening similar to that for metals [13]. As supported by the experimental results in the literature [14, 15], the upper yield strength increases with the decrease of temperature, the increase of strain rate, and the decrease of the grown-in dislocation density. Moreover, the strain-hardening curves after an easy glide region appear to converge somewhat. With the dislocation density in the crystal increased enough to yield high interactions of dislocations, the deformation mechanism becomes less sensitive to the changes in temperatures, strain rate, and rather obviously, the dislocation density.
0 0.002 0.004 0.006 0.008 0.01 0.012 0.014 0.016 0.018 0 50 100 150 200 250 300 350 400 STRAIN ST R ESS [ M P a ] 900 oC 850 oC 800 oC 750 oC (a) 0 0.005 0.01 0.015 0.02 0.025 0 100 200 300 400 500 600 STRAIN ST R E SS [ M Pa ] -1.2E-4 sec-1 -2.4E-4 sec-1 -4.8E-4 sec-1 -9.6E-4 sec-1 (b) 0 0.005 0.01 0.015 0.02 0.025 0 50 100 150 200 250 300 350 400 STRAIN ST R E S S [ M Pa ] 2E6 #/cm2 2E7 #/cm2 2E8 #/cm2 2E9 #/cm2 (c)
Figure 4, Characteristics of the model in the response to a dynamic loading for uniaxial compression testing: (a) Temperature dependence, (b) strain rate dependence, and (c) the dependence of the grown-in dislocation density in the crystal.
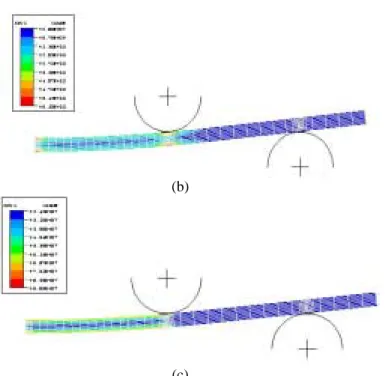
The predictive capabilities of the model were verified by comparing the load deflection response of Si in 4-point bending at 800 °C. A Si flexural specimen with dimensions of 1 mm thick, 8.8 mm wide, and 50 mm long was modeled with ABAQUS-CPE4R elements as shown in Fig. 5 (a). Both the inner and the outer roller, modeled with rigid surfaces, form a frictional interface with the Si specimen. While the inner roller is held fixed, the outer roller moves upwards at a speed of 1 µm/sec. Fig. 5 (b) and (c) show the dislocation density distribution of the specimen and the shear resistance distribution, respectively. Fig. 6 shows a comparison of the load predicted by the finite element analysis versus the experimental result. While it satisfactorily predicts the peak load followed by softening, the finite element calculation deviates from the experiment at larger deflections. It is possible that the actual experiment shows a softer response because the rollers can move laterally during bending, while in the simulation they cannot. However, a careful examination shows that this problem may also be related to the progress of the localized deformation that relieves the stress in the Si flexural specimen. This problem may call for a complete crystal plasticity formulation for the Si constitutive model that enables the improved prediction of localized deformations under the rollers.
(a)
ε
&
= -2.4E-4 sec-1ρinit = 2E7 #/cm 2
T = 800 °C
ρinit = 2E7 #/cm2
ε
&
= -2.4E-4 sec-1 T = 800 °C(b)
(c)
Figure 5. (a) Finite element mesh for a 4-point bending test with the undeformed in dashed lines and the deformed in solid lines(b) dislocation density distribution, (c) isotropic shear resistance distribution. Experiments performed at 800
°C with the ram speed of 1µm/sec.
0 0.1 0.2 0.3 0.4 0.5 0.6 0.7 0.8 0.9 1 0 5 10 15 20 25 30 35 CROSSHEAD DISPLACEMENT [mm] L O AD [N ] , µ EXPERIMENT FEM
Figure 6. Comparison of the finite element prediction of the load as a function of the crosshead displacement predicted for a 4-point bending test against the experimental result.
V. SUMMARY
An isotropic constitutive model for the elasto-viscoplastic deformation of single crystal Si, with low initial grown-in dislocation density, deforming under multi-slip conditions at elevated temperatures has been developed. The model
has been implemented in ABAQUS/ EXPLICITTM, and
calibrated to fit our data from creep experiments. While it is versatile in predicting various aspects of the mechanical behavior of Si at high temperatures, this model may not be effective when localized deformations dictate the overall
structural response. More elaborate crystal plasticity formulations may provide a more reliable solution for this problem, but only at a substantial computational cost.
ACKNOWLEDGEMENTS
The financial support for this work was provided by ARO MURI under contract #DAAG55-98-1-0292.
REFERENCES
1. ABAQUS Reference Manuals, 2001, Providence, RI.
2. D. S. Walters, S. M. Spearing, On the flexural creep of single-crystal silicon, Scripta mater. Vol. 42, No. 8, 769-774, 2000.
3. Chen, K-S., Ph. D. Thesis, Dept. of Mechanical Engineering, MIT, Cambridge, MA, 1999.
4. H. Alexander, P. Hassen, Dislocation and plastic flow in the diamond structure, Solid State Physics, pp 27-158, 1968.
5. H. Alexander, Dislocations in covalent crystals, in Dislocations in solids, Vol. 7. ed. F. R. N.
6. M. M. Myshlyaev, V. I. Nikitenko, V. I. Nesterenko, Dislocation structure and macroscopic characteristics of plastic deformation at creep of silicon crystals, Phys. Stat. Sol., Vol. 36, pp 89-95, 1969.
7. M. M. Myshlyaev, Dislocation creep, Ann. Rev. Mater. Sci., Vol 11, pp 31-50, 1981.
8. L. Anand, Constitutive equations for the rate-dependent deformation of metals at elevated temperatures, J. Engine. Mater. Tech., Vol. 104, pp 12-17, 1982
9. S. Balasubramanian, L. Anand, Elasto-viscoplastic constitutive equations for polycrystalline fcc materials at low homologous temperatures, Submitted to J. Mech. Phys. Solid, 2001
10. E. Orowan, Problems of plastic gliding, Philos. Trans. R. Soc. London A 52, 8-22.
11. U. Kocks, A. Argon, M. Ashby, Thermodynamics and kinetics of slip, in Progress in Material Science, Pergamon Press, London, 1975.
12. W. Dillon, Jr., C. T. Tsai, R. J. DeAngelis, J. Appl. Phys. Vol. 60, p 1784, 1986
13. S. Takeuchi, A. S. Argon, “Steady-state creep of single-phase crystalline matter at high-temperature, J. Mater. Sci., Vol. 11, No. 8, pp1542-1566 1976
14. K. Sumino, Deformation behavior of silicon, Metallur. Mater. Trans. A, Vol. 30A, pp 1465-1479, 1999.
15. J. R. Patel, A. R. Chaudhuri, Macroscopic plastic properties of dislocation-free germanium and other semiconductor crystals. I. Yield behavior, J. Appl. Phys., Vol. 34, No. 9., pp 2788-2799, 1963.
Si 4-pt bending test at 800 °C, ram speed=1 µm/sec