HAL Id: ineris-00972415
https://hal-ineris.archives-ouvertes.fr/ineris-00972415
Submitted on 3 Apr 2014
HAL is a multi-disciplinary open access
archive for the deposit and dissemination of
sci-entific research documents, whether they are
pub-lished or not. The documents may come from
teaching and research institutions in France or
abroad, or from public or private research centers.
L’archive ouverte pluridisciplinaire HAL, est
destinée au dépôt et à la diffusion de documents
scientifiques de niveau recherche, publiés ou non,
émanant des établissements d’enseignement et de
recherche français ou étrangers, des laboratoires
publics ou privés.
UBL/CLU-ESCOMPTE : the urban boundary layer field
experiment over Marseille and the database
Patrice Mestayer, Pierre Durand, Patrick Augustin, Jean-Marc Bonnefond,
Bruno Benech, Bernard Campistron, Alexis Copalle, Hervé Delbarre,
Bénédicte Dousset, Philippe Drobinski, et al.
To cite this version:
Patrice Mestayer, Pierre Durand, Patrick Augustin, Jean-Marc Bonnefond, Bruno Benech, et al..
UBL/CLU-ESCOMPTE : the urban boundary layer field experiment over Marseille and the database.
4. International Conference on Urban Air Quality Measurement Modelling and Management, Mar
2003, Prague, Czech Republic. pp.392-395. �ineris-00972415�
UBL/CLU-ESCOMPTE : THE URBAN BOUNDARY LAYER
FIELD EXPERIMENT OVER MARSEILLE AND THE DATA BASE
Patrice Mestayer', Pierre Durand2 and Patrick Augustin14, Jean-Marc Boirnefond", Bruno Bénech3, Bernard Campistron3, Alexis Coppalle4, Hervé Delbarre14, Bénédicte Dousset5, Philippe Drobinski6, Aimé Druilhet3, Emeric Fréjafon15, Sue Grimmond7, Dominique Groleau8, Mark Irvine11, Claude Kergomard9, Saïda Kermadi10, Jean-Pierre Lagouarde11, Aude Lemonsu2, Fabienne Lohou3, Nathalie Long', Valéry Masson2, Clotilde Moppert3, Joël Noilhan2, Brian Ofïerle7, Tim Oke'2, Grégoire Pigeon2, Vincent Puygrenier3, Jean-Michel Rosant', Frédérique Saïd3, Jennifer
Salmond12, Martine Talbaut4, James Voogt14
1
Laboratoire de Mécanique des Fluides, CNRS - Ecole Centrale de'Narites, France
2
Centre National de Recherche Météorologique, URA CNRS 1357 - Météo-France, Toulouse, France
3
Laboratoire d'Aérologie, OMP - UPS, Toulouse ; A CORIA CNRS - Université-INSA de Rouen
5
Laboratoire Géosystèmes, CNRS - UBO, Brest, 6 Service d'Aeronomie, IPSL, Paris ;
7
Indiana University, Bloomington, USA ; 8 Laboratoire CERMA CNRS - École d'Architecture de Nantes ;
9
Laboratoire de Géographie des Milieux Anthropisés, Université des Sciences et Technologies de Lille ;
10
ESO, CNRS - Université du Maine, Le Mans ; n Unité de Bioclimatologie, INRA, Villenave d ' O m o n ,
12
University of British Columbia, Vancouver, Canada ;1 3 University of Western Ontario, London, Canada ;
14
Laboratoire de Physico-Chimie de l'Atmosphère, CNRS - Université du Littoral,15 INERIS, Vemeuil en Halatte
ABSTRACT
Thé UBL/CLU experiment is a side project of thé régional photochemistry experiment ESCOMPTE over thé Berre-Marseille area. ït took advantage of thé large expérimental set-up, with chemistry and dynamics, ground-based and airbome instrumentations, including a large array of vertical and 3D sounders. With additional spécifie instrumentation in thé lower urban atmosphère, thé UBL/CLU project aimed at documenting thé dynamics and thermodynamics of the urban boundary layer (UBL) of the Marseille area during sunny periods.
To date thé initial data analyses include (a) thé quality control inter-comparison of energy flux instrumentations, (b) thé quality évaluation of thé measurements at thé urban stations, (c) thé comparison of thé Town Energy Balance model with thé data obtained over thé city center, (d) thé évaluation of heat flux measurements with thé scintillometers, (e) thé température and moisture variability at thé canopy level, (f) thé 3D structure of the UBL during sea breeze épisodes, (g) thé visible and thermal infrared signatures of the urban canopy, (h) thé numerical urban data base and satellite data analysis to generate high resolution land use and aerodynamic roughness maps.
1. INTRODUCTION
Thé ESCOMPTE field campaign took place over an area of 120 km x 120 km, from June 4 to July 16, 2001. Thé set-up involved 20 stations, equipped for gas (ozone, nitrogen oxides, VOCs, ...) and/or particle measurements, among which two on ships, and two in trucks. Thé surface energy budget was measured at 9 sites. Thé meteorological basic parameters were aiso measured at 5 complementary sites. Wind profile was continuousiy measured at 12 sites by 7 sodars, 4 UHF and 4 VHP radars. Three Lidars were aiso operated, as well as 4 radiosonde Systems, and 7 aircrafts. Finally 33 constant-volume balloons were launched and tracked during thé Intense Observing Periods (lOPs).
Thé UBL/CLU experiment aimed at documenting thé four-dimensional structure of thé urban boundary layer in connection with thé urban canopy energy exchanges with thé atmosphère during a summer period of low wind and breeze conditions. Thé objectives were (1) to compare urban and rural atmospheric boundary layers (ABL), explore thé influence of sea breeze on thé UBL, and document thé UBL turbulent fieids, and (2) to construct a data base allowing to test urban energy exchange schemes, surface température remote sensing from satellites, and high resolution meteorological and chemistry-transport models.
During thé campaign, two types of intensive observation periods were more densely documented :
- thé 5 ESCOMPTE lOPs (called 1, 2a, 2b, 3 and 4, for a total of 15 days) during situations of land-sea breeze and high insulation, mixed with a light Mistral during thé lOPs 2a and 4. During thèse periods one airplane flew over Marseille to document thé urban boundary layer, measuring thé atmospheric composition and thé wind and turbulence within or at thé top of the boundary layer.
- thé 4 Infrared lOPs when a light airplane equipped with a thermal infrared mapping caméra scanned thé urban canopy at différent times in thé day. Thé influence of spatial resolution and sensor orientation on thé surface température measurements were documented by flying successively in 8 différent directions with respect to thé sun over thé same sites : 3 typical city quarters including thé city center around thé CAA site monitored by thé array of IR radio-thermometers. Radio-sondes were launched from thé Observatoire site during thèse lOPs, and air température was aiso monitored at thé 2 m level with a car driven under thé flight paths.
After data qualification/validation, most of thé data hâve been delivered to thé ESCOMPTE structured data base (http://medias.obs-mip.fr/escompte) which will be freely accessible after April 2003 for model validation.
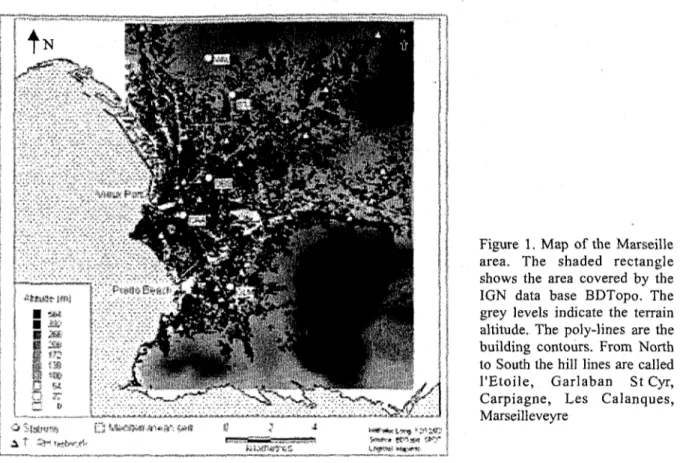
Figure 1. Map of thé Marseille area. Thé shaded rectangle shows thé area covered by thé IGN data base BDTopo. Thé grey levels indicate thé terrain altitude. Thé poly-lines are thé building contours. From North to South thé hill lines are called l ' E t o i l e , G a r l a b a n St Cyr, C a r p i a g n e , Les C a l a n q u e s , Marseilleveyre
2. THE EXPERIMENTAL SET-UP AND THE FIRST RESULTS
Some spécifie features of Marseille must be noted (Figure 1). It is located within an arena of hills, 400-650 m high, separated by small valleys converging towards thé city center ancient harbor (Vieux Port) and thé Prado beach, which are themselves separated by two steep hills about 250 m high. Thé city faces thé sea on thé west, in thé southem part of a large bay, while at a scale of ~100km thé coast is facing thé Mediterranean Sea to thé SSW. This combination of orientations requires spécial attention during thé breeze épisodes as welî as when thé weather is dominated by a low Mistral, thé northem wind exiting from thé Rhône valley. Thé population of thé urban area is slightiy less than one million inhabitants. Except in thé city cenler, thé harbor area and thé outskirts, thé urban fabric is most often composed of an irregular admixture of small individual or collective houses and small ensembles of
4-10 levels collective dwellings.
In thé city center, roughiy a circle 2 km in radius around thé Vieux Port, thé streets are relatively regular and thé constructions form a dense canopy averaging 15 m in height, with sparse, higher, isolated buildings. Thé harbor area is a strip of low storage constructions and surfaces, about hait a kilometer wide, ail along thé Northem coast. Thé outskirts are mainly composed of individual houses with gardens, rarely over very large surfaces without any collective building ; they spread over thé hill slopes. Thé city contains quite few high rise towers, aiways isolated, In thé urban area, thé permanent instrumentation was mainly deployed at five sites along thé' North-South axis of the city, roughiy parallel to thé shoreline (Figure 1). Three urban/suburban stations (GLM, CAA, STJ) were equipped with micro-meteorological masts where thé turbulent and radiation fluxes necessary to monitor thé canopy surface energy budget were continuousiy measured : thé masts raised some 12 to 20 m above thé urban canopy level and thé turbulent fluxes were measured at 2 levels. Thé other two sites (OBS, VAL) aiso included turbulence instrumentation on 12 and 10 m masts, respectively, as a ground référence of vertical profilers (see below).
Thé central site (CAA) was located in thé rather uniform, 18-19th Century, dense part of the city center. Surface energy balance fluxes were measured using eddy covariance instruments and radiometers, mounted on a pneumatic tower on thé roof of thé Cour d'Appel Administrative, 20.7 m above roof level. Two scintillometers were aiso deployed to evaluate thé integrated heat flux over thé city center, with 2 km optical paths oriented N-S and E-W respectively. In addition thé site was aiso equipped with an array of up to 19 IR radio-thermometers, either fixed to monitor thé surface température of selected elementary surfaces, or hand-held to evaluate surface température distributions during periods of intense observation (two IR radio-thermometers were aiso operated at thé suburban site STJ to monitor thé composite surface températures of the ensembles immediately North and South of the site). In this urban fragment thermometers aiso monitored thé heat exchanges between building inside and outside during some periods.
Figure 2 shows examples of diumal cycles of the energy balance components over thé IOP 2, used to test thé urban energy schemes LUMPS and TEB. Thé TEB model was evaluated using air-température from within urban canyons, surface températures for roads, roofs and walls, and flux measurements from thé tower and scintillometers. AU thé energy fluxes were simulated well and thé model succeeded in producing a positive sensible heat flux at night, and thé correct daily cycle of heat storage.
Figure 2. Surface e n e r g y balance fluxes at t h é central station C A A for six days during I O P 2
Marseille 2001 IOP/POI2 (172-1771 E10 - CAA: Upper Level (43.9 m)
Energy Balance Energy Balance: ensemble ail daysMarseille E10 - CAA: Upper Level
172 173 174 175 176
Time (local, DOY, 60 min data) -200 8 12 16 Time (local. 60 min data)
20
An array of 20 T-RH sensors with continuons recorders, at a 6 m height above thé ground allowed to monitor thé dependency of thé urban heat island on thé meteorological conditions. In addition some transect T-RH measurements were occasionally obtained with a car equipped with T-RH ventilated sensors at z = 2 m.
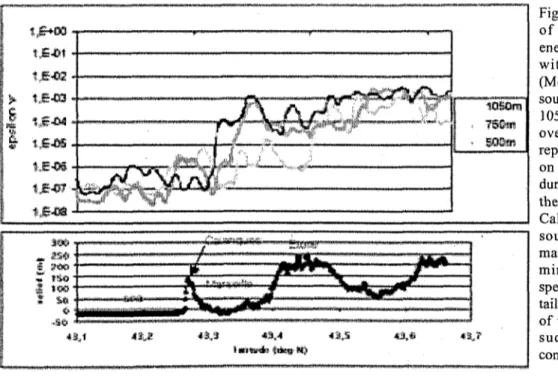
Thé set-up included an array of four vertical sounders : two Sodars at thé sub-urban sites GLM and STJ, sounding thé atmospheric surface layer, a wind profiler UHF Radar and a tethered balloon occasionally measuring thermodynamic and ozone profiles from 20 to 300 m, at thé OBS site, close to thé city center, and a RASS-sodar température and wind vertical sounder at thé VAL site. At this site, located at thé border of thé city and overlooking most of thé urban area two Lidars were scanning thé atmosphère horizontally and vertically up to a distance of about 10km : a UV Lidar measuring thé 0 3 concentration, and a 10 (im Doppler Lidar (called TWL, transportable wind Lidar) measuring thé radial wind ; both instruments were operated in parallel to générale tomographic observations of thé aérosol content and thé UBL structure in thé scanned volume (Figure 4) . Thèse sounders were aiso part of a larger array of vertical sounders within thé ESCOMPTE expérimental set-up allowing to monitor thé 3-D structure of the ABL over thé régional demain. Thé data from thé sounders are composed with those obtained during thé airplane flights over Marseille (Figure 3) to provide complète understanding of the UBL/ABL structure.
Figure 3. Dissipation rate of t u r b u l e n t k i n e t i c energy ( m Y3) measured with thé Merlin IV (MeteoFrance) along thé south-north legs at levels 1050, 750 and 500 m. Thé overflown relief is aiso represented with thé sea on thé left (south). Thé duration of the flight over thé town, between thé Calanques ridge to thé south and thé Etoile massif to thé north, is 3 m i n u t e s . T h é e n e r g y spectrum high frequency tail is a relevant indicator of turbulence intensity in s u c h i n h o m o g e n e o u s conditions.
Figure 4 : Vertical cross section of radial velocities with TWL pointing eastward towards land ( azimuth 110°). Thé arrows indicate thé flow circulation in thé section.
0
0
2 3 4 5 6
Range from TWL (km)
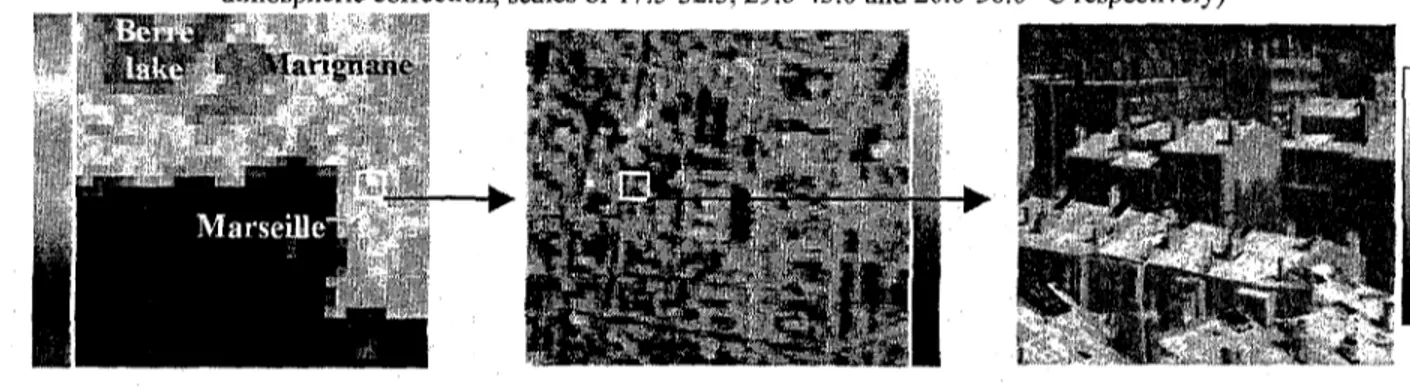
Satellite images were collected during thé experiment, from a variety of sensors and platforms. About 150 useable images from thé Advanced Very High Resolution Radiometer (AVHRR) on board satellites NOAA-12, NOAA-14 and NOAA-16, collected at thé University of Modena by F. Parmigiani, were contributed to thé project, an average of 4 images/day for thé period 4 June to 13 July 2001. Sixty-six images from MODIS on board thé TERRA satellite were aiso obtained from thé NASA/EOSDIS data center. Finally, a single high resolution ASTER image was obtained from NASA/JPL and NASDA on 27 May 2001; this was complemented by an additional image on 2 August 2002. Thé thermal data set aiso includes airbome measurements using a PRT5 Bames radiometer (8-14 uni spectral band) aboard thé Merlin IV aircraft providing nadir surface température, and a thermal infrared (TIR) caméra (INFRAMETRICS model 760, 7.5-13 um spectral window) equipped with 80° wide-angle lenses and placed aboard a PA28 aircraft, inclined about 20° backward. Flying several axis crossing above thé city allowed to obtain TIR measurements in a -60° to +60° range of zénith view angles and in ail azimuth directions, and to characterize TIR directional effects as thé différence between oblique and nadir measurements of radiative surface température. As an example. Figure 5 shows thé AVHRR (channel 4 not corrected for atmosphère), Inframetrics caméra, and SC500 F U R scanner thermal infrared images of July 10 2001 at 13:18 UTC. Différences in brightness température of up to 5 and 8 C are observed between rural areas, and thé urban-industrial areas of Marseille. In thé city, surface températures (LST) reach 31 °C in thé densely built areas, with small parks generating cool islands of 1.5 to 3.5 °C. LST are somewhat lower in residential areas (29 °C), probably due to larger proportions of végétation. Multi-spectral and panchromatic SPOT images were aiso analyzed to obtain with a very high resolution thé types of surface coverages. Spécifie statistical analysis of the 3-D data base BDTopo of IGN (thé French national géographie institute), describing such urban objects as buildings, constructions, végétation, etc., hâve been combined with satellite data to générale high resolution maps of the surface energy model input parameters such as urban land uses, roughness length, albedo, etc.
A C K N O W L E D G E M E N T S
Through thé coopérative projects CLU and TUE, thé UBL/CLLJ-Escompte experiment was funded by thé CNRS programs for atmospheric dynamics (PATOM) and remote sensing from space (PNTS). As an ESCOMPTE associated project it aiso benefited from thé ESCOMPTE funding. Thé BDTopo urban data base was provided by thé Institut Géographique National (IGN).
Figure 5. Example of multi-scale approach of the TIR over Marseille city with NOAA-AVHRR channel 4 (a), airbome Inframetrics 760. caméra (b), SC500 FLIR scanner from roof level (c) (brightness températures wilhout
atmospheric correction, scales of 17.5-32.5, 29.0-43.0 and 20.0-50.0 °C respectively)