HAL Id: hal-00302291
https://hal.archives-ouvertes.fr/hal-00302291
Submitted on 22 Nov 2006HAL is a multi-disciplinary open access
archive for the deposit and dissemination of sci-entific research documents, whether they are pub-lished or not. The documents may come from teaching and research institutions in France or abroad, or from public or private research centers.
L’archive ouverte pluridisciplinaire HAL, est destinée au dépôt et à la diffusion de documents scientifiques de niveau recherche, publiés ou non, émanant des établissements d’enseignement et de recherche français ou étrangers, des laboratoires publics ou privés.
Assimilation of TES CO into a global CTM: first results
N. A. D. Richards, Q. Li, K. W. Bowman, J. R. Worden, S. S. Kulawik, G. B.
Osterman, H. M. Worden, J.-F. Lamarque, B. V. Khattatov
To cite this version:
N. A. D. Richards, Q. Li, K. W. Bowman, J. R. Worden, S. S. Kulawik, et al.. Assimilation of TES CO into a global CTM: first results. Atmospheric Chemistry and Physics Discussions, European Geosciences Union, 2006, 6 (6), pp.11727-11743. �hal-00302291�
ACPD
6, 11727–11743, 2006 Assimilation of TES CO N. A. D. Richards et al. Title Page Abstract Introduction Conclusions References Tables Figures ◭ ◮ ◭ ◮ Back Close Full Screen / EscPrinter-friendly Version Interactive Discussion
EGU
Atmos. Chem. Phys. Discuss., 6, 11727–11743, 2006 www.atmos-chem-phys-discuss.net/6/11727/2006/ © Author(s) 2006. This work is licensed
under a Creative Commons License.
Atmospheric Chemistry and Physics Discussions
Assimilation of TES CO into a global
CTM: first results
N. A. D. Richards1, Q. Li1, K. W. Bowman1, J. R. Worden1, S. S. Kulawik1, G. B. Osterman1, H. M. Worden1, J.-F. Lamarque2, and B. V. Khattatov3
1
Jet Propulsion Laboratory, California Institute of Technology, Pasadena, CA, USA
2
National Center for Atmospheric Research, Boulder, CO, USA
3
Fusion Numerics, Boulder, CO, USA
Received: 18 October 2006 – Accepted: 14 November 2006 – Published: 22 November 2006 Correspondence to: N. A. D. Richards ([email protected])
ACPD
6, 11727–11743, 2006 Assimilation of TES CO N. A. D. Richards et al. Title Page Abstract Introduction Conclusions References Tables Figures ◭ ◮ ◭ ◮ Back Close Full Screen / EscPrinter-friendly Version Interactive Discussion
EGU
Abstract
We present results from the first assimilation of carbon monoxide (CO) observations from the Tropospheric Emission Spectrometer (TES) into a global three-dimensional (3-D) chemistry and transport model (CTM). A sequential sub-optimal Kalman filter assimilation scheme (Khattatov et al., 2000) was applied to assimilate TES CO
pro-5
files during November 2004 into the GEOS-Chem global 3-D CTM. The assimilation results were compared with MOPITT and MOZAIC observations. The assimilation sig-nificantly improves model simulation of CO in the middle to upper troposphere, where the MOPITT versus model bias was reduced by up to two-thirds. Assimilation results show higher levels of CO in the southern tropics, consistent with MOPITT
observa-10
tions. We find good agreement between the TES assimilated model estimates of CO and in situ measurements from the MOZAIC program, which shows a negative bias of up to 10 ppbv in middle and upper tropospheric TES CO. The results demonstrate how assimilation can be used for non-coincident validation of TES CO profile retrievals.
1 Introduction
15
Carbon monoxide (CO) is an excellent tracer for pollution transport (Liu et al., 2003). Global coverage provided by space-based remote sensing of CO, such as from the Measurements Of Pollution In The Troposphere (MOPITT) (Drummond et al., 1992) and Atmospheric Infrared Sounder (AIRS) (McMillan et al., 2005) satellite instruments, has been used to track inter-continental transport of pollution (e.g., Heald et al., 2003).
20
Launched in July 2004, the Tropospheric Emission Spectrometer (TES) onboard the Aura satellite provides global 3-D mapping of both CO and ozone among other trace gases (Beer et al., 2001). Validation of the TES CO product is critical to understand-ing its value for further scientific analyses. We demonstrate here a useful method for conducting validation analyses using non-coincident measurements. We present
25
ACPD
6, 11727–11743, 2006 Assimilation of TES CO N. A. D. Richards et al. Title Page Abstract Introduction Conclusions References Tables Figures ◭ ◮ ◭ ◮ Back Close Full Screen / EscPrinter-friendly Version Interactive Discussion
EGU
and mixing ratio profiles with MOZAIC observations (Marenco et al., 1998; N ´ed ´elec et al., 2003, 2005). MOPITT CO retrievals of mixing ratios and column amounts have been extensively validated using coincident in situ aircraft observations (Emmons et al., 2004).
Chemical data assimilation is a valuable tool for the validation of non-coincident
ob-5
servations (e.g., Levelt et al., 1998). Space-time data assimilation techniques pro-vide the necessary framework to combine different sources of information into a single product in an optimal manner, taking into account the uncertainties of each component (Errico, 1999). Khattatov et al. (2000) presented a sequential assimilation approach to combine UARS MLS stratospheric ozone with results from a global 3-D CTM. The
10
assimilation technique consisted of a sub-optimal Kalman filter with explicit calculation of the evolution of the model error variance. This technique has since been used in the assimilation of trace gases (e.g., Lamarque et al., 2004; Yudin et al., 2004) and aerosols (e.g., Yu et al., 2003). This sub-optimal Kalman filter is applied in the present study to assimilate TES CO mixing ratio profiles during 1–15 November 2004 into the
15
GEOS-Chem model (Bey et al., 2001a).
2 TES CO observations
TES is an infrared Fourier transform spectrometer that measures atmospheric thermal emission over the spectral range 650–2250 cm−1, with a nadir footprint of 5.3 km across track and 8.5 km along track for the 16-detector average (Beer et al., 2001). It was
20
designed to provide simultaneous vertical information on tropospheric ozone, CO and other trace gases on a global basis. TES has two basic science operating modes: Global Survey and Special Observations. Global Surveys are conducted every other day while special observations are taken as needed in between Global Surveys. For the Global Survey data used in this analysis, the nadir observations have a spacing of
25
about 5◦along the orbit track. Global Surveys taken after 21 May 2005 have increased nadir sampling, ∼1.6◦ spacing along the orbit track, but no longer include routine limb
ACPD
6, 11727–11743, 2006 Assimilation of TES CO N. A. D. Richards et al. Title Page Abstract Introduction Conclusions References Tables Figures ◭ ◮ ◭ ◮ Back Close Full Screen / EscPrinter-friendly Version Interactive Discussion
EGU
observations. The assimilation described here also ingests data from TES Step & Stare special observations which consists of a series of nadir measurements taken at a spacing of 35 km along the Aura orbit track. An overview of the TES retrieval algorithm and predicted errors are discussed in Bowman et al. (2002) and Worden et al. (2004). Recent observations with the TES nadir CO measurements are described
5
by Rinsland et al. (2005).
During 1–15 November 2004 there were six TES Global Surveys and 10 Step & Stares special observations. This represents one global coverage cycle for TES and is the first available continuous set of TES observations. Release V001 TES data are used in this study. TES CO profiles were assimilated into GEOS-Chem once every
10
hour, same as the model chemistry time step. TES CO profiles, averaging kernels, er-ror covariances, and a priori profiles were mapped down from the original 88 pressure levels to a reduced 14-level pressure grid for computational considerations. The map-ping was linear with respect to the logarithm of pressure and the mixing ratio of CO. This mapping does not significantly affect the assimilation because typical CO profiles
15
can be well represented by this reduced grid. The TES data were filtered according to the quality flags provided (Osterman et al., 2005). Retrievals with surface pressure less than 825 hPa were removed to avoid complications associated with variable to-pography. Additionally, data were excluded for latitudes higher than 60 degrees, where there is little thermal contrast and therefore significantly reduced vertical information.
20
3 Model description
GEOS-Chem is driven by assimilated meteorological observations from the Goddard Earth Observing System (GEOS) of the NASA Global Modeling and Assimilation Of-fice (GMAO). We use here GEOS-Chem version 7.1.1 (http://www-as.harvard.edu/
chemistry/trop/geos/). The simulation of transport in the GEOS-Chem model uses
25
archived GEOS-4 data for winds, mixing depths, and convective mass fluxes. In this study, GEOS-4 data for 2004 are used with a horizontal resolution of 4◦
ACPD
6, 11727–11743, 2006 Assimilation of TES CO N. A. D. Richards et al. Title Page Abstract Introduction Conclusions References Tables Figures ◭ ◮ ◭ ◮ Back Close Full Screen / EscPrinter-friendly Version Interactive Discussion
EGU
sigma-pressure hybrid levels in the vertical. CO-only simulations are conducted using archived OH fields from a full chemistry simulation (Bey et al., 2001b). Global emis-sions of CO are described in Bey et al. (2001a) with updates, with biomass burning emissions described by Duncan et al. (2003) and biofuel emissions by Yevich and Lo-gan (2003). GEOS-Chem simulation and assimilation of CO were conducted for 1–15
5
November 2004 with a two-month spin-up. We focus our analysis on 15 November.
4 Assimilation Approach
The assimilation scheme employed here is a sub-optimal Kalman filter scheme fol-lowing Khattatov et al. (2000). A brief description of the assimilation method is given here. At each assimilation time step (t) the state vector xat, whose elements contain
10
the estimated global CO concentrations, also called the analysis, is given by:
xat = xt+K(y – Hxt) (1)
where xt consists of the model CO field at time t, y contains the observed CO
con-centrations and K is the Kalman Gain matrix and is given by:
K = BtH T (HBtH T +O + R)−1 (2) 15
where Bt is the model (also known as forecast or background) error covariance at
time t, O is the error covariance matrix of the observations and R is the representative-ness error covariance. H is known as the observation operator and represents both the horizontal mapping of model CO profiles to the observation location and the ver-tical smoothing of model profiles to the resolution of the observations. The horizontal
20
mapping is performed using 2-dimensional linear interpolation. In this study, vertical smoothing and accounting for the TES a priori constraint vector xa are achieved by
applying the TES averaging kernel, A, to GEOS-Chem CO profile xm through the
fol-lowing linear transformation (Rodgers, 2000)
x = xa+ A(xm− xa) (3)
25
ACPD
6, 11727–11743, 2006 Assimilation of TES CO N. A. D. Richards et al. Title Page Abstract Introduction Conclusions References Tables Figures ◭ ◮ ◭ ◮ Back Close Full Screen / EscPrinter-friendly Version Interactive Discussion
EGU
Consequently, this transformation accounts for both the bias and smoothing in the TES retrievals (Jones et al., 2003). TES a priori constraints for CO are obtained from a climatology derived from the MOZART (Brasseur et al., 1998; Park et al., 2004) model results. The logarithm of TES CO mixing ratio profiles and GEOS-Chem CO fields are used in Eqs. (1) and (3) since the TES averaging kernels relate to changes in the
5
logarithm of CO mixing ratios.
After each assimilation step, xat is used as the initial condition for GEOS-Chem to
predict CO concentrations for the next model time step. For this study, the initial GEOS-Chem model error variance was set to 20%. The time evolution of the GEOS-GEOS-Chem model error covariance was modeled by treating the diagonals as a passive tracer
10
in the model, with the off-diagonal elements parameterized according to Khattatov et al. (2000). Horizontal and vertical correlation lengths of 125 km and 0.7 km, respec-tively, and an error growth term of 18%/day are used in the model error covariance parameterization. These parameters are consistent with those used by Lamarque et al. (2004) in the assimilation of MOPITT CO into the MOZART model, who found that
15
small variations in these parameters do not significantly affect the results of the assim-ilation.
5 Results and discussion
Figure 1 shows GEOS-Chem simulated CO concentrations with and without assimi-lating TES data and the difference between the two at 5.5 km on 15 November 2004,
20
the last day of the assimilation. The assimilated and non-assimilated (i.e., free-running simulation) fields exhibit many of the same large scale features such as the higher CO concentrations in the northern hemisphere due to anthropogenic emissions and high CO concentrations over Africa and South America due to biomass burning emissions. However, the assimilated field shows much higher CO concentrations than the
non-25
assimilated field, particularly in the southern tropics where differences of up to 50 ppbv at 500 mb are evident. It is known that there is widespread biomass burning throughout
ACPD
6, 11727–11743, 2006 Assimilation of TES CO N. A. D. Richards et al. Title Page Abstract Introduction Conclusions References Tables Figures ◭ ◮ ◭ ◮ Back Close Full Screen / EscPrinter-friendly Version Interactive Discussion
EGU
much of the tropics during Austral spring (Duncan et al., 2003). The abovementioned differences are likely due to underestimated biomass burning emissions in Southern Africa and South America as prescribed in the model, consistent with previous inverse studies using MOPITT data (Arellano et al., 2004). The simulations presented here use climatological biomass burning emission inventories that are not year-specific, thus, the
5
time, location and amount of CO released will not represent the actual emissions. A comparison was also conducted against a GEOS-Chem simulation using year-specific biomass burning emissions for 2004 from the GFED 2.0 inventory (van der Werf et al., 2006). We found that the southern tropical biomass burning emissions of CO in GFED 2.0 are 40–90% lower than those in Duncan et al. (2003), resulting in even larger
differ-10
ences. Another possible reason for the model underestimation of CO concentrations in biomass burning regions could be related to the injection height of the emissions – in our simulation, biomass burning CO is emitted into the boundary layer. A recent study by Turquety et al. (2006)1has shown that by releasing a significant fraction of the biomass burning emissions into the upper troposphere, GEOS-Chem is able to better
15
reproduce MOPITT CO observations downwind from the source regions.
The observation minus forecast (OMF) provides a test of the quality of the assimila-tion and also highlights systematic differences between the assimilated product and the data. A time series of OMF during the assimilation period is shown in Fig. 1 for three tropical ocean regions. The OMFs for all three regions decrease with time, indicating
20
that the assimilation system is performing well and incorporating information from the TES observations. Although these differences decrease over time as TES data are assimilated into the model, the OMF will not reach zero since not only do we not have perfect observations there is also an underestimation of biomass burning emissions in the model that is not corrected by the assimilation.
25 1
Turquety, S., Logan, J. A., Jacob, D. J., et al.: Inventory of boreal fire emissions for North America in 2004: the importance of peat burning and pyro-convective injection, J. Geophys. Res., submitted, 2006.
ACPD
6, 11727–11743, 2006 Assimilation of TES CO N. A. D. Richards et al. Title Page Abstract Introduction Conclusions References Tables Figures ◭ ◮ ◭ ◮ Back Close Full Screen / EscPrinter-friendly Version Interactive Discussion
EGU
5.1 Comparison with MOPITT
MOPITT data for 15 November 2005 were compared to the assimilated and non-assimilated GEOS-Chem results. For the comparison non-assimilated and non-non-assimilated GEOS-Chem profiles were extracted at the time and location of each MOPITT obser-vation. The MOPITT averaging kernels were then applied to account for the vertical
5
smoothing and a priori influence inherent in the retrieved MOPITT profiles (Deeter et al., 2004). The MOPITT and transformed GEOS-Chem profiles were then binned onto the GEOS-Chem 4◦
×5◦grid.
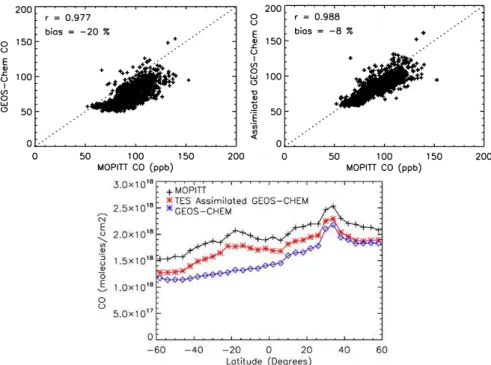
Emmons et al. (2004) have shown that the MOPITT Phase 2 CO mixing ratio pro-files used here exhibit, on average, a positive bias of 1% in the upper troposphere
10
with larger biases observed in specific cases. We find that the assimilation of TES data into GEOS-Chem significantly reduces the model – MOPITT bias throughout the tropospheric profile by up to two-thirds (Table 1), particularly in the middle to upper troposphere. Figure 2 shows a scatter-plot of GEOS-Chem and MOPITT CO con-centrations at 500 hPa. It is clear that by assimilating TES CO into GEOS-Chem the
15
comparison with MOPITT is greatly improved with a 60% reduction in the bias. Non-coincident comparisons between TES and MOPITT have shown that MOPITT has a small positive bias with respect to TES (Luo et al., 2006), but this type of comparison can only be conducted with large datasets which must be averaged and interpolated before comparisons can be made.
20
The zonal mean total column of CO from MOPITT and GEOS-Chem simula-tion/assimilation were calculated and the results are shown in Fig. 2. Both MOPITT and model results exhibit similar latitudinal distribution. Figure 2 shows that MOPITT retrieved CO column density in the southern tropics are up to 60% greater than that from the standard GEOS-Chem simulation. This enhancement of CO as indicated
25
by MOPITT retrievals is better reproduced in GEOS-Chem results with assimilation of TES CO data – the discrepancy is reduced by a factor of 4 to just 13%. The com-parison here points to an underestimate of the biomass burning emissions as used in
ACPD
6, 11727–11743, 2006 Assimilation of TES CO N. A. D. Richards et al. Title Page Abstract Introduction Conclusions References Tables Figures ◭ ◮ ◭ ◮ Back Close Full Screen / EscPrinter-friendly Version Interactive Discussion
EGU
the GEOS-Chem simulation presented here in the southern tropics, particularly South America and the Indonesia/Australia region. A previous study of inverse modeling of MOPITT CO columns using GEOS-Chem has shown an underestimation of biomass burning emissions of CO in these regions (Arellano et al., 2004).
5.2 Comparison with MOZAIC CO observations
5
The MOZAIC program measures CO in the upper troposphere at the aircraft cruising altitude (between 200–300 hPa) and also profiles during take-off and landing (N ´ed ´elec et al., 2003, 2005). Figure 3 shows two CO profiles obtained by MOZAIC aircraft on 15 November 2004. The first (left panel) was taken during a take-off from Toronto airport. Both the model and the observations show similar vertical distributions with
10
higher concentrations in the boundary layer and an enhanced layer of CO at 400 hPa. The assimilation does not change the vertical distribution significantly but increases CO concentrations between 800 and 200 hPa which are now in better agreement with the observations. The second profile (centre panel) was taken during a descent to Vienna. The polluted boundary layer is evident in both the observation and model
re-15
sults. The profile also shows an enhanced layer of CO between 300 and 400 hPa that is not captured by the model without assimilation of TES data. Back trajectories (not shown here) indicate that the enhanced CO layer originated in the boundary layer over the United States five days earlier, before being lifted to the upper troposphere and transported across the North Atlantic. Although there were no TES observations that
20
were coincident with the aircraft measurements, GEOS-Chem results with the assimi-lation capture the enhanced CO layer in the upper troposphere. This demonstrates the usefulness of the assimilation for non-coincident comparisons. The right panel in Fig. 3 shows the mean CO profile differences between MOZAIC and GEOS-Chem with and without assimilation for all MOZAIC profiles taken on 14 and 15 November 2004, the
25
last two days of the assimilation period, by which time the assimilation has ingested one complete global cycle of TES data. The results show little improvement in the lower troposphere where TES is less sensitive, whereas in the middle to upper
ACPD
6, 11727–11743, 2006 Assimilation of TES CO N. A. D. Richards et al. Title Page Abstract Introduction Conclusions References Tables Figures ◭ ◮ ◭ ◮ Back Close Full Screen / EscPrinter-friendly Version Interactive Discussion
EGU
sphere (above 700 mb) the differences between the assimilated and non-assimilated cases are more substantial with a reduction in the GEOS-Chem – MOZAIC bias of 80% at 300 mb. The assimilation of TES data into GEOS-Chem is able to reduce the average bias with respect to MOZAIC to less than 10 ppbv in the middle and upper troposphere. The comparisons suggest that TES CO profiles are consistent with the in
5
situ observations of MOZAIC, but exhibit a negative bias of up to 10 ppbv in the middle troposphere (between 700 and 400 mb).
6 Summary and conclusions
We presented results of the first assimilation of TES CO profile measurements into the GEOS-Chem global 3-D CTM. The simulation was conducted for 1–15 November
10
2004. The decreasing observation minus forecast (OMF) with time suggests that the assimilation is performing well. By comparing assimilated with non-assimilated GEOS-Chem simulations we found differences of up to 50 ppbv in the middle troposphere over the southern tropics. These differences point to a likely underestimation of the biomass burning emissions as prescribed in the model. The assimilation of TES CO
15
significantly improves comparisons with model CO profiles convoluted with MOPITT averaging kernels, reducing the MOPITT – model bias by up to two thirds in the mid-dle and upper troposphere. Comparisons of assimilated profiles with MOZAIC aircraft measurements of CO mixing ratio profiles show that TES exhibits a small negative bias of up to 10 ppbv in the middle troposphere (between 700 and 400 mb). The assimilation
20
is also able to capture a large-scale transport event in the upper troposphere. These results demonstrate the utility of data assimilation for validation of non-coincident satel-lite measurements, enabling comparisons to be conducted on a profile by profile basis. Future improvements in the comparisons are also expected as the TES optical bench warm up activities in December 2005 improved the TES CO measurement region by
25
more that a factor of 2 compared with the 1–15 November 2004 period used in this research (Rinsland et al., 2006). In addition, planned temperature and cloud retrieval
ACPD
6, 11727–11743, 2006 Assimilation of TES CO N. A. D. Richards et al. Title Page Abstract Introduction Conclusions References Tables Figures ◭ ◮ ◭ ◮ Back Close Full Screen / EscPrinter-friendly Version Interactive Discussion
EGU
refinements in V003 are expected to further improve the TES CO observations used in the assimilations.
Acknowledgements. This work was performed at Jet Propulsion Laboratory, California Institute
of Technology, under contract with NASA. We are thankful to all colleagues and associates for contributing to the EOS TES project. The authors acknowledge for their strong support the
5
European Commission, Airbus, CNRS-France, FZJ-Germany and the airlines (Lufthansa, Air France, Austrian and former Sabena) who carry free of charge the MOZAIC instrumentation since 1994.
References
Arellano, A. F., Kasibhatla, P. S., Giglio, L., et al.: Top-down estimates of global CO sources
us-10
ing MOPITT measurements, Geophys. Res. Lett., 31, L01104, doi:10.1029/2003GL018609, 2004.
Beer, R., Glavich, T. A., and Rider, D. M.: Tropospheric emission spectrometer for the Earth Observing System’s Aura satellite, Appl. Opt., 40(15), 2356–2367, 2001.
Bey, I., Jacob, D. J., Yantosca, R. M., et al.: Global modeling of tropospheric chemistry with
15
assimilated meteorology: Model description and evaluation, J. Geophys. Res., 106, 23 073– 23 089, 2001a.
Bey, I., Jacob, D. J., Logan, J. A., and Yantosca, R. M.: Asian chemical outflow to the Pacific: Origins, pathways and budgets, J. Geophys. Res., 106, 23 097–23 113, 2001b.
Bowman, K. W., Worden, J., Steck, T., et al.: Capturing time and vertical variability
oftro-20
pospheric ozone: A study using TES nadir retrievals, J. Geophys. Res., 107(D23), 4723, doi:10.1029/2002JD002150, 2002.
Brasseur, G. P., Hauglustaine, D. A., Walters, S., et al.: MOZART, a global chemical transport model for ozone and related chemical tracers 1. Model description, J. Geophys. Res.-Atmos., 103, 28 265–28 289, 1998.
25
Deeter, M. N., Emmons, L. K., Edwards, D. P., Gille, J. C., and Drummond, J. R.: Vertical resolution and information content of CO profiles retrieved by MOPITT, Geophys. Res. Lett., 31, L15112, doi:10.1029/2004GL020235, 2004.
Drummond, J. R.: Measurements of Pollution in the Troposphere (MOPITT), in The Use of EOS for Studies of Atmospheric Physics, 1269–1284, North-Holland, Amsterdam.
30
ACPD
6, 11727–11743, 2006 Assimilation of TES CO N. A. D. Richards et al. Title Page Abstract Introduction Conclusions References Tables Figures ◭ ◮ ◭ ◮ Back Close Full Screen / EscPrinter-friendly Version Interactive Discussion
EGU
Duncan, B. N., Martin, R. V., Staudt, A. C., et al.: Interannual and seasonal variability of biomass burning emissions constrained by satellite observations, J. Geophys. Res., 108(D2), 4100, doi:10.1029/2002JD002378, 2003.
Emmons, L. K., Martin, R. V., Staudt, A. C., Yevich, R. M., and Logan, J. A.: Validation of Measurements of Pollution in the Troposphere (MOPITT) CO retrievals with aircraft in situ
5
profiles, J. Geophys. Res., 109, D03309, doi:10.1029/2003JD004101, 2004.
Errico, R. M.: Workshop on the assimilation of satellite data, Bull. Am. Meteorol. Soc., 80, 463–471, 1999.
Jones, D. B., Bowman, K. W., Palmer, K. W., et al.: Potential of observations from the Tro-pospheric Emission Spectrometer to constrain continental sources of carbon monoxide, J.
10
Geophys. Res., 108(D24), 4789, doi:10.1029/2003JD003702, 2003.
Heald, C. L., Jacob, D. J., Fiore, A. M., et al.: Transpacific satellite and aircraft observations of Asian pollution, J. Geophys. Res., 108 (D24), 4804, doi:10.1029/2003JD003507, 2003. Khattatov, B. V., Lamarque, J.-F., Lyjak, L. V., et al.: Assimilation of satellite observations of
long-lived chemical species in global chemistry transport models, J. Geophys. Res., 105, 23,
15
29 135–29 144, 2000.
Lamarque, J.-F., Khattatov, B., Yudin, V., et al.: Application of a bias estimator for the improved assimilation of Measurements of Pollution in the Troposphere (MOPITT) carbon monoxide retrievals, J. Geophys. Res., 109(D16), D16304, doi:10.1029/2003JD004466, 2004.
Levelt, P. F., Khattatov, B. V., Gille, J. C., et al.: Assimilation of MLS ozone measurements
20
in the global three-dimensional chemistry-transport model ROSE, Geophys. Res. Lett., 25, 4493–4496, 1998.
Liu, H., Jacob, D. J., Bey, I., et al.: Transport pathways for Asian pollution outflow over the Pacific: Interannual and seasonal variations, J. Geophys. Res., 108(D20), 8786, doi:10.1029/2002JD003102, 2003.
25
Luo, M., Rinsland, C., Rodgers, C., Logan, J., et al.: The influences of a priori data and instru-ment characteristics on nadir atmospheric species retrievals-Comparison of CO retrievals from TES and MOPITT, J. Geophys. Res., in press, 2006.
Marenco, A., Thouret, V., Nedelec, P., et al.: Measurement of ozone and water vapor by Airbus in-service aircraft: The MOZAIC airborne program, An overview, J. Geophys. Res., 103,
30
25 631–25 642, 1998.
McMillan, W. W., Barnet, C., Strow, M. T., et al.: Daily global maps of carbon monox-ide from NASA’s Atmospheric Infrared Sounder, Geophys. Res. Lett., 32, L11801,
ACPD
6, 11727–11743, 2006 Assimilation of TES CO N. A. D. Richards et al. Title Page Abstract Introduction Conclusions References Tables Figures ◭ ◮ ◭ ◮ Back Close Full Screen / EscPrinter-friendly Version Interactive Discussion
EGU
doi:10.1029/2004GL021821, 2005.
N ´ed ´elec, P., Thouret, V., Brioude, J., et al.: Extreme CO concentrations in the upper tropo-sphere over North-East Asia in June 2003 from the in-situ MOZAIC aircraft data, Geophys. Res. Lett., 32, L14807, doi:10.1029/2005GL023141, 2005.
N ´ed ´elec, P., Cammas, J. P., Thouret, V., et al.: An Improved Infra-Red Carbon Monoxide
Anal-5
yser for Routine Measurements aboard Commercial Airbus Aircraft: Technical Validation and First Scientific Results of the MOZAIC III Program, Atmos. Chem. Phys., 1551–1564, 2003. Osterman, G. B. (Ed.): TES Validation Report, Version 1.00, 2005, available at:http://eosweb.
larc.nasa.gov/PRODOCS/tes/table tes.html, 2005.
Park, M., Randel, W. J., Kinnison, D. E., et al.: Seasonal variations of Methane, Water
Va-10
por, Ozone, and Nitrogen Dioxide near the tropopause: Satellite Observations and Model Simulations, J. Geophys., Res., 109, D03302, doi10.1029/2003JD003706, 2004.
Rinsland, C. P., Luo, M., Logan, J., et al.: Nadir Measurements of Carbon Monoxide (CO) Dis-tributions by the Tropospheric Emission Spectrometer Instrument onboard the Aura Space-craft: Overview of Analysis Approach and Examples of Initial Results, Geophys. Res. Lett.,
15
in press, 2006.
Rodgers, C. D.: Inverse Methods for Atmospheric Sounding: Theory and Practice. Singapore, World Scientific, 2000.
Van der Werf, G. R., Randerson, J. T., Giglio, L., et al.:, Interannual variability in global biomass burning emission from 1997–2004, Atmos. Chem. Phys., 6, 3423–3441, 2006.
20
Worden, J., Kulawik, S. S., Shephard, M. W., et al.: Predicted errors of tropospheric emission spectrometer nadir retrievals from spectral window selection, J. Geophys. Res., 109(D9), D09308, doi:10.1029/2004JD004522, 2004.
Yudin, V. A., P ´etron, G., Lamarque, J.-F., et al.: Assimilation of the 2000-2001 CO MOPITT retrievals with optimized surface emissions, Geophys. Res. Lett., 31, L20105,
25
doi:10.1029/2004GL021037, 2004.
Yu, H., Dickinson, R. E., Chin, M., et al.: Annual cycle of global distributions of aerosol optical depth from integration of MODIS retrievals and GOCART model simulations, J. Geophys. Res., 108(D3), 4128, doi:10.1029/2002JD002717, 2003.
ACPD
6, 11727–11743, 2006 Assimilation of TES CO N. A. D. Richards et al. Title Page Abstract Introduction Conclusions References Tables Figures ◭ ◮ ◭ ◮ Back Close Full Screen / EscPrinter-friendly Version Interactive Discussion
EGU
Table 1. Global mean bias of GEOS-Chem – MOPITT before and after assimilation of TES CO observations.
Pressure (mb) Bias (No Assim) Bias (Assim) Surface –16% –16% 850 –32% –16% 150 –16% –5% 250 –18% –6% 350 –19% –7% 500 –20% –8% 700 –26% –13%
ACPD
6, 11727–11743, 2006 Assimilation of TES CO N. A. D. Richards et al. Title Page Abstract Introduction Conclusions References Tables Figures ◭ ◮ ◭ ◮ Back Close Full Screen / EscPrinter-friendly Version Interactive Discussion EGU 406 407 408
Figure 1. GEOS-Chem non-assimilated (top left) and assimilated (top right) CO at 5.5km 409
on November 15, 2004, the last day of the assimilation run. Also shown are the difference 410
Fig. 1. GEOS-Chem non-assimilated (top left) and assimilated (top right) CO at 5.5 km on 15 November 2004, the last day of the assimilation run. Also shown are the difference between the assimilated and non-assimilated fields (bottom right) and observation minus forecast (OMF) time series (bottom left) for three southern tropical ocean regions.
ACPD
6, 11727–11743, 2006 Assimilation of TES CO N. A. D. Richards et al. Title Page Abstract Introduction Conclusions References Tables Figures ◭ ◮ ◭ ◮ Back Close Full Screen / EscPrinter-friendly Version Interactive Discussion
EGU
413
414
Figure 2. Comparison of MOPITT with GEOS-Chem non-assimilated (top left) and 415
assimilated (top right) CO concentrations at 500 mb and zonal mean columns (bottom) 416
Fig. 2. Comparison of MOPITT with GEOS-Chem non-assimilated (top left) and assimilated (top right) CO concentrations at 500 mb and zonal mean columns (bottom) for 15 November 2004.
ACPD
6, 11727–11743, 2006 Assimilation of TES CO N. A. D. Richards et al. Title Page Abstract Introduction Conclusions References Tables Figures ◭ ◮ ◭ ◮ Back Close Full Screen / EscPrinter-friendly Version Interactive Discussion EGU 428 429 430
Fig. 3. Comparison of GEOS-Chem non-assimilated and assimilated CO profiles with MOZAIC observed profiles taken over Toronto (top left), Vienna (top right) and the mean differences between GEOS-Chem and all MOZAIC profiles taken on 14 and 15 November 2004 (bottom).