EUROPEAN
ECONOMY
Economic Papers 512 | December 2013
Assessing the economic and budgetary
impact of linking retirement ages and pension
benefits to increases in longevity
Alexander Schwan, Etienne Sail
Economic and
European Commission
Directorate-General for Economic and Financial Affairs
Assessing the economic and budgetary impact of
linking retirement ages and pension benefits to
increases in longevity
Alexander Schwan, Etienne Sail
AbstractPolicy makers need to ensure long-term fiscal sustainability in the face of large demographic challenges as well as significant economic uncertainty in the wake of the financial and economic crisis. In this context, especially public pension expenditures represent a challenge for public finances.
A majority of Member States have adapted pension systems so as to put them on a more sustainable footing and enable them to weather the demographic changes that are set to take hold. However, further reforms are in many cases necessary.
This paper focuses on possible public pension expenditure reductions, sustainability and also adequacy gains that can be achieved when linking retirement ages with future increases in longevity. Multiple policy scenarios, covering different degrees of linkage, show that significant sustainability and adequacy improvements can be achieved when applying this policy approach consistently in national pension legislation.
The projected increases in public pension expenditures could almost be halved when fully linking retirement ages to life expectancy gains in the future. The expected decrease in the benefit ratio due to recent pension reforms could be diminished, based on a longer contributory period and higher accrued pension rights. Overall, during the period of 2010-2060, a cumulated average pension expenditure saving of around 7.5% of GDP could be achieved for the EU.
Even higher reductions in future pension spending would materialize with a rule that links pension benefits to longevity gains without adapting statutory retirement ages. Such a rule would allow for additional cumulated savings of around 5.3% of GDP for the EU. However, if people do not extend their working lives in order to maintain the level of pension benefits, serious adequacy problems may arise.
Under the assumptions of a convergence of all Member States to the EU average lifetime spent in retirement in the year 2010, the projected pension expenditure increase due to population ageing could even be more contained over the long-run in the EU as a whole.
To fully stabilize public pension expenditures, further reform measures on top of a retirement age or pension benefit link to gains in life expectancy need to be considered in most Member States.
JEL Classification: H55, J14, J26
Keywords: Ageing, Budgetary Impact, Economic Impact, Longevity, Link, Life Expectancy, Old Age, Older Workers, Pension, Pension Benefits, Pensioners, Quit Rates, Quitting, Retirement, Retirement Age.
Acknowledgements. The authors are economists working in the European Commission’s Directorate General for Economic and Financial Affairs. The views expressed in this paper are the responsibility of the authors alone and should not be attributed to the European Commission.
Contents
1. Introduction ... 7
2. Demographic trends, status quo of pension systems and adjustment mechanisms... 9
2.1. Demographic trends ... 9
2.2. Possible reforms to increase the sustainability of pension systems ... 11
3. Economic and budgetary impact of linking retirement ages and pension benefits to increases in longevity ... 19
3.1. Scenarios and methodology ... 19
3.1.1. Scenarios for linking early and statutory retirement ages to longevity gains .. 19
3.1.2. Methodology ... 20
3.2. Labour force effect ... 25
3.2.1. Current legislation ... 25
3.2.2. "100% shift scenario" ... 28
3.2.3. "66% shift scenario", "constant time in retirement scenario" and "EU convergence scenario"... 33
3.2.4. Old-age dependency ratios ... 35
3.3. GDP effect... 36
3.4. Pension expenditure effect ... 37
3.4.1. EU pension expenditure effect when linking retirement ages to gains in life expectancy... 38
3.4.2. EU pension expenditure effect when linking pension benefits to gains in life expectancy... 39
3.4.3. Pension expenditure effect in individual Member States... 40
3.4.3.1. Full retirement age link to longevity gains (100% shift scenario) ... 40
3.4.3.2. Linking pension benefits fully to gains in longevity (100% shift in pension benefits scenario)... 42
3.4.3.3. Convergence to EU average share of time spent in retirement (EU convergence scenario) 43 3.4.3.4. Cumulative savings ... 44
3.4.3.5. Additional savings potential when restricting early retirement and harmonising retirement ages ... 46
3.5. Public finance sustainability effect ... 51
3.6. Adequacy effect... 53
4. Summary and policy implications... 55
Annex I - Legislated pension reforms during the last 5 years with impact on statutory (early) retirement ages ... 57
Annex II - Sustainability factors in pension systems and links to life expectancy ... 61
Annex III – Methodological Annex ... 65
Annex IV – Detailed projection results... 75
1. Introduction
An ageing population raises important challenges for our societies and economies. Policy makers worry about how living standards will be affected as a shrinking number of workers has to provide for the consumption needs of a growing number of elderly dependents. Markets worry about overall fiscal sustainability and the ability of policy makers to address timely and sufficiently these challenges in several Member States. The seriousness of the challenge depends on how our economies and societies respond and adapt to these changing demographic conditions. Looking ahead, policy makers need to ensure long-term fiscal sustainability in the face of large demographic challenges as well as significant economic uncertainty. Especially public pension expenditures represent an increasing burden for public finances: the expenditure level amounts to more than 11% of GDP on average today, possibly rising to almost 13% in 2060 in the EU as a whole, however with large variations across Member States, as shown in the 2012 Ageing and Sustainability Reports.1
In the last decade, there has been considerable progress in reforming pension arrangements. A majority of Member States has adapted pension systems so as to put them on a more sustainable footing and enable them to weather the demographic changes that are set to take hold. However, further reforms are in many cases necessary and the financial and economic crisis has made the demographic changes harder to cope with. Ensuring fiscal sustainability requires time-consistent policies, which involves addressing expected budgetary imbalances due to an increasing magnitude of the cost of ageing. For countries with high projected increases in public pension spending, adjusting the statutory retirement age should be considered. A dynamic view needs to be established on the balance of life spent working and spent in retirement, moving beyond the out-dated 'exit signal' of 65 years of age which dates back more than 100 years in some cases.2 Increasing the retirement age preserves the sustainability of pension systems while allowing individuals for enhancing retirement incomes through longer working lives and the accrual of additional pension rights. This paper focuses on possible public pension expenditure reductions, pension adequacy gains and improvements in the long-term sustainability of public finances that can be achieved when linking statutory and effective3 retirement ages with future increases in life expectancy. It is
1
European Commission (DG ECFIN) and Economic Policy Committee (Ageing Working Group), 2012, 'The 2012 Ageing Report: Economic and budgetary projections for the 27 EU Member States (2010-2060)'; European Economy, No. 2/2012.
(http://ec.europa.eu/economy_finance/publications/european_economy/2012/pdf/ee2_en.pdf)
European Commission (DG ECFIN), 2012,"Fiscal Sustainability Report 2012", European Economy, No. 8/2012 2
When Bismarck introduced the old-age and invalidity pensions in Germany more than 120 years ago, in 1889, he initially set the retirement age at 70. In 1916 the retirement age was lowered to 65. See Haerendel, U., 2004,
Quellensammlung zur Geschichte der deutschen Sozialpolitik 1867 bis 1914, II. Abteilung: Von der kaiserlichen Sozialbotschaft bis zu den Februarerlassen Wilhelms II. (1881-1890), 6. Band: Die gesetzliche Invaliditäts- und Altersversicherung und die Alternativen auf gewerkschaftlicher und betrieblicher Grundlage, Darmstadt.
3
The “average effective retirement age” for a specific year is calculated as the weighted sum of each year of retirement ages (between the minimum and the maximum age of retirement) occurring in that year. The specific weights are based on the probability that a person will withdraw from the labour force at a specific age. Henceforth in this paper, the average effective retirement age and the average effective exit age from the labour force is assumed to be the same. In practice however, it is possible to leave the labour force before retiring, although in most cases those persons would be receiving a public benefit. A description of the simulation methodology is provided in the methodological annex III. For more details on the labour force projections, see also Carone G., 2005, ‘Long-term labour force projections for the EU25 Member States: a set of data for
assessing the impact of ageing’, DG ECFIN, European Economy, Economic Papers.
No. 235. Further general information about the calculation of the effective retirement age can also be found in
Vogler-Ludwig, K. and Düll, N., 2008, Analysis of the average exit age from the labour force – Final report, Study for the European Commission, DG EMPL, Munich.
thus a part of the three-pronged strategy for dealing with the long-term sustainability of public finances agreed by the 2001 Stockholm European Council.4
Multiple policy scenarios, covering different degrees of linkage between retirement ages and longevity gains, show that significant sustainability and adequacy improvements can be achieved when applying this policy approach in national pension legislation. Depending inter alia on the degree of linkage, accompanying measures such as specific active labour market policies would obviously have to be taken at the national level to ensure that not only the statutory but also the effective retirement age rises in line with future changes in life expectancy, as assumed in this paper.
Yet, reductions in pension spending and thus sustainability gains in the view of ageing populations could also be achieved by reducing pension benefits instead of increasing retirement ages or by closing the gap between early and statutory retirement ages. The potential effects of rules that link pension benefits to gains in life expectancy and that restrict early retirement options are thus assessed as well.
The paper is organised as follows: Chapter 2 describes current demographic trends, the status quo of pension systems and respective policy recommendations that could increase their sustainability. In chapter 3, the effect of a retirement age increase in line with increasing life expectancy is analysed. Also a pension benefit link to gains in life expectancy and the effects of a restriction in early retirement are assessed. Chapter 4 summarises the main findings of the paper and discusses potential policy implications. In the annex, detailed descriptions of latest pension reforms with an impact on the statutory (early) retirement age, an overview of countries with sustainability factors or retirement age links to life expectancy as well as the underlying methodologies to quantify the effects of postponed retirement are explained in detail.
4
The strategy to increase the long-term sustainability of public finances consists of i) reducing debt at a fast pace; ii) raising employment rates and productivity; and iii) reforming pension, health care and long-term care systems.
2. Demographic trends, status quo of pension systems and
adjustment mechanisms
2.1. Demographic trends
Due to expected dynamics of fertility, life expectancy and migration rates, the structure of the EU population is supposed to dramatically change in the coming decades.5While the overall EU population size is projected to be only slightly different in 2060 (517 million people) compared to 2010 (502 millions), there are large variances in population trends until 2060 across Member States. The strongest population growth is projected in Ireland (+46%), Luxembourg (+45%), Cyprus (+41%), the United Kingdom (+27%), Belgium (+24%) and Sweden (+23%), and the sharpest declines in Bulgaria 27%), Latvia 26%), Lithuania (-20%), Romania and Germany (both -19%). In 2010, the Member States with the largest population were: Germany (82 million), France (65 mn), the United Kingdom (62 mn), Italy (60 mn) and Spain (46 mn). In 2060, the United Kingdom would become the most populous EU country (79 mn), followed by France (74 mn), Germany (66 mn), Italy (65 mn) and Spain (52 mn).
The age structure of the EU population is also projected to change dramatically, with elderly people to account for an increasing share of the population. At the same time, the middle of the age pyramid becomes smaller until 2060 due to below natural replacement fertility rates. As a consequence, the shape of the population pyramid gradually changes, increasingly resembling a pillar (see Graph 1) . A similar development is projected for the euro area. The proportion of young people (aged 0-14) is projected to remain fairly constant by 2060 in the EU27 and the euro area (around 15%), while those aged 15-64 will become a substantially smaller share, declining from 67% to 56%. Those aged 65 and over will become a much larger share (rising from 18% to 30% of the population), and those aged 80 and over (rising from 5% to 12%) will almost become as numerous as the young population in 2060.
Graph 1 - Population pyramids (in thousands), EU27 and EA, in 2010 and 2060
Source: Commission services, Eurostat (EUROPOP2010). 5
Eurostat provides population projections for the whole EU up to 2060 (EUROPOP2010): http://epp.eurostat.ec.europa.eu/cache/ITY_OFFPUB/KS-SF-11-023/EN/KS-SF-11-023-EN.PDF
http://europa.eu/rapid/pressReleasesAction.do?reference=STAT/11/80&type=HTML. Figures are inter alia heavily depending on underlying migration assumptions, leading e.g. to the result that Germany is projected to become only the third most populous Member State, while the United Kingdom would become the most populous EU country.
As a result of these different demographic trends among age groups, the demographic old-age dependency ratio (i.e. people aged 65 or above relative to those aged 15-64) is projected to double from 26% to 52.5% in the EU as a whole up to 2060. This entails that the EU would move from having four working-age people for every person aged over 65 years to two working-age persons.
The effective economic old-age dependency ratio is another important indicator to assess the impact of ageing populations on budgetary expenditure, particularly on its pension component. This indicator is calculated as the ratio between the inactive elderly (65+) and the total employed population aged 15-64. The effective economic old-age dependency ratio is projected to rise significantly from around 39% in 2010 to 70% in 2060 in the EU (see Graph 2), assuming no policy changes in the future.6In the euro area, a similar increase is projected from 42% in 2010 to 72% in 2060. Across EU Member States, the effective economic old-age dependency ratio in 2060 is projected to range from less than 55% in Denmark, the Netherlands, United Kingdom and Ireland to more than 90% in Poland and Romania. For the latter two countries, also the biggest projected increases between 2010 and 2060 are observable (+61 p.p. and +70 p.p., respectively), while the lowest increase is projected for Denmark, United Kingdom and Sweden (all below 20 p.p.).
Graph 2 - Effective economic old-age dependency ratio – no policy change
Source: Commission services, EPC.
Note: Effective economic old-age dependency ratio defined as the inactive population aged
65 and above as a percentage of the employed population aged 15 to 64.
6
Figures based on labour force projections in European Commission (DG ECFIN) and Economic Policy Committee (Ageing Working Group), 2011, "The 2012 Ageing Report: Underlying assumptions and projection methodologies", European Economy, No. 4/2011. In these projections, as a general rule, actual unemployment rates are assumed to converge to NAWRU rates by 2015, and thereafter gradually decline towards country-specific historical minima. The latter are capped at 7.3%, which corresponds to the EU NAWRU average (based on the spring 2011 DG ECFIN's Economic Forecast), that is, if the historical unemployment rate minimum for a country is higher that the EU27 NAWRU average, actual unemployment rates will converge to the latter.
2.2. Possible reforms to increase the sustainability of pension systems
Without any further policy reaction to the projected demographic trends, public pension expenditures would rise dramatically in the future, as more and more people will be entitled to receive pensions for an increasing period of time. In fact, the ageing problem becomes even more severe when having in mind that demographic projections have tended to consistently underestimate longevity (gains) in the past (by an average of 3 years). Hence, they might also be at risk of underestimation in the future, e.g. due to better than expected medical technical progress or efficiency in treating specific illnesses.7As a consequence, an additional financial burden emerges if unexpected longevity gains force governments to pay for the public pension scheme even more than expected. These longevity risks should hence adequately be taken into account when adjusting pension legislations to cope with the ageing challenge. In that context, automatic adjustment mechanisms for specific pension system parameters – such as the retirement age – in line with gains in life expectancy would make pension systems robust to changes in longevity. The automatic mechanisms also increase the transparency of a pension system and avoid constant political discussions on the future shape of the pension system. Those discussions are in danger of rather focussing on the current political environment instead of the long-term sustainability perspective of the pension system with all potential implied risks that would need to be taken into account.In general, two ways to reform pension systems with the aim of increasing their sustainability can be distinguished, next to labour market policies that try to increase activity and employment of all age groups but especially of older people:
Eligibility-restricting reforms: In many cases, reforms are related to the abolishment or
restriction of early retirement schemes and other early-exit pathways, the increase in statutory retirement ages or the incentive to stay longer in the labour market on a voluntary basis, i.e. exiting labour markets beyond the legal (early) retirement age. All these measures are reflected in a lower level of the coverage of a pension system at a specific point in time, i.e. the number of actual pension benefit recipients as a share of the pensionable population at the statutory retirement age.
Generosity-reducing reforms: Reducing the generosity of pension benefits, e.g. by increasing
eligibility criteria for certain benefits, by decreasing pension accrual rates, by changing the pensionable earnings reference taken into account when calculating pension entitlements from a selection of best years to full career earnings or by limiting indexation and valorisation rules, can have a substantial decreasing or at least stabilising impact on public pension expenditure.8
7
For further information on imprecision of population forecasts and resulting longevity risks, see IMF, 2012, Global Financial Stability Report April 2012, The Financial Impact of Longevity Risk (http://www.imf.org/external/pubs/ft/gfsr/2012/01/pdf/c4.pdf). The IMF shows that an unexpectedly increased longevity of three years – in line with underestimations of longevity forecasts in recent decades – would lead to additionally cumulated pension costs of 50% of GDP (2010) by 2050 in advanced economies.
8
In the 2012 Ageing Report, the effect of eligibility- and generosity restricting reforms on public pension expenditures was assessed by analysing the different underlying expenditure drivers for the long-term public pension expenditure projections. Projections show diminishing coverage ratio and benefit ratio effects at the EU27 level on public pension expenditure between 2010 and 2060 of 2.9 p.p. and 2.7 p.p. of GDP, respectively, due to recent pension reform. Together with a diminishing effect of 0.8 p.p. of GDP due to projected employment increases, these components can however not fully counterbalance the increasing effect of 8.5 p.p. on public pension expenditures due to population ageing at the EU27 level. Further details on the decomposed public pension expenditure projection figures can be found in chapter 2 of the 2012 Ageing Report: European Commission (DG ECFIN) and Economic Policy Committee (Ageing Working Group), 2012, 'The 2012 Ageing Report: Economic and budgetary projections for the 27 EU Member States (2010-2060)', European Economy, No. 2/2012. (http://ec.europa.eu/economy_finance/publications/european_economy/2012/pdf/ee2_en.pdf)
Without having a direct decreasing impact on pension expenditures, the financial balance of a pension system could also be improved by a change in the contribution rate. Via higher contribution rates, higher incomes can be generated and redistributed by the state to cover expenditures to current pensioners. This especially holds for defined benefit (DB) pension systems. In (notional) defined contribution ((N)DC) pension systems, higher contribution will automatically lead to higher entitlements in the future, thus offsetting the positive short-term financing effect above. The main negative effect of higher contributions is however an increase in labour costs that could have an adverse impact on employment and economic growth.
The European Commission put forward in its Annual Growth Surveys 2011, 2012 and 2013 as well as its White Paper on adequate, safe and sustainable pensions several recommendations for further pension reforms steps to increase long-term sustainability. These recommendations are broadly in line with the above mentioned policy actions to decrease benefit and coverage ratios. The European Commission encourages Member States to:9
x align the retirement age with increases in life expectancy;
x restrict access to early retirement schemes and other early exit pathways;
x support longer working lives by providing better access to life-long learning, adapting work places to a more diverse workforce, and developing employment opportunities for older workers;
x equalise the pensionable age between men and women; and, x support the development of complementary private savings (2nd
and 3rd pillars) to enhance retirement incomes.
Also the country-specific recommendations (CSRs) as part of the European Semester 2012 and 2013 highlight the need for pension reforms to improve the long-term fiscal sustainability for several countries10. The link of the (statutory) retirement age to increases in life expectancy was pronounced in the 2012 CSRs (Belgium, Spain, Cyprus, Lithuania, Luxembourg, Malta, the Netherlands, Austria, Slovenia, Slovakia and Finland) and also the 2013 CSRs (Belgium, Czech Republic, Spain, France, Lithuania, Luxembourg, Malta, Austria, Slovenia and Finland)11. This type of pension reform involves not only the advantage of an expenditure reduction due to a lower coverage ratio and a proper recognition of longevity risks. It also forces people to work longer to become entitled for an old-age pension. As a consequence, also the effective retirement age is targeted to – at least partially – follow the increase of the statutory retirement age. This, in general, also leads to a higher accrual of individual pension entitlements. In the end, not only the sustainability of pension systems as well as of public finances in general can be improved, but also pension adequacy12.
9
Annual Growth Survey 2011: http://ec.europa.eu/europe2020/pdf/en_final.pdf Annual Growth Survey 2012:http://ec.europa.eu/europe2020/pdf/ags2012_en.pdf; Annual Growth Survey 2013: http://ec.europa.eu/europe2020/pdf/ags2013_en.pdf White Paper on pensions: http://ec.europa.eu/social/BlobServlet?docId=7341&langId=en 10
2012 Country-specific recommendations: http://ec.europa.eu/europe2020/making-it-happen/country-specific-recommendations/index_en.htm ; 2013 CSRs: http://ec.europa.eu/europe2020/making-it-happen/country-specific-recommendations/index_en.htm.
11
In the 2013 CSRs, a horizontally consistent language concerning the link of retirement ages to gains in life expectancy was adopted by the European Council for several Member States (Austria, Belgium, Czech Republic, Finland, France, Luxembourg, Malta and Spain): "Increase the effective retirement age by aligning retirement age or pension benefits to changes in life expectancy".
12
In this paper, a positive effect on adequacy is seen to be achieved via an improvement of the benefit ratio. For a general discussion on the adequacy of pensions including a more specific definition and respective thresholds, please refer to: European Commission, 2012, Pension adequacy in the European Union 2010-2050, Brussels (http://ec.europa.eu/social/BlobServlet?docId=7805&langId=en).
Especially in DB (and point) systems the positive effect on sustainability should be visible, as the overall reduction in expenditures due to later retirement is generally only partly offset by higher individual pension entitlements due to longer working lives. In pure (N)DC schemes, the overall effect on the scheme's finances should theoretically be neutral as the shorter period of pension payments should be outweighed by increased individual pension entitlements.13
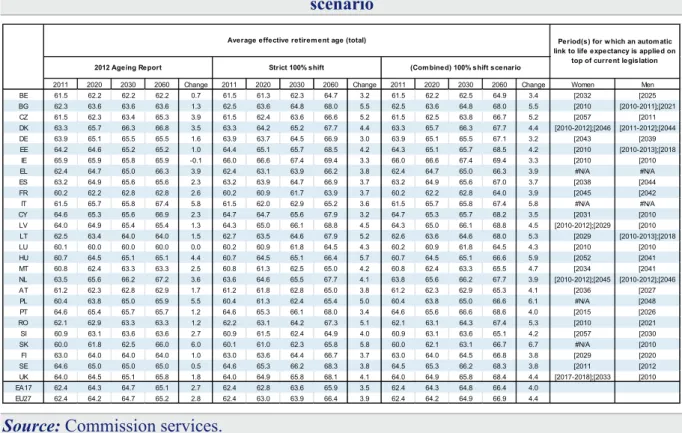
Table 1 shows the projected change in early and statutory retirement ages between 2010 and 2060 under current legislation as well as the projected change in the average effective retirement age, split by gender. As a result of recent reforms, statutory retirement ages for males and females will gradually converge for all Member States except for Bulgaria and Romania. Furthermore, statutory retirement ages will increase substantially until 2060 in almost every Member State, with major steps often taking place within the current and the next decade.14This is either due to legislated pension reforms discretionarily setting a specific retirement age in the future, or to the fact that Member States have indeed already introduced a connection between retirement ages and life expectancy in their legislations (Denmark, Greece, Italy, Slovakia, Cyprus and the Netherlands).15Yet, as can also be seen from Table 1, in most of the Member States, the rise in statutory retirement ages does not fully reflect the total expected increases in life expectancy at retirement.16 This especially holds for men, whereas for women a catching-up process is visible.
13
See also OECD, 2012, "Putting pensions on auto-pilot: automatic-adjustment mechanisms and financial sustainability, OECD pension outlook 2012, p.64, Paris.
14
Several countries have implemented pension reforms with an effect on statutory (early) retirement ages during the last couple of years. See corresponding box in Annex I. These reforms are supposed to have not only an increasing effect on the effective retirement age, but also a decreasing impact on pension expenditure and thus a positive impact on sustainability.
15
In Denmark depending on parliamentary decision. See also box on sustainability factors and retirement age links in pension systems in Annex II.
16
Age 65 for comparability reasons taken as an approximation to measure life expectancy at retirement in Table 1. In the scenario calculations in chapter 3, the change in life expectancy at the real statutory retirement age in 2010 (base year for 2012 Ageing Report) is taken as a reference (which obviously might diverge from the age of 65).
14 T ab le 1 -A ve rage e ff ec ti ve r et ir e m en t age , l if e e xp ec tan cy an d e ar ly/ st at u tor y r e ti re m en t age 2 0 1 1 2 0 3 0 2 0 6 0 2 0 1 1 2 0 3 0 2 0 6 0 2 0 1 0 2 0 3 0 2 0 6 0 2 0 1 0 2 0 3 0 2 0 6 0 2 0 1 0 2 0 3 0 2 0 6 0 2 0 1 0 2 0 3 0 2 0 6 0 2 0 1 1 2 0 3 0 2 0 6 0 2 0 1 1 2 0 3 0 2 0 6 0 B E 6 1 .5 6 2 .1 6 2 .1 6 1 .6 6 2 .3 6 2 .3 6 5 6 5 6 5 6 5 6 5 6 5 6 0 6 2 6 2 6 0 6 2 6 2 1 7 .5 1 9 .4 2 2 .3 2 1 .0 2 2 .9 2 5 .7 B G 6 3 .2 6 4 .7 6 4 .7 6 1 .5 6 2 .5 6 2 .5 6 3 6 5 6 5 6 0 6 3 6 3 6 3 6 5 6 5 6 0 6 3 6 3 1 4 .0 1 6 .6 2 0 .6 1 7 .1 1 9 .7 2 3 .6 C Z 6 2 .9 6 4 .3 6 5 .6 6 0 .1 6 2 .6 6 5 .1 6 2 y 2 m 6 5 y 6 9 y 4 m 5 8 y 8 m 6 4 y 8 m 6 9 y 4 m 6 0 6 0 6 4 y 4 m 5 5 y 8 m 6 0 6 4 y 4 m 1 5 .4 1 7 .7 2 1 .2 1 8 .8 2 1 .1 2 4 .5 D K 6 4 .2 6 7 .0 6 7 .2 6 2 .3 6 5 .5 6 6 .3 6 5 6 8 7 2 .5 6 5 6 8 7 2 .5 6 0 6 5 6 9 .5 6 0 6 5 6 9 .5 1 6 .9 1 9 .0 2 2 .0 1 9 .7 2 1 .9 2 5 .1 D E 6 4 .3 6 5 .7 6 5 .7 6 3 .5 6 5 .3 6 5 .3 6 5 6 7 6 7 6 5 6 7 6 7 6 3 6 3 6 3 6 0 6 3 6 3 1 7 .5 1 9 .5 2 2 .4 2 0 .7 2 2 .6 2 5 .4 E E 6 3 .8 6 5 .4 6 5 .4 6 4 .5 6 5 .0 6 5 .0 6 3 6 5 6 5 6 1 6 5 6 5 6 0 6 2 6 2 5 8 6 2 6 2 1 4 .2 1 6 .9 2 0 .9 1 9 .2 2 1 .6 2 4 .9 IE 6 5 .1 6 5 .1 6 5 .1 6 6 .7 6 6 .5 6 6 .6 6 6 6 7 6 8 6 6 6 7 6 8 6 5 6 5 6 5 6 5 6 5 6 5 1 7 .0 1 9 .1 2 2 .2 2 0 .2 2 2 .4 2 5 .5 E L 6 2 .5 6 3 .1 6 4 .0 6 2 .4 6 2 .9 6 3 .8 6 5 6 8 7 0 .7 6 0 6 8 7 0 .7 6 0 6 4 6 6 .7 5 5 6 4 6 6 .7 1 8 .0 1 9 .9 2 2 .6 2 0 .3 2 2 .0 2 4 .6 E S 6 2 .6 6 5 .3 6 5 .3 6 3 .9 6 5 .9 6 5 .9 6 5 6 7 6 7 6 5 6 7 6 7 6 1 6 3 6 3 6 1 6 3 6 3 1 8 .3 2 0 .2 2 2 .9 2 2 .2 2 3 .9 2 6 .3 F R 6 0 .1 6 2 .8 6 2 .8 6 0 .2 6 2 .8 6 2 .8 6 0 -6 5 6 2 -6 7 6 2 -6 7 6 0 -6 5 6 2 -6 7 6 2 -6 7 6 0 6 2 6 2 6 0 6 2 6 2 1 8 .6 2 0 .4 2 3 .0 2 2 .8 2 4 .4 2 6 .6 IT 6 1 .7 6 6 .1 6 7 .3 6 1 .4 6 5 .4 6 7 .5 6 5 y 4 m 6 7 y 9 m 7 0 y 3 m 6 0 y 4 m 6 7 y 9 m 7 0 y 3 m 6 4 y 9 m 6 7 y 3 m 6 4 y 9 m 6 7 y 3 m 1 8 .2 2 0 .1 2 2 .8 2 1 .8 2 3 .6 2 6 .1 C Y 6 5 .4 6 5 .4 6 5 .4 6 3 .8 6 3 .8 6 3 .8 6 5 6 5 * 6 5 * 6 5 6 5 * 6 5 * 6 3 6 3 6 3 6 3 6 3 6 3 1 7 .9 1 9 .8 2 2 .5 2 0 .1 2 2 .2 2 5 .3 L V 6 4 .3 6 5 .4 6 5 .4 6 3 .8 6 5 .3 6 5 .3 6 2 6 5 6 5 6 2 6 5 6 5 6 0 6 3 6 3 6 0 6 3 6 3 1 3 .6 1 6 .5 2 0 .6 1 8 .3 2 0 .8 2 4 .4 L T 6 3 .5 6 4 .3 6 4 .3 6 1 .7 6 3 .8 6 3 .8 6 2 .5 6 5 6 5 6 0 6 5 6 5 5 7 .5 6 0 6 0 5 5 6 0 6 0 1 3 .7 1 6 .4 2 0 .4 1 8 .5 2 0 .8 2 4 .2 L U 5 9 .6 5 9 .6 5 9 .6 6 0 .6 6 0 .5 6 0 .5 6 5 6 5 6 5 6 5 6 5 6 5 5 7 5 7 5 7 5 7 5 7 5 7 1 7 .5 1 9 .5 2 2 .4 2 1 .2 2 3 .3 2 6 .1 H U 6 1 .2 6 5 .3 6 5 .3 6 0 .3 6 4 .8 6 4 .8 6 2 6 5 6 5 6 2 6 5 6 5 6 0 6 5 6 5 5 9 6 5 6 5 1 4 .2 1 6 .9 2 0 .9 1 8 .3 2 0 .9 2 4 .6 M T 6 1 .3 6 4 .0 6 4 .0 6 0 .3 6 2 .6 6 2 .6 6 1 6 5 6 5 6 0 6 5 6 5 6 1 6 1 6 1 6 0 6 1 6 1 1 7 .1 1 9 .2 2 2 .2 2 0 .3 2 2 .4 2 5 .4 N L 6 4 .6 6 7 .2 6 8 .1 6 2 .5 6 5 .2 6 6 .2 6 5 6 7 y 9 m 6 9 y 9 m 6 5 6 7 y 9 m 6 9 y 9 m 6 5 6 7 y 9 m 6 9 y 9 m 6 5 6 7 y 9 m 6 9 y 9 m 1 7 .6 1 9 .5 2 2 .3 2 1 .0 2 2 .9 2 5 .6 A T 6 1 .8 6 3 .0 6 3 .1 6 0 .6 6 2 .5 6 2 .8 6 5 6 5 6 5 6 0 6 3 .5 6 5 6 2 6 2 6 2 6 0 6 2 6 2 1 7 .7 1 9 .6 2 2 .4 2 1 .0 2 2 .9 2 5 .6 P L 6 2 .2 6 6 .0 6 6 .0 5 8 .8 6 4 .0 6 5 .8 6 5 6 7 6 7 6 0 6 4 .8 6 7 -6 5 6 5 5 5 6 2 6 2 1 5 .0 1 7 .5 2 1 .2 1 9 .2 2 1 .5 2 4 .8 P T 6 4 .5 6 5 .8 6 5 .8 6 4 .7 6 5 .7 6 5 .7 6 5 6 5 6 5 6 5 6 5 6 5 5 5 5 5 5 5 5 5 5 5 5 5 1 7 .2 1 9 .2 2 2 .1 2 0 .5 2 2 .4 2 5 .1 R O 6 3 .1 6 4 .0 6 4 .0 6 1 .2 6 2 .6 6 2 .6 6 4 6 5 6 5 5 9 6 3 6 3 5 9 6 0 6 0 5 4 5 8 5 8 1 4 .2 1 6 .9 2 0 .8 1 7 .3 2 0 .0 2 3 .8 S I 6 2 .1 6 3 .8 6 3 .8 5 9 .7 6 3 .5 6 3 .5 6 3 6 5 6 5 6 1 6 5 6 5 5 8 6 0 6 0 5 6 y 8 m 6 0 6 0 1 6 .5 1 8 .7 2 1 .9 2 0 .3 2 2 .4 2 5 .3 S K 6 1 .4 6 2 .6 6 6 .2 5 8 .7 6 2 .4 6 5 .9 6 2 6 4 6 8 5 7 .9 6 4 6 8 6 0 6 1 .9 6 5 .7 5 5 .9 6 1 .9 6 5 .7 1 4 .3 1 6 .9 2 0 .8 1 8 .1 2 0 .6 2 4 .3 F I 6 3 .4 6 4 .1 6 4 .1 6 2 .6 6 3 .9 6 3 .9 6 3 -6 8 6 3 -6 8 6 3 -6 8 6 3 -6 8 6 3 -6 8 6 3 -6 8 6 2 6 2 6 2 6 2 6 2 6 2 1 7 .4 1 9 .4 2 2 .3 2 1 .4 2 3 .2 2 5 .8 S E 6 5 .1 6 5 .6 6 5 .6 6 4 .0 6 4 .4 6 4 .4 6 1 -6 7 6 1 -6 7 6 1 -6 7 6 1 -6 7 6 1 -6 7 6 1 -6 7 6 1 6 1 6 1 6 1 6 1 6 1 1 8 .3 2 0 .1 2 2 .7 2 1 .2 2 3 .1 2 5 .7 U K 6 4 .7 6 4 .9 6 5 .8 6 3 .3 6 5 .2 6 5 .8 6 5 6 6 6 8 6 0 6 6 6 8 6 5 6 6 6 8 6 0 6 6 6 8 1 8 .1 2 0 .0 2 2 .8 2 0 .8 2 2 .8 2 5 .7 E A ** * 6 2 .5 6 4 .8 6 5 .1 6 2 .2 6 4 .6 6 5 .1 6 4 .5 6 6 .4 6 7 .1 6 3 .2 6 6 .4 6 7 .1 6 1 .8 6 3 .1 6 3 .8 6 0 .7 6 3 .0 6 3 .8 1 7 .9 1 9 .8 2 2 .6 2 1 .5 2 3 .3 2 5 .9 E U 2 7 ** * 6 2 .9 6 4 .9 6 5 .3 6 2 .0 6 4 .5 6 5 .1 6 4 .4 6 6 .2 6 7 .1 6 2 .2 6 5 .9 6 7 .0 6 2 .2 6 3 .4 6 4 .4 6 0 .2 6 3 .1 6 4 .1 1 7 .3 1 9 .4 2 2 .4 2 0 .8 2 2 .8 2 5 .6 E a rl y r e ti re m e n t a g e -fe m a le s L if e e x p e c ta n c y a t a g e 6 5 m a le s L if e e x p e c ta n c y a t a g e 6 5 f e m a le s Ef fe ct iv e re ti re m e n t a g e - m a le s * * Ef fe ct iv e re ti re m e n t a g e - fe m a le s * * S ta tu to ry r e ti re m e n t a g e -m a le s S ta tu to ry r e ti re m e n t a g e -fe m a le s E a rl y r e ti re m e n t a g e -m a le s S ou rc e: C om m is si on s er vi ce s, E ur os ta t (E U R O P O P 2010) . N ot e: * R ec ent ly l eg is la te d a ut om at ic l ink of r et ir em ent a g es t o l if e ex pe ct anc y f or C y pr us st il l t o be qua nt if ie d in t er m s of f ut ur e r et ir em ent age s. ** F ig u re s fo r e ff ec ti ve r et ir em ent a g es a re p rox ie d b y pr oj ec ti ons f or ef fe ct ive e x it a g es f rom t he l abour m ar ke t ba se d on C om m is si on s er vi ce s (D G E C F IN ) C ohor t S im ul at ion M ode l ( C S M ) (r ef er en ce a g e g roup 50 -74) a nd E U R O P O P 2010. F ig ur es a re s li g ht ly di ve rg ing f rom t he 2012 A ge ing R epor t due t o a d if fe re nt r ef er en ce a g e g ro up ( 50-70 i n t he 2012 A ge ing R epo rt ). D at a not up da te d f or non-pe er r evi ew ed c ount ri es ( e. g . S pa in a nd C y pr us ) w it h r ec ent ly l eg is la te d i nc re as es i n s ta tut or y r et ir em ent a ge s a nd/ or r ef or m s w it h ef fe ct s on e ff ec ti ve r et ir em ent age s ( S ta tus M ay 2013 ). ***: P opul at ion-w ei g ht ed a ve ra ge s. F o r c ount ri es w it h s ta tut or y r et ir em ent a ge c or ri dor s, t he m edi an of t he c or ri do r ha s be en t ake n i nt o a cc ount .
Moreover, almost all countries, average effective retirement ages are lower than the respective statutory retirement ages and a gap is projected to remain in the long-run.17 This is often related to existing early retirement schemes, alternative early-exit pathways such as disability schemes or other government measures that provide pension income before reaching the statutory retirement age threshold. As shown in Table 1, the gap between early retirement ages and statutory retirement ages is in several cases quite substantial (e.g. in Belgium, France, Luxembourg or Austria).
One way to increase the effective retirement age would hence be to reduce incentives to leave the labour market early. This could be done e.g. by increasing early retirement ages or by higher early retirement penalties as well by increasing employment opportunities for older workers or by giving bonuses for late retirement. Such incentives can also be created by introducing flexible retirement ages in a retirement age corridor (in place in France, Finland and Sweden), with higher pension linked to later retirement. However, evidence suggests that a huge share of persons will choose for the earliest possible retirement option also under flexible retirement arrangements, especially if pension entitlements are felt to be sufficient enough by potential retirees.18As can be observed in Table 1, the average effective retirement age for France and Finland is close to the lower end of the retirement age corridor, even though later retirement would be more favourable in terms of pension entitlements.
In general, this might also be related to the general attitude among European citizens with respect to the individual retirement decision. A recent Eurobarometer survey shows that the majority (70%) of European working citizens expect to be capable of doing the work they do currently at least until they are aged 60 years.19However, only 42% expect that they could go on to 65 years. Moreover, almost 1/5 of the respondents think that they will not be capable of continuing past the age of 59 years. The average age up to which people expect that they can do their current job is at a rather low level of 61.7 years. Moreover, six out of ten respondents believe that the retirement age does not need to be increased in the future. Only a third of the asked people believe that the retirement age needs to increase by 2030.
Many Member States (e.g. Czech Republic, Germany, France, Finland, Italy, Portugal and Sweden) have thus introduced automatic adjustment mechanisms to pension benefit levels related to changes in life expectancy, in order to offset the fiscal impact of ageing populations on pension systems (see Table 2).20
These “sustainability factors” or "adjustment coefficients” are taken into account in the calculation mechanism that determines either the exact amount of pension entitlements or the specific contribution period required to be entitled for a full pension. The factors change the 17
Due to a lack of availability of actual and projected national administrative data on effective retirement ages, figures are proxied by projections for the average exit ages from the labour market as a product of the Commission services (DG ECFIN) Cohort Simulation Model (CSM) using country-specific exit probabilities from the labour market (see Table 1). Figures are slightly diverging from the ones published in the 2012 Ageing Report due to a different reference age group (50-74 in this paper vs. 50-70 in the 2012 Ageing Report). A description of the simulation methodology is provided in the methodological annex III. For more general details, see also Carone G., 2005, ‘Long-term labour force projections for the EU25 Member States: a set of data for assessing the impact of ageing’, DG ECFIN, European Economy, Economic Papers No. 235.
18
See also OECD, 2011, "Linking pensions to life expectancy", Pensions at a Glance 2011: Retirement-Income Systems in OECD and G20 Countries, p.99, Paris and Barr, Nicolas, 2013, "The pension system in Finland: Adequacy, sustainability and system design'", Evaluation of the Finnish Pension System / Part 1, p.74f. Finish Centre for Pensions, Eläketurvakeskus, Finland.
19
See TNS Opinion & Social (2012), Active ageing, Special Eurobarometer 378, European Commission, Brussels.http://ec.europa.eu/public_opinion/archives/ebs/ebs_378_en.pdf
20
See also OECD, 2012, "Putting pensions on auto-pilot: automatic-adjustment mechanisms and financial sustainability, OECD pension outlook 2012, Chapter 2, Paris.
size of the pension benefit, e.g. depending on expected demographic changes such as life expectancy at the time of retirement or changes in the ratio between contributions and pensions.21 Also the introduction of a closer link between pension contributions and the resulting pension benefits, as expressed in a shift from DB or point systems to NDC systems (done in Italy, Latvia, Poland, Sweden and Greece for the supplementary pension scheme) can be seen as a sustainability enhancing factor.
Table 2 – Legislated sustainability factors in EU Member States
Country Sustainability factor Retirement age linked to life
expectancy Germany X Finland X Spain X Italy X X France X Latvia X Poland X Portugal X Sweden X Norway X Czech Republic X Denmark X* Greece X X Netherlands X Slovakia X Cyprus X
*: Depending on parliamentary decision. Source: Commission services.
Though adjusting pension benefit would certainly contribute strongly to the sustainability of a pension system, this could lead to potential risks for pension adequacy in a long-term perspective. People do not necessarily show the willingness to work longer than required even though this might be intended by policy makers and would result in substantially higher pension entitlements. As said above, there rather seems to be a tendency for people to leave the labour market as soon as possible when given the choice.22 Hence, in case individual retirement decisions are not changed, a sustainability factor that adjusts pension benefits can result in severe reductions of individual pension entitlements. In turn, this might threaten the viability of reforms aiming at reducing pension entitlement.
Pension expenditure reductions as well as employment and pension adequacy gains might thus potentially be better achieved when longer working lives are required for a pension. By linking early and statutory retirement ages to increases in life expectancy, the age threshold to be legally entitled to an early or full pension is postponed. This would require that the conditions for accumulating pension rights are adapted too. People thus can enhance retirement incomes through longer working lives and the accrual of additional pension rights. Moreover, such a retirement age link to life expectancy respects the fact that a more dynamic view on the balance of life spent working and spent in retirement must be established due to increased longevity.
It is obviously always possible to increase retirement ages discretionarily over time. Yet, countries generally face considerable political difficulties and resistance when they are implementing changes to their pension systems to prepare them for the challenges of an ageing population. Moreover, politicians might not adequately respond to the high longevity 21
See also box on sustainability factors and retirement age links in pension systems in Annex II. 22
risks – based on past underestimations of gains in life expectancy23 – comprised in pension systems and their underlying expenditure effects. Instead, they would rather take into account the current political environment and the connected political risks when debating pension reform options.
It is thus important to introduce automatic links of the statutory retirement age to the anticipated – but possibly underestimated – changes in longevity over the medium- and long-term in the national pension legislation (or an automatic adjustment of pension benefits, if preferred). This would avoid recurrent 'hard' negotiations at different points in time, when the longevity gains have materialized (and potentially turned out to be higher than expected)24. An automatic adjustment mechanism also helps to increase the transparency and credibility of a pension system as well as the trust of the population in it. Even if the finally legislated variant of an automatic retirement age adjustment rule only leads to small increases of the retirement age, this can turn out to be the better policy approach to longevity risks in pension systems instead of the rather unpredictable expectation of a political decision to discretionarily increase the retirement age in the future.
The following section provides an in-depth analysis of the policy measure of an automatic retirement age link to longevity gains as well as its economic and budgetary effects. Also a pension benefit link to gains in life expectancy and the effects of a restriction in early retirement are assessed.
23
See footnote 7. 24
See also Barr, Nicholas and Diamond, Peter, 2008, Reforming pensions, Principles and policy choices, Chapter 5, Oxford University Press and OECD, 2012, "Putting pensions on auto-pilot: automatic-adjustment mechanisms and financial sustainability", OECD Pension Outlook 2012, Chapter 2, Paris.
3. Economic and budgetary impact of linking retirement ages and
pension benefits to increases in longevity
3.1. Scenarios and methodology
3.1.1. Scenarios for linking early and statutory retirement ages to longevity gains
To assess the potential impact of an EU-wide retirement age link to gains in life expectancy on the sustainability of pension systems and the adequacy of pension provision, several policy scenarios are applied in a uniform manner for all EU Member States. Current early and statutory retirement ages (2010 as a base year25) are increased up to 2060 (fully/partially) in line with country-specific increases in life expectancy and then compared to the 2012 Ageing Report projection results used as a reference scenario (referred to as "2012 Ageing Report baseline scenario")26. The following alternative scenarios are investigated:
x A shift of the current early/statutory retirement age fully (100%) in line with the increase in life expectancy at retirement (referred to as "100% shift scenario").
x A shift of the current early/statutory retirement age 66% in line with the increase in life expectancy at retirement (referred to as "66% shift scenario").
Under the "shift" scenarios, the current country-specific gaps between early and statutory retirement ages (2010 as a base year) remain unchanged. For some Member States there is hence an important extra lever to potentially increase even further the average effective retirement age by restricting early retirement schemes (as recently legislated e.g. in Belgium, Hungary and Spain).
It may be a strong assumption for retirement ages to increase in (partial of full) proportion to life expectancy gains across all Member States in the same way. One could rather expect retirement ages to converge, that is, to increase more in countries that currently have lower retirement ages or rather low shares of lifetime spent in retirement. Conversely, retirement ages are likely to increase less in countries with already relatively high statutory or effective retirement ages (see again Table 1) and/or a rather low share of (adult) lifetime spent in retirement.27 Moreover, one could think of a situation in which the country-specific share of (adult) lifetime currently spent in retirement would stay constant over time. This is why two additional scenarios are simulated for which the effective retirement age instead of the statutory one is considered:
25
For the scenarios with a (partial) shift of the early/statutory retirement age, the change in life expectancy at the statutory retirement age in 2010 (base year for 2012 Ageing Report) is taken as a reference. The link to the resulting gains in life expectancy is applied both to 2010 statutory and 2010 early retirement ages whose existing gap at that point in time is kept constant over the whole projection horizon. More details are provided in the methodological annex III.
26
After the publication of the Ageing Report, figures for Belgium, Bulgaria, Czech Republic, Denmark, Hungary, Latvia, Netherlands, Poland and Slovakia have been updated, to be taken into account in the budgetary surveillance exercise during the 2013 European Semester. EU averages have changed accordingly. Aside from these modifications, the demographic and macroeconomic scenarios in this paper are the same as in the 2012 Ageing Report and outturns since then have not been taken into account.
27
The share of lifetime spent in retirement is determined by dividing life expectancy at retirement (effective retirement age at specific point in time) by the sum of life expectancy at retirement and the effective retirement age.
x An increase in the effective retirement age to keep the current share of lifetime spent in retirement constant over the period 2010-2060 (referred to as "constant time in retirement scenario").
x An increase in the effective retirement age to converge gradually towards the 2010 average EU27 share of lifetime spent in retirement (referred to as "EU convergence scenario") by 2060.
3.1.2. Methodology
Several facts and assumptions as well as caveats are taken into account and thus highlighted for the simulated policy scenarios:
x Legislated reforms explicitly taken into account: The link of current statutory and early retirement ages (2010 as a base year) with changes in life expectancy is in a first step strictly applied (referred to as "strict shift" results) irrespective of already legislated future increases in early/statutory retirement ages that are part of the 2012 Ageing Report projections. Especially in the short- and medium-run, legal retirement ages might thus be increasing faster under current legislation than under the simulated scenarios. As a consequence, also the projected year-over-year impact on the labour force – and especially on the effective retirement age – might in some cases be higher in the 2012 Ageing Report projections than under the simulated scenarios during that time. Thus, in a second step, a combination of the higher effective retirement age outcome between the 2012 Ageing Report projection and the respective simulation scenario is assumed at every point in time over the projection horizon (referred to as "combined" results). Under this approach, already legislated reforms are explicitly taken into account in the analysis. The combined projection is then later on applied for the pension expenditure projections (for a more detailed description, see box 1 below). x Effect of retirment age increases on the labour market: The extension of working lives
due to an increase in the retirement age28 increases total labour supply in a proportional manner, thus increasing employment (whereas the structural unemployment remains unchanged in comparison to the 2012 Ageing Report) as well as GDP29 and reducing the number of pensioners.30 Under the projection methodology, , the effective retirement age is supposed to follow very closely the changes in the statutory retirement age under the shift scenarios. This is because the exit probabilities distribution is progressively shifted to higher ages so that the exit probabilities at each single age are moved (partially) in line with gains in life 28
The extension of working lives is done by either a parallel shift of current labour market exit probabilities by single year and sex to higher ages ("shift" scenarios) or by adjusting the exit probabilities distribution to achieve a target effective retirement age ("constant time spent in retirement" and "EU convergence" scenarios).
29
Total factor productivity, the NAWRU and the capital stock remain unchanged in comparison to the 2012 Ageing Report. GDP increases thus solely due to an increased labour supply component. A potential increase in labour productivity in the long-run is nevertheless at least partially captured by the country-specific benefit ratio elasticity due to prolonged working lives. See methodological annex III for more details.
30
Labour force calculations are based on the Cohort Simulation Model (CSM) of the European Commission services (DG ECFIN). For a detailed presentation of the simulation methodology, see the methodological annex III. For a general description of long-term labour force projections with the CSM, see also Carone G., 2005,
‘Long-term labour force projections for the EU25 Member States: a set of data for assessing the impact of ageing’, DG ECFIN, European Economy, Economic Papers No. 235. The underlying assumptions for the 2012
Ageing Report can be found in European Commission (DG ECFIN) and Economic Policy Committee (Ageing Working Group), 2011, "The 2012 Ageing Report: Underlying assumptions and projection methodologies", European Economy, No. 4/2011.
expectancy. Consequently, the country specific gaps between early and statutory retirement ages as observed in the base year 2010 remain unchanged. Needless to say, this is a strong assumption since it is implicitly assumes that all legal and institutional settings (e.g. contributory period) will move in line with changes in life expectancy. This also includes that changes in life expectancy are spent in good health since exit probabilities are not adjusted to incorporate higher exits due to disability. The simulated reform measures would need to be underpinned by proper active ageing and labour market measures to ensure there are sufficent opportunities as well as incentives to work longer. Potential increases in expenditures for alternative early exit pathways from the labour market (such as higher disability pension expenditures) are not explicitly modelled.31
Box 1: Effective retirement age projections under the simulation scenarios
An example of the applied assumptions for the effective retirement age projections in the simulation scenarios is presented in Graph 3. The average effective retirement age projections for women in Austria under the 2012 Ageing Report baseline scenario as well as under the "100% shift scenario" are displayed for the period 2010-2060. Up to 2036, the effective retirement age is projected to increase stronger under current legislation as covered by the 2012 Ageing Report (black dashed line) in comparison to the simulation results when the 2010 female statutory retirement age in Austria (60) is 100% linked to gains in life expectancy ("strict shift 100%", red dotted line). This is due to the fact that the female statutory retirement age in Austria is legislated to increase from 60 to 65 up to 2033. Afterwards, no further increase in the statutory retirement age for women is legislated. Consequently, the continuing shift of the female retirement age under the simulated scenario leads to a higher effective retirement age in comparison to the 2012 Ageing Report results from 2036 onwards until the end of the projection horizon.
In the "100% shift scenario" simulation (and also the other simulations), a combination of the highest effective retirement age outcome between the 2012 Ageing Report scenario and the strict application of the 100% shift of current legal retirement ages is assumed at every point in time over the projection horizon (combined shift scenario, blue line). The combined projections are later on taken as a basis for the simulated pension expenditure projections.
31
It is thus assumed that the probability of entry into disability pensions as present in the base year stays constant. If the probability was rising with higher ages when linking statutory retirement ages with gains in life expectancy, disability pension expenditures would probably increase in case pension accrual for disability pensions was linked to income and pension contributions. A counterbalancing effect would however be achieved due to a lower number for (potentially higher) old-age pensions. Even though not explicitly modelled, the disability pension effect should nevertheless at least partially be captured by the country-specific benefit ratio elasticity due to prolonged working lives. See methodological annex III for more details.
Graph 3 – Average effective retirement age in Austria (women)
Source: Commission services.
Note: Figures for effective retirement ages are proxied by projections for effective exit ages
from the labour market based on Commission services (DG ECFIN) Cohort Simulation Model (CSM) (reference age group 50-74) and EUROPOP2010. Figures are slightly diverging from the ones published in the 2012 Ageing Report due to a different reference age group (50-70 in the 2012 Ageing Report).
In the example of Austria, this means that from 2036 onwards, the exit probabilities distribution as projected in the 2012 Ageing Report for that year (representing the expected steady state of the pension system at that point in time) is progressively shifted fully in line with gains in life expectancy (as described in Annex 3, section 5.1). The combined simulation (blue line) results in a slightly higher average effective retirement age by 2060 compared to the strict continuous shift of the 2010 exit probability distribution in line with life expectancy gains (red line), as it takes already into account a higher labour market participation of older women up to 2036 due to the female retirement age increase to 65 in the medium-run. This change in the exit probabilities distribution between 2010 and 2036 is however not incorporated in the strict shift which keeps the 2010 exit probabilities distribution unchanged.
x Benefit ratio effect: The benefit ratio (calculated as the average pension divided by the economy-wide average wage) is increased due to higher pension contributions based on longer working lives. The average pension itself is also increasing in line with increased GDP growth. To measure how average pension benefits are affected by a prolonged working life due to a link of retirement ages to longevity gains in each Member States, the 2012 Ageing Report baseline scenario is compared with the 2012 Ageing Report alternative scenario in which the participation rate (and also the employment rate) of older workers (55-64) is higher ("higher older workers employment scenario"). This scenario is used because an increase in the retirement age as simulated in the modelled scenarios of this paper indirectly leads to an increase in employment of older workers. Hence, the resulting benefit ratio effect can be taken as a good modelling approximation to calculate the benefit ratio effect of a retirement
age link to life expectancy.32 It is assumed that increases in the benefit ratio due to longer working lives are not restricted e.g. by a cap based on e.g. a full contribution period. The 100% shift scenario is however also run separately with constant benefit ratios to show pure sustainability effects (see also section 1).
x Effect on public pension expenditures and NDC systems: The basis for public pension expenditures are the projections as reported in the 2012 Ageing Report.33Total public pension expenditures in the simulation scenarios are calculated according to the changed average pension per projection year multiplied by the decreased number of pensioners due to postponed retirement. For countries that are mainly based on NDC pension systems (Italy, Latvia, Poland and Sweden), the overall effect on the scheme's finances should theoretically be neutral as the shorter period of pension payments is fully offset by increased individual pension entitlements due to longer working lives.34 For simplicity reasons, the change in pension expenditures in comparison to the 2012 Ageing Report is thus set to be 0 when including potential benefit ratio increases due to longer working lives under the rules linking retirement ages to longevity gains. x Macro- vs. micro-level: A uniformly applied macro-level approach with fixed
assumptions for all Member States does obviously not provide sufficient possibilities of capturing all country-specific micro-level details in individual pension when modelling a retirement age increase in line with longevity gains systems (e.g. increasing disability pension expenditures or full contributory periods). Consequently, individual specificities such as increased accrual rates beyond a certain contributory period are not explicitly considered in the scenarios. They are nevertheless at least partially captured by the country-specific benefit ratio elasticity due to prolonged working lives35.
x Expenditures effects on other age-related items: Expenditures on other age-related items (health care, long-term care, education and unemployment benefits) are supposed to evolve in line with the 2012 Ageing Report. For simplicity reasons, it is thus assumed that the simulated increases in retirement ages have no impact on other expenditures (neither directly or via the GDP effect), such as health care expenditures or unemployment benefits that potentially could occur.36 Overall sustainability figures are thus calculated according to the total cost of ageing under the different scenarios, thereby purely taking into account updated pension expenditure figures although the expected resulting higher GDP growth and higher unemployment could result in 32
In the 2012 Ageing Report, benefit ratio increases are modelled by Member States in their national models and partially take into account changes in wage profiles, disability prevalence or average job tenure (see methodological annex III for more details).
33
European Commission (DG ECFIN) and Economic Policy Committee (Ageing Working Group), 2012, 'The 2012 Ageing Report: Economic and budgetary projections for the 27 EU Member States (2010-2060)', European Economy, No. 2/2012.
(http://ec.europa.eu/economy_finance/publications/european_economy/2012/pdf/ee2_en.pdf)
After the publication of the 2012 Ageing Report, updated pension projection figures have been peer-reviewed and endorsed for several countries (Belgium, Bulgaria, Czech Republic, Denmark, Latvia, Hungary, the Netherlands, Poland and Slovakia) by the EPC. Updated figures are thus taken into account (cut-off date: April 2013).
34
See OECD, 2012, "Putting pensions on auto-pilot: automatic-adjustment mechanisms and financial sustainability, OECD pension outlook 2012, p.64, Paris.
35
. See methodological annex III for more details. 36
Next to the pure increase in the statutory retirement age, the major challenge for the EU Member States is obviously to create the conditions for older workers to live and work longer, healthy, active and prosper to successfully seize the opportunity to make the EU economies sustainable in the long-term. Retirement age increases thus have to be underpinned by adequate active ageing strategies.
slightly higher health care (through the income elasticity effect) and unemployment benefits expenditures.
3.1.3. Scenario for a pension benefit link to gains in life expectancy
Another scenario tries to assess the budgetary impact of a rule that links pension benefits (downward) to longevity gains (100%) without adapting early and statutory retirement ages. Technically, this scenario is run as the "100% shift scenario", but under the assumption that the benefit ratios as projected in the 2012 Ageing Report for the years 2010-2060 are kept constant. This "100% shift in pension benefits scenario" therefore illustrates the reform option of reducing the pension benefit, which is in part offset by an 'incentive response' of persons to work longer. A scenario where the pension benefit is reduced, but without dynamic 'incentive effects' on labour force participation, would in all likelihood show an even larger decline in pension spending vs. the baseline (2012 Ageing Report). Moreover, it would not entail an improvement in the pension benefit ratio compared with the baseline.
For example, in a DB system, pension benefits (PB) are the result of a product between the contributory period (C) and an average yearly accrual rate (a): PB= C x a. Linking retirement ages to gains in life expectancy has an increasing effect on the contributory period (C) and thus also on the overall pension benefits (PB). Linking the accrual rate (a) to life expectancy reduces (a) over time. Thus, an equivalent increase in the contributory period (C) is needed, in order to keep pension benefits at least constant. There is hence a financial incentive to stay longer on the labour market and thus to retire later (whereas under a retirement age link to life expectancy, incentives are very strong to work longer.
3.2. Labour force effect
3.2.1. Current legislationCurrent effective retirement ages vary significantly between EU Member States. Thus, they are generally in differing positions to address their sustainability challenges through reforms that would postpone retirement: in 2011, Luxembourg and France showed the lowest effective retirement ages, while the highest exit ages were observable in Ireland, Sweden and Cyprus (seeGraph 4).
Graph 4 - Average effective retirement age in 2011
Source: Commission services.
Note: Projections for effective retirement ages based on Cohort simulation model (CSM)
projections for the average exit age from the labour market (reference age group 50-74) and EUROPOP2010 (Figures are slightly diverging from the 2012 Ageing Report due to a
different reference age group (50-70 in the 2012 Ageing Report)) .
In the absence of additional policy measures aimed at postponing retirement37– like a change in the statutory retirement age or other encouragements for older workers to remain longer in the labour market – only a moderate increase in effective retirement ages (measured by the average exit age from the labour market) over the next 50 years is projected (see Table 5
below and Table 1above).
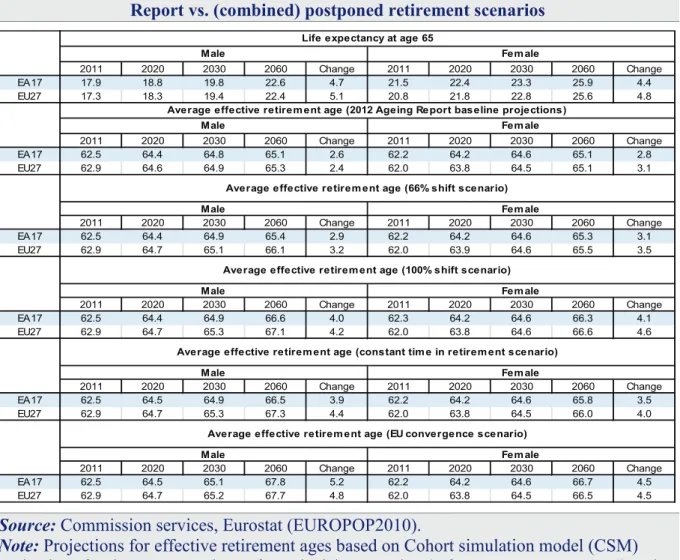
The average EU effective retirement age as projected in the 2012 Ageing Report would increase from 62.9 in 2011 to 65.3 years in 2060 for men (+2.4) and from 62.0 to 65.1 for women (+3.1). In the euro area, comparable increases are observable (men: 62.5 in 2011, 65.1 in 2060 (+2.6); women: 62.2 in 2011, 65.1 in 2060 (+2.8)). A large part of effective retirement age increase is projected to be achieved in the next two decades (EU: 64.9 for men and 64.5 for women in 2030; euro area: 64.8 for men and 64.6 for women), due to implemented pension reforms that inter alia lead to a gradual increase of statutory retirement ages or restrictions in early retirement. The EU average statutory retirement age reflecting current national legislation is increasing for men from 64.4 in 2011 via 66.2 in 2030 to 67.1 in 2060 (+2.7) (see Table 4). For women, the increase is even more remarkable: from 62.2 in 2010 via 65.9 in 2030 to 67.0 in 2060 (+4.8) (see Table 1 for country-specific details). In the 37
On top of already legislated changes of early and statutory retirement ages to be phased in over time. See Annex I for an overview of respective reforms in recent years.
euro area, the average statutory retirement age increases from 64.5 in 2011 to 67.1 in 2060 for men (+2.6) and from 63.2 in 2011 to 67.1 in 2060 for women (+3.9). The generally larger increase of statutory retirement ages for women is mainly due to a gradual harmonisation of retirement ages for women with those for men in the future. The consequently projected higher labour market participation of older women thus also leads to a generally larger increase of effective retirement ages for women in comparison with men.
At the same time, it should be noted that, according to the EUROPOP2010 demographic projections, the remaining life expectancy at age 65 is expected to increase in the EU from 17.3 years in 2011 to 22.4 in 2060 for men (+5.1) and from 20.8 in 2011 to 25.6 years in 2060 for women (+4.8). In the euro area, life expectancy at age 65 increases from 17.9 years in 2011 to 22.6 years in 2011 for men (+4.7) and from 21.5 years in 2011 to 25.9 years in 2060 for women (+4.4). Hence, only about half of the projected increase in life expectancy at age 65 over the next 50 years is currently also reflected in the effective retirement age increases as projected in the 2012 Ageing Report. For statutory retirement ages, the share is slightly larger. This especially holds for female retirement ages due to the catching-up process to male retirement ages.38
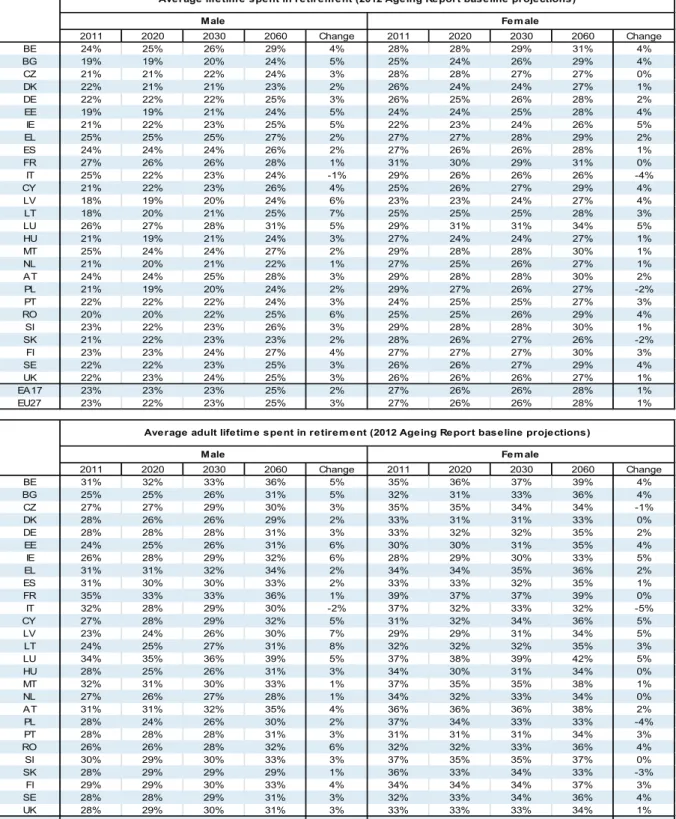
As a consequence of the partial reflection of gains in life expectancy in the effective retirement age increases, the average share of (adult) lifetime spent in retirement is projected to be increasing in every country up to 2060, except for Italy (men and women) as well as the Czech Republic, Poland and Slovakia (women) (see Table 3).
38
Given that especially female statutory retirement ages are in most Member States currently still below 65, a comparison of statutory retirement age developments with life expectancy gains at age 65 (here used for simplicity reasons to show overall EU developments) slightly underestimates the individual potential for further statutory (and effective) retirement age increases given the increases in life expectancy in each Member State. In the scenario calculations, the change in life expectancy at the 2010 statutory retirement age (base year for 2012 Ageing Report) is thus taken as a reference. The simulation results for the statutory retirement age increase under the 100% shift scenario is accordingly slightly higher for women than the projected increase in life expectancy at age 65, as can also be seen in Table 5.