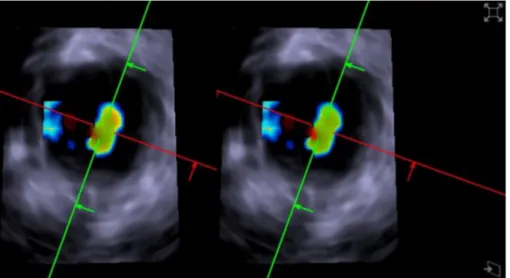
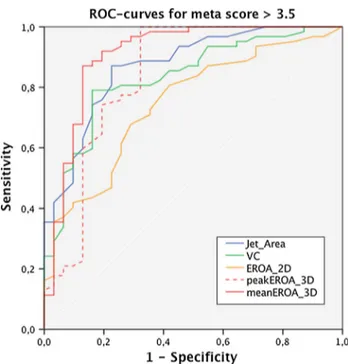
Usefulness of 3D-PISA as compared to guideline endorsed parameters for mitral regurgitation quantification.
Texte intégral
Figure

Documents relatifs
Using the (NUV−r) versus (r−K) rest-frame colour diagram to classify star-forming and quiescent galaxies in our sample, we measured the evolution of the SMFs of the two populations
In the current work we show through numerical simulations as well as experimental validation that the shrinking speed and Reynolds number are critical parameters, while the
[r]
These effects are cutoff dependent, and perturbative physics seems to couple very weakly to the proton in the diffractive region, its coupling strength being a few percent of that
Le DRCR.Net a comparé l’efficacité de 3 anti-VEGFs, le ranibizumab 0,3 mg (dose hors AMM en Europe), l’aflibercept 2mg, et le bévacizumab 1,25 mg, administrés selon
Ainsi, le pli qui se crée dans le tissu du parler et, partant, dans l’étoffe du monde comme corps, est la preuve d’une indissociabilité du rapport entre le phénomène
