3D fully coupled multiphase modelling of
Ekofisk reservoir
C. Ringlet
*, R. Charlier
*, Ch. Schroeder
*, F. Collin
*,***
Département ArGEnCo, Université de Liège Institut de Mécanique et Génie Civil, Bât. B52 1 chemin des Chevreuils
B-4000 Liège Belgium
**
FNRS Research Associate, University of Liège e-mail: [email protected]
ABSTRACT. During reservoir production, the depletion usually induces a compaction of the reservoir layers. To enhance oil recovery, waterflooding operations are generally performed but, in the North Sea chalk reservoir, they have also induced an additional compaction. This latter phenomenon has a positive impact (improve the ‘Compaction drive’ oil recovery) but endangers the offshore platforms and causes huge extra costs. The coupling effects between mechanical behaviour and fluids flow are thus a key issue in petroleum engineering. Pasachalk program I & II have proposed a constitutive model (referred as Pasachalk model), where the suction is the key parameter to explain the water weakening effect. This model has been used for the modelling of waterflooding experiment on chalk plug and bi-dimensional reservoir. However, as the reservoir modelling is actually a 3D model, the purpose of this paper is to present 3D fully coupled modelling of a simplified Ekofisk reservoir during production and waterflooding phases. In order to exhibit the influence of the constitutive mechanical model, different studies are performed: increasing the complexity of the mechanical model (from an elastic model up to the Pasachalk one with suction effect). The numerical results show the influence of the mechanical law on the oil production and exhibit that only an elasto-plastic law with suction effects succeeds to reproduce compactions during both production and waterflooding.
1. Introduction
Oil field exploration in North Sea began in the late fifties and the first commercial oil field (Ekofisk) has been discovered in 1969. Ekofisk is located 200 km west from the Norwegian coasts (Masson et al., 1980). The geological structure of this latter field of about 50 km2 is an elliptical dome, elongated in the North-South direction. The overburden is 3000 m thick with an alternance of silts and tertiary argilites. The 300 m thick reservoir is composed of two principal fractured chalk layer (Tor and Ekofisk formation) separated by a 20 m layer made of a more rigid and less permeable chalk, referred as the Tight zone (Teufel et al., 1990). The porosity of the chalk layer varies from 5 to 51 % with a mean value of 32% in the Ekofisk formation (Danian) and 30 % in the Tor formation (Maastrichtian). The permeability is relatively low with a mean value of about 10-15 m2.
Ekofisk is one of the largest oil field and it produces gas as well. The exploitation began in the early seventies and up to 1987, oil production has been ensured by the reservoir depressurization and the resulting compaction. Before 1977, due to the lake of installation, gas was not produced for commercial reasons and was injected into the reservoir; the depressurization was thus controlled (Maury et al., 1996). However, after 1977, gas injections decreased and the compactions of the reservoir layers have been soon observed: settlements reached the surface and leaded to sea bed subsidence. In 1984, the settlement of Ekofisk field centre was about 3 m and the off-shore stations were thus endangered. Consequently, uplift operations to ensure offshore installation safety, with significant extra costs and revision of production strategy, were necessary. It is obvious that the control of the compaction is of high interest: the subsidence leads to extra cost but on the other hand it increases the “compaction drive” production.
Water injection was initiated in 1987 in order to re-pressurize the reservoir and to limit the settlements. After preliminary positive tests, huge water injections in the reservoir layers have been realized. The resulting effect has been an increase of the compaction! The total amount of seafloor settlement observed up to now is about 10 m (Nagel, 2001) with a current subsidence rate of nearly 0.4 m per year. It is thus necessary to develop constitutive model able to reproduce all these observations in order to propose an optimum production strategy.
The mechanical behaviour of the chalk is really complex and the origins of the water weakening effects are not yet really understood. Many constitutive models have been (and are still) proposed and this paper proposes to compare different laws to check their ability to reproduce the observations during the Ekofisk exploitation. The modelling of the Ekofisk field is necessarily a tri-dimensional coupled multiphase modelling and a simplified geometry is used to describe the reservoir structure.
2. The complex mechanical behaviour of chalk
The first constitutive models for chalk were elastic laws. The chalk elastic moduli are functions of the porosity, the mineral content, the saturation fluid … These reversible models are not suitable enough because most experiments carried out on chalks evidence two plastic mechanisms: the pore collapse and the frictional rupture. A well-posed elasto-plastic constitutive law dedicated to saturated chalk has been first proposed by (Shao, 1991). This model is able to reproduce the two mechanisms but predicts a swelling during waterflooding. (Brignoli and Santarelli, 1994) have introduced the influence of saturation in a chalk constitutive model, but this latter law is still unable to predict the compaction observed during waterflooding in an oil saturated chalk. (Piau and Maury,1994) approach solved this drawback: they proposed two yield surfaces (one corresponding to an oil-saturated chalk, the other to fully water saturation conditions) and introduced an additional strain corresponding to change from one saturation condition to the other. This conceptual model with a gap is the basis of further constitutive models (Schroeder et
al., 1996) and (Homand et al., 2000). Risnes (see Risnes et al., 1999) has proposed
many papers on the micromechanical origin of the saturation effects and, following the same philosophy, (Delage et al., 1996) have showed how this water weakening phenomenon could be also considered within a framework taken from the mechanics of unsaturated soils. By considering oil as a non wetting phase (like air in unsaturated soils) and water as a wetting fluid (like in unsaturated soils), it was demonstrated that the volume reduction under waterflooding could be interpreted as a collapse phenomenon. Within the Pasachalk EC project, the well-known unsaturated soil BBM model (Alonso et al., 1990) was adapted to the chalk behaviour in the so-called Pasachalk model. The key idea of this model is considering suction (including capillary pressure and physico-chemical effects) as an explanation of the observed compaction. Satisfactory results were obtained in modelling laboratory waterflooding tests and also a simplified 2D chalk reservoir configuration (Collin et al., 2002).
The mechanical behaviour of chalk is even more complex because time dependent effects have been also evidenced and different constitutive models have been proposed (Dahou et al., 1995, De Gennaro et al., 2003 and Hickman et al., 2007). However, in this paper, we restrict our analysis to a comparison of the results obtained with an elastic model and the elasto-plastic Pasachalk model with suction effect.
3. The PASACHALK constitutive model
The Pasachalk model proposes to use the concept and constitutive law devoted to unsaturated soils, in order to explain the water weakening effect in oil saturated chalk. The Barcelona Basic Model (Alonso et al., 1990) is the basis of the Pasachalk
constitutive law, which has been already presented (Collin et al., 2002). Therefore, we limit the description of the model to its principal ingredients.
In order to model the two plastic mechanisms, two yield surfaces are combined within a cap model: a modified CamClay model, for pore collapse, and an internal friction model, which concerns the rupture by internal friction. Another particularity of chalk behaviour is that the traction resistance defined by an internal friction model may be overestimated. A third yield surface is adopted to limit traction stresses.
3.1 General formulation
The general elastoplastic relations are formulated in their rate form. The strain rate is composed of a mechanical part and of a suction one. Each contribution is partitioned in an elastic and a plastic component:
p s ij p m ij e s ij e m ij s ij m ij ij , , , , ε ε ε ε ε ε ε & & & & & & & + + + = + = [1]
The mechanical elastic part is linked to the stress tensor following Hooke’s law:
e m kl e ijkl ij C , ~ ε σ = & [2]
Where
σ
~
is the Jaumann objective stress rate and the compliance elastic tensor.e
C
The suction elastic part of the strain rate is linked to suction rate by the following relation:
(
) (
)
h s p s s e e kl kl at s e s kl & & & = + + =κ
δ
ε
1 , [3]Here, a general framework of non-associated plasticity is considered in order to limit dilatancy, and the plastic flow rate is derived from a plastic potential g (an associated law can be obtained by substituting g by the yield surface f)
ij p p m ij g
∂σ
∂
λ
ε
& , = & [4]The suction plastic strain is linked to suction rate with the following relation:
(
) (
)
h s p s s e p kl kl at s p s kl & & & = λ+ + δ = ε 1 , [5]After a classical development, the stress rate expression can be found as follows: s M C Cijkle ijklp ij ij kl = −
ε
& − &σ
~ ( ) [6]The first term of the right part is the classical expression of an elasto-plastic formulation. The second term takes the influence of suction into account.
3.2 Yield surfaces in
(
I
σ,
II
σˆ)
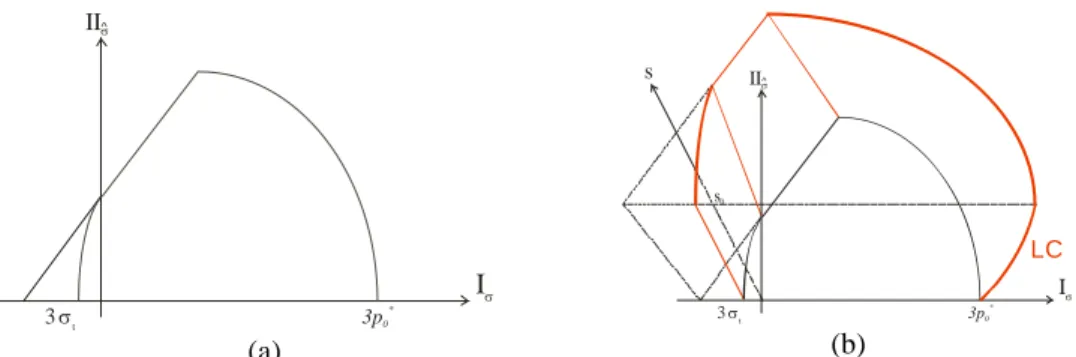
planeThe proposed model is a multi-mechanism Cap-model composed of three different yield surfaces (Figure 3.1). $ σ$ represent respectively the first stress tensor invariant, the second deviatoric stress tensor invariant and the third deviatoric stress tensor invariant.
I II III
σ,
σ,
- CamClay surface(
3)
0 tan 3 0 C 2 2 ˆ 1 ⎟⎟ + = ⎠ ⎞ ⎜⎜ ⎝ ⎛ − + ≡II m I c I p f σ σ σφ
[7]Where c is the cohesion, φC is the friction angle in compression path, and p0 is
the preconsolidation pressure, which define the size of the yield surface. A dependence on the third invariant stress is introduced in the model using the parameter m. Therefore, the shape of the surface in the deviatoric plane is not a circle. The coefficient m is defined by:
(
n b a m= 1+ sin3β)
[8] Where ⎟⎟ ⎠ ⎞ ⎜⎜ ⎝ ⎛ − = − 3 ˆ ˆ 1 2 3 3 sin 3 1 σ σ β II III [9]The Lode angle β is derived from equation of the third invariant and the three parameters a, b and n must verify different convexity conditions.
- Internal Friction surface
0 tan 3 C ˆ ⎟⎟= ⎠ ⎞ ⎜⎜ ⎝ ⎛ − + ≡ φ σ σ c I m II f2 [10] - Traction surface
(
)
/3 0 tan ) ( 3 3 , 2 C , 2 2 ˆ 3 ⎟⎟= ⎠ ⎞ ⎜ ⎜ ⎝ ⎛ ⎟⎟ ⎠ ⎞ ⎜⎜ ⎝ ⎛ + + − ≡ ti ti s c I I m II f σ φ σ σ σ σ [11]Where σt,i is the isotropic traction strength. 3.3 Suction effect on yield surfaces
As mentioned above, the oil-water suction has an effect on the mechanical behaviour of chalk containing oil and water. Suction changes can induce both elastic and plastic strains. The yield surfaces in the
(
I
σ, II
σˆ)
plane are influenced by suction. In order to model all typical behaviour features of unsaturated soils, yield surfaces have to be extended in the plane(
I
σ,
II
σˆ,
s
)
.- The preconsolidation pressure p0 changes with suction according to the LC
concept of the Barcelona model:
* 0 * 0 0
(
)
s
s
s
p
p
s
p
+
∆
+
=
[12]Where p0* is the preconsolidation pressure for s = 0, ∆p0 is the asymptotic increase of the preconsolidation pressure for infinite suction and s* is the increase of suction, for which half of the ∆p0 is achieved.
- Cohesion increases with suction according to the relation:
s k c s
c( )= (0)+ [13]
The new yield surfaces are drawn on the figure 3.1 where the model is plotted in the space
(
I
σ,
II
σˆ,
s
)
. Iσ 3 σt IIσ^ 3p0 * (a) Iσ 3 σt s s0 IIσ^ 3p0 * LC (b)Figure 3.1 Pasachalk model (a) in the plane
(
Iσ, IIσˆ)
(b) in the space(
Iσ,IIσˆ,s)
4. Numerical 3D model of the Ekofisk field
A simplified geometry of the actual field structure is used in the modelling: a sugar box-like model with five horizontal layers (Figure 4.1). Only the reservoir
layers are considered: the side-burden and the under-burden are assumed to be rigid and the weight of the over-burden is applied at the top face of the reservoir. For symmetry reasons, half of the reservoir is meshed (2733 nodes and 2040 finite elements). Table 4.1 gives the hydraulic properties of the different layers.
Figure 4.1 Synthetic Ekofisk model
The Water-Oil contact level is located at 21.18m above the lower face of the reservoir and the pressure at that depth is 47.44 MPa. The oil pressure and water pressure distributions are in equilibrium with the gravity. All the boundaries of the model are impervious, except at the wells. Table 4.2 defines the outflow at the production wells and the water inflow in the injection wells. At the production wells, the outflow is imposed as long as the bottom-hole-pressure (BHP) is larger than a prescribed value. At the injection wells, a maximum BHP is also imposed. At 1971, only the central production well P03 is open. Since 1974, all the production wells are open and the outflows are progressively increasing. Water injections begin after 1987 in order to repressurize the reservoir. In 1993, massive water injections are performed and the inflow is quite doubled.
Layer Formation Thickness [m] Porosity [%] Kx = Ky [m²] Kz [m²]
1 Ekofisk 30.28 40 9.87 10-14 2.47 10-15
2 Ekofisk 30.28 40 9.87 10-14 2.47 10-15
3 Tight zone 6.056 20 9.87 10-14 2.47 10-16
4 Tor 30.28 38 9.87 10-14 2.47 10-15
5 Tor 45.42 38 9.87 10-14 2.47 10-15
Table 4.1 Hydraulic properties of the different layers
The weight of the overburden corresponds to a total stress of 60 MPa. The vertical stress is in equilibrium with the gravity and the K0 value in the reservoir
rigid. The Bishop effective stress is used for the coupled elastic modelling, when net stress and suction are the stress variables of the Pasachalk model.
P01-P06 P03 I01-I02 Year Outflow [kg/s] BHP [MPa] Outflow [kg/s] BHP [MPa] Inflow [kg/s] BHP [MPa] 1971 / / 7.7 24.8 / / 1974 18.48 24.8 18.48 24.8 / / 1975 24.64 31.0 24.64 31.0 / / 1987 24.64 27.6 24.64 27.6 93.84 48.2 1993 24.64 27.6 34.64 27.6 225.22 55.120
Table 4.2 History of oil production and water injection in the different wells 4.1. Elastic coupled model
Figure 4.2 presents the results of the coupled elastic modelling. The field pressure (volume weighted oil pressure) first decreases during the production phases (Figure 4.2-a). As soon as the water injection starts, the pressure is stabilized. The first injection phase is not sufficient to repressurize the reservoir. During the second phase, water inflows are more than doubled and the field pressure is increasing.
(a) (b)
Figure 4.2 Coupled elastic modelling: (a) Field pressure evolution (b) Settlement at
the bottom of the wells
Figure 4.2-b shows the settlement at the bottom of the wells. The displacement follows the same evolution as the field pressure: compaction during the production phase and swelling during the injection phase. This result is not in agreement with the observations that showed an additional compaction during the water flooding.
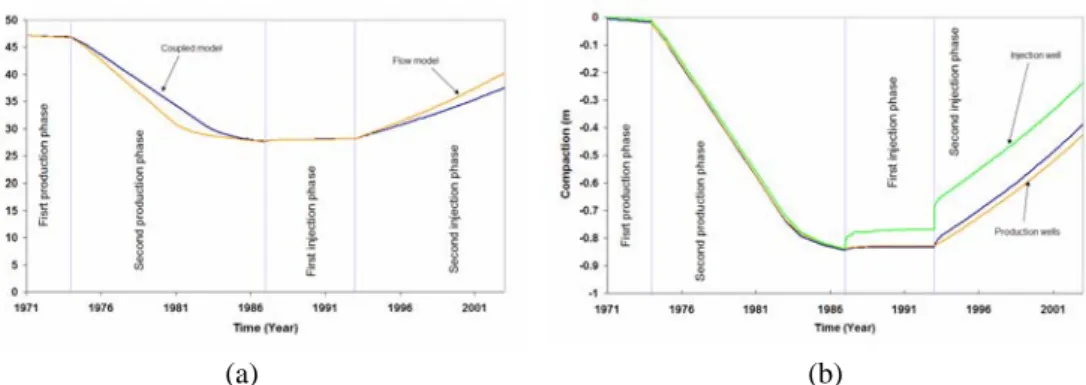
4.2. Elasto-plastic coupled model with suction effect
The results obtained with the Pasachalk model are presented in the Figure 4.3. The field pressure decrease during the production phase is lower than the pressure drop given by the elastic law. Indeed, the plastic deformations are larger and the hydromechanical coupling is pressurizing the reservoir. During the injection phase, the field pressure is increasing as in the previous modelling. However, the evolution of the settlement at the bottom of the wells is clearly different. After the production phase, during which the displacement is about 3 or 4 meters at the wells, the behaviour at the two types of well becomes different. At the water injector, a additional settlement of about three meters is predicted. This compaction is related to the pore collapse during a wetting path. The amplitude of the phenomenon is lower at the production wells because they are not yet water flooded. This means that even if the field pressure is increasing, the Pasachalk model is able to predict an additional compaction.
(a) (b)
Figure 4.3 Coupled elasto-plastic modelling: (a) Field pressure evolution (b)
Settlement at the bottom of the wells
5. Conclusion
A tri-dimensional multiphase modelling of the Ekofisk reservoir is proposed with two constitutive laws. The results show that only the elasto-plastic model with suction effect is able to reproduce the compaction observed during production phase and during waterflooding as well. In the Pasachalk model, this additional deformation is related to the suction decrease, which is associated to a decrease of strength properties.
Acknowledgements
6. References
Alonso E.E., Gens A., Josa A., “A constitutive model for partially saturated soils”,
Géotechnique, Vol. 40 n°3, 1990, p. 405-430.
Brignoli M., Santarelli F.J., Righetti C., “Capillary phenomena in an impure chalk”,
Proceedings Eurock 94, 1994, p. 837-843.
Collin F. Cui Y.J., Schroeder C., Charlier R., “Mechanical behaviour of Lixhe chalk partly saturated by oil and water: experiment and modelling”, Int. J. Numerical and Analytical
Methods in Geomechanics, Vol. 26, 2002, p. 897-924.
Dahou A., Shao J.F., Bederiat M., “Experimental and numerical investigations on transient creepof porous chalk”, Mechanics of material, Vol. 21 n°2, 1995, p.147-158.
De Genarro V., Delage P., Cui Y.C., Schroeder Ch., Collin F. “Time-dependent behaviour of oil reservoir chalk: a multiphase approach”, Soils and Foundations, Vol. 43 n°4, 2003, p. 131-148.
Delage P., Schroeder C., Cui Y.J., “Subsidence and capillary effects in chalk”, Eurock 96
Proceedings, Turin, 1996, p. 1291 – 1298.
Hickman R.J., Gutierrez M.S., “Formulation of a three-dimensional rate-dependent constitutive model for chalk and porous rocks”, Int. J. for Numerical and Analytical
Methods in Geomechanics, Vol. 31 n°4, 2007, p.583-605.
Homand S., Shao J.F., “Mechanical behaviour of a porous chalk and effect of saturating fluid”, Mechanics of Cohesive-Frictional materials, Vol. 5, 2000, p. 583-606.
Masson P., Laurent L.J., D’Heur M., “La géologie de la mer du Nord, Bilan de 15 années d’exploration pétrolière ”, Hommage à Léon Calembert, Ed. Georges Thone, Liège, pp. 147-181, 1980.
Maury V., Piau J.M., “Subsidence induced by water injection in water sensitive reservoir rocks: the example of Ekofisk”, Fifth North Sea Chalk Symposium, JCR program, Reims, 1996.
Nagel N., “Ekofisk geomechanics monitoring”, Int. Workshop on Geomechanics in reservoir
Simulation, IFP, Reuil-Malmaison, 2001.
Piau J.M., Maury V., “Mechanical effects of water injection on chalk reservoirs”,
Proceedings Eurock'94, Balkema, Rotterdam, 1994, p. 819-828.
Risnes R., Flageng O., “Mechanical properties of chalk with emphasis on chalk-fluid interactions and micromechanical aspects”, Oil and Gas Science and Technology Rev.
IFP, Vol. 56 n°6, 1999, p. 751-758.
Schroeder C., Shao J.F., “Plastic deformation and capillary effects in chalks”, Fifth North Sea
Chalk Symposium, Reims, 1996.
Shao J.F., Henry J.P., “Development of an elastoplastic model for porous rock”, International
Journal of Plasticity, Vol. 7, 1991, p. 1-13.
Teufel L.W., Farrel H.E., “In situ stress and natural fracture distribution in the Ekofisk field, North Sea”, Third North Sea Chalk Symposium, Copenhagen, 1990.