HAL Id: hal-02319694
https://hal.archives-ouvertes.fr/hal-02319694
Submitted on 18 Oct 2019
HAL is a multi-disciplinary open access
archive for the deposit and dissemination of
sci-entific research documents, whether they are
pub-lished or not. The documents may come from
teaching and research institutions in France or
abroad, or from public or private research centers.
L’archive ouverte pluridisciplinaire HAL, est
destinée au dépôt et à la diffusion de documents
scientifiques de niveau recherche, publiés ou non,
émanant des établissements d’enseignement et de
recherche français ou étrangers, des laboratoires
publics ou privés.
Browsing Information Retrieval System Results
Tamer Abdulghani, Mahmoud Alnajar, Rayhane Belaroussi, Josiane Mothe,
Mikhail Ryzhov, Sarune Samoskaite
To cite this version:
Tamer Abdulghani, Mahmoud Alnajar, Rayhane Belaroussi, Josiane Mothe, Mikhail Ryzhov, et
al.. Browsing Information Retrieval System Results. 15e Conference francophone en Recherche
d’Information et Applications (CORIA 2018), May 2018, Rennes, France. pp.1-8,
�10.24348/co-ria.2018.paper21short�. �hal-02319694�
Any correspondence concerning this service should be sent
to the repository administrator:
[email protected]
This is an author’s version published in:
http://oatao.univ-toulouse.fr/22397
Open Archive Toulouse Archive Ouverte
OATAO is an open access repository that collects the work of Toulouse
researchers and makes it freely available over the web where possible
To cite this version: Abdulghani, Tamer and Alnajar, Mahmoud
and Belaroussi, Rayhane and Mothe, Josiane and Ryzhov, Mikhail
and Samoskaite, Sarune Browsing Information Retrieval System
Results. (2018) In: 15e Conference francophone en Recherche
d'Information et Applications (CORIA 2018), 14 May 2018 - 18
May 2018 (Rennes, France).
Browsing Information Retrieval System
Results
Tamer Abdulghani
*—Mahmoud Alnajar
* —Rayhane Belaroussi
*—
Josiane Mothe
**,*** —Mikhail Ryzhov
* —Sarune Samoskaite
* *Faculty of Informatics, Université Toulouse 1 Capitole** IRIT - Institut de Recherche en Informatique de Toulouse, UMR5505 CNRS ***Université de Toulouse, ESPE, UT2J
RÉSUMÉ.L’évaluation en recherche d’information (RI) est fondamentale. Depuis les années 70, les chercheurs utilisent un cadre d’évaluation du type de celui proposé dans les projets Cranfield ou TREC pour calculer l’efficacité du système sur des collections de référence. Alors que les résultats numériques sont une pratique courante de comparaison de systèmes, nous pensons que les comparaisons visuelles pourraient aussi être utiles aux chercheurs. À cette fin, nous avons développé une interface qui permet aux scientifiques de RI de comparer l’efficacité de différents systèmes. Elle s’appuie sur les résultats de l’outil trec_eval. À ce stade, l’interface permet des analyses pour la recherche ad hoc. Cet article présente l’interface.
ABSTRACT.Evaluation in information retrieval (IR) is crucial. Since the seventies, researchers
use Cranfield or TREC-like framework to evaluate their systems and approaches resulting in system effectiveness calculated across reference collections. While numerical results are com-mon practice for system comparison, we think that visual comparisons could also be of help for researchers. To this end, we developed an interface that allows IR scientists to compare sys-tem effectiveness. It relies on results from the trec_eval tool. At this stage, the interface allows analyses for ad hoc retrieval. This paper presents the interface.
MOTS-CLÉS :Système d’information ; Recherche d’information, Visualisation de résultats, Eva-luation
1. Introduction
Information retrieval systems aim at retrieving relevant documents to users’ que-ries. Common practice is to evaluate the systems on reference collections such as the ones from TREC1). While in scientific papers some results only are reported, resear-chers generally deeply analyse many and it is important to provide researresear-chers with some tools in order to help them analysing the results they obtain, compare the results when using different system configurations, etc.
While numerical results are common practice for system comparison, we think that visual comparisons could also be of help for researchers in their work and could provide a complementary view on the results.
Evaluation campaigns and forums in information retrieval result in a quite uniform way of evaluating systems according to a given type of task. One of the earliest tasks which remains very active is ad hoc retrieval. Ad hoc retrieval refers to the task where a query is typed in the search engine which duty is to retrieve relevant documents from a document collection. The principles of evaluating such a task were defined by Cleverdon in Cranfield project (Cleverdon, 1967) : for each query from a given query set, the relevance of the documents from the collection are known and it is thus possible to measure the difference between the actual system answer and the expected one. TREC relied on these principles in the ad hoc task from the 90ties, although TREC does no more consider an exhaustive document relevance judgement list but rather a pooled one (known as qrels in TREC). Another difference is TREC uses news paper collections while Cranfield used documents from a library.
Nowadays, ad hoc task and its evaluation principles remain the same in various TREC (and other evaluation conferences) tracks such as Web track (Hawking et Cras-well, 2002 ; Collins-Thompson et al., 2015) or MicroBlog track (Lin et al., 2014). Evaluation measures are gathered in the trec_eval and ndeval tools2; the former pro-vides more than 100 measures for any run using an ad hoc collection.
The analysis of the evaluation resulting files can be cumbersome because it consists in one value per query and per effectiveness measure. For this reason, it is a common practice to consider average effectiveness where values are averaged over queries ; hiding some potentially very interesting details and query-related re-sults (Berto et al., 2013). In the research work we report in this paper, our goal was to propose an interface which could help researchers browsing through the results of various information retrieval systems when using a reference collection to compare them in various ways, both aggregated and detailed.
We created a tool that can ease and empower the ongoing research in information retrieval and enhance the researchers’ ability to explore their data sets more quickly
1. TREC (Text REtrieval Conference) is a series of conferences that aims at evaluating systems on different tracks including ad hoc retrieval. Seetrec.nist.gov
and easily, by providing them with general information about the data through dif-ferent visualizations.
At this stage, our tool makes it possible to analyse IR results according to the ad hoc retrieval task.
In this paper, we also show some results than can be extracted when using our interface with the considered data.
The rest of the paper is organized as follows : in Section 2 we detail the main func-tionalities of the interface. Section 3 presents the type of data our tool is able to handle and the structure the files should respect. In Section 4 we develop the added value of the visualisations as complementary to numerical analysis for system configuration comparison. In Section 5 we present the related work. Finally, Section 6 concludes this paper and provides future direction to this work.
2. Overview of the functionalities
Information retrieval researchers all handle the same types of files when evaluating their systems. This is one very important outcome of international evaluation campai-gns which promote clear evaluation framework and tools.
Our main objective is to create a new Java-based tool that is able to parse and re-structure the data files usually manipulated by information retrieval researchers when using reference collections as well as to visualize the data in different ways which could help better understand the results obtained by their search strategies.
The software we developed in Java allows the user to :
1) Visualize the results of a specific system s or a set of systems siusing a perfor-mance measure. Any measure from the perforperfor-mance system file(s) can be used.
2) Visualize the results of a specific system s at the top k retrieved documents by plotting the recall/precision values for all the queries (or any couple of performance measures to see their relationship).
3) Compare different systems, for a given top k retrieved documents, by plotting the recall/precision values for all the queries (or any couple of performance measure).
These functionalities are depicted more precisely in Section 4 and 5.
3. Data files
In this section, we present the type of data files our system can handle and ana-lyse, as well as their format. We also present the files that we used in the illustrative examples and figures in this paper. The illustrative examples make use of the data re-leased by Molina et al. (Molina et al., 2017) on ClueWeb12 collection with the 2013 TREC topics.
Our tool is used in order to analyse and compare system performance obtained on a set of queries or for some individual queries.
3.1. Topic file
A topic file corresponds to an XML file with topics or information needs. It is a typical TREC ad hoc topic file. Each topic consists of an id, the topic title, its descrip-tion, its narrative. In the case of TREC Clueweb, the topic title is replaced by the main query and the file contains also subtopics or intentions for the search.
The topic file we used later in this paper in examples and illustrations is indeed the TREC ClueWeb 2014 file. Topic (’trec2014-topics.xml’) file contains the initial queries as provided by TREC and that can be run by different systems (Carterette et al., 2014). Each query has its own id number and the query it-self, in addition to a description associated with the query topic as shown below :
<topic number="251" type="single">
<query>identifying spider bites</query> <description>
Find data on how to identify spider bites. </description>
</topic>
3.2. System performance file
Our interface can visualize the performance of a system or compare the perfor-mance of different systems. For this, our interface handles system perforperfor-mance files. A system performance file is a CSV file for which each row corresponds to a query while each column corresponds to a performance measure. Figure ?? provides an ex-tract from a system performance file.
This file is obtained from trec_eval output files. More specifically, using the usual IR vocabulary, a run consists of the retrieved documents lists alongside with the docu-ments scores, for each of the treated queries, using a given system configuration. For evaluation purposes, a run is treated by the trec_eval tool using the query relevance judgement or qrels. Trec_eval provides then a list of effectiveness values for each in-dividual query and in average over the queries. These results are processed to obtain the system performance file. For this, we reuse a tool developed in the lab in order to transform trec_eval output into a CSV file for which each column corresponds to an effectiveness measure while each line corresponds to a topic or a query.
In this paper, to illustrate the comparison between different systems or the deep analysis of one system, we use performance files for three systems that ran the
Clue-Web 2014 topics ; the data is an extract from (Molina et al., 2017). More specifi-cally, using Terrier (Ounis et al., 2006), we run three configurations as follows : (1) Language modeling using Dirichlet smoothing with µ = 1, 000 (named Dirichlet la-ter on), (2) Language modeling with Jelinek-Mercer smoothing (named Jelinek), (3) BM25 with the default Terrier parameters (named BM25).
Each of these files contains the various system performances obtained when consi-dering the different queries from the TREC 2014 topic file and using trec_eval tool.
Any of the performance measures can be visualized, but in the next sections, we will illustrate our interface using the most usual measures in IR which are :
– Precision : by definition precision in IR is the fraction of relevant documents among the retrieved documents. In a given system performance file, precision value for each query and for a specific number of top retrieved documents is given. For example, P@5 represents the precision at the top 5 retrieved documents, while P@1000 means the precision at the top 1000 (maximum) documents.
– Recall : is the fraction of relevant documents that have been retrieved over the total amount of relevant documents. Similar to precision, in a given system performace file and for a specific number of documents we have the corresponding list of recall values for each query. For example R@5 represents the recall at the top 5 retrieved documents, while R@1000 means the recall at the top 1000 (maximum) documents.
4. System performance visualization and comparison
The GUI interface allows loading any of the available system performance CSV files. The user can decide to visualize one single file of his or her choice or rather select several files in order to compare them. The visualization can be based on a single mea-sure (e.g. average precision when 1000 documents are retrieved) or on recall/precision (or other pairs of measures) curves and plots.
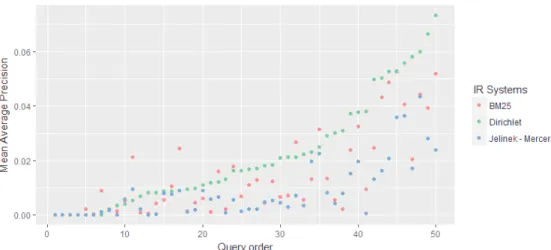
For any effectiveness measure, it is possible to visualize the result for one or se-veral systems. For example, Figure 1 visualizes the comparison between the three systems BM25, Dirichlet, and Jelineke when average precision is considered. The X-axis corresponds to queries that have been ordered by increasing average precision (Y-axis) when Dirichlet system is used. A different colour is associated to each system (performance file).
In the example from Figure 1, we can easily see that for most of the topics Dirichlet is better that the two other systems. But in the same visualization, we can also see that it is not always the case. It is even possible to identify the queries for which BM25 or Jelinek are better options. It is important to say that while in this example the user chose to visualize the average precision when 1000 documents are retrieved, it is possible to visualize any individual performance measure.
Moreover, it is also possible to plot recall/precision values based on different cuts (Top k) of the retrieved document list as described below. Te user can select a specific
Figure 1.Comparison of the three systems Dirichlet, BM25, and Jelinek on average precision. Queries (X-axis) are ordered by increasing performance of the Dirichlet system based on the average precision (AP) values.
system for which s/he wants to visualize the results and decide the number k of top retrieved documents (cut off of the retrieved document list) to be considered to plot recall/precision curves. In that case each query is plotted individually. k is in the range [1,2,5,10,15,20,30,50,100,200,500,1000].
Figure 2.Plotting the recall and precision values for all the queries evaluated by Dirichlet system when 20 top retrieved documents are considered (R@20, P@20) ; other values of cut off of the retrieved document list can be chosen for the visualization as well as any other couple of measures.
Figure 2 shows the plotting of the recall and precision when the 20 top retrieved documents are considered (R@20 and P@20) for the 50 ClueWeb 2014 queries (initial queries that is to say topic title) that have been evaluated by the Dirichlet system configuration.
In this plot, each dot represents a value of (x : recall, y : precision) for a specific topic/query. Doing so we obtain both an overview of the results over the entire query set but also detailed results for each query individually. It is also easy to visualize the general values scale of the recall/precision that has been obtained by the displayed sys-tem. As we will see later on, it is possible to visualize any couple of measures. Since measures are used to depict different things, it is interesting to be able to visualize their inter-relationship.
In order to have a better understanding of the overall performance for each system, it is also possible to plot the average of recall/precision values over all the queries at the top retrieved documents (1, 2, 5, 10, 20, 50...). Similar to previous visualization, the idea here is to plot the (Average Recall, Average Precision) dots for various num-ber of top retrieved documents, that is to say at different cut of the retrieved document list. Rather than considering each query individually, in that case we average the re-sults over the query set. Moreover, we plot the rere-sults for the various values of k top retrieved documents.
5. Related works
Many related works focus on visualizing the results of an IR system for the user. For example, (Veerasamy et Belkin, 1996) presents a tool that helps the end user to indicate document relevance and to aggregate information about the query result. (Börner, 2000) suggested a way to organize retrieval results to browse them in an interactive way.
On the other hand, the Evall3tool has been developed in order to evaluate a run against a baseline. It also relies on Cranfield or TREC-like framework. Evall allows to evaluate a run using an existing benchmark, format the results under the form of latex tables or pdf reports but also to produce our own benchmark. At this stage the tool focuses on RepLab task4but is open to other tasks as well.
However, to the best of our knowledge, there is not interface that aims at analysing the results for researchers and to compare graphically the results obtained by different system configurations or different query formulations.
3.http://evall.uned.es
4. RepLab is a competitive evaluation exercise for Online Reputation Management system (see http://nlp.uned.es/replab2014forexample)
6. Conclusions and future works
In this paper, we present the interface we developed to help IR researchers when analysing and comparing system performance. We started with the ad-hoc task which is very popular in IR. We would like to implement new functionalities such as the performance of one query considering one or several systems, visualizing the perfor-mance of query variants, ...
7. Bibliographie
Berto A., Mizzaro S., Robertson S., « On using fewer topics in information retrieval evalua-tions », Proceedings of the 2013 Conference on the Theory of Information Retrieval, ACM, p. 9, 2013.
Börner K., « Extracting and visualizing semantic structures in retrieval results for browsing », Proceedings of the fifth ACM conference on Digital libraries, ACM, p. 234-235, 2000. Carterette B., Kanoulas E., Hall M., Clough P., Overview of the TREC 2014 session track,
Technical report, TREC NIST US, 2014.
Cleverdon C., « The Cranfield tests on index language devices », Aslib proceedings, vol. 19, MCB UP Ltd, p. 173-194, 1967.
Collins-Thompson K., Macdonald C., Bennett P., Diaz F., Voorhees E. M., TREC 2014 web track overview, Technical report, MICHIGAN UNIV ANN ARBOR, 2015.
Hawking D., Craswell N., « Overview of the TREC-2001 web track », NIST special publica-tionp. 61-67, 2002.
Lin J., Efron M., Wang Y., Sherman G., Overview of the trec-2014 microblog track, Technical report, MARYLAND UNIV COLLEGE PARK, 2014.
Molina S., Mothe J., Roques D., Tanguy L., Ullah M. Z., « IRIT-QFR : IRIT Query Feature Re-source », International Conference of the Cross-Language Evaluation Forum for European Languages, Springer, p. 69-81, 2017.
Ounis I., Amati G., Plachouras V., He B., Macdonald C., Lioma C., « Terrier : A High Perfor-mance and Scalable Information Retrieval Platform », Proc. of OSIR, 2006.
Veerasamy A., Belkin N. J., « Evaluation of a tool for visualization of information retrieval results », Proceedings of the 19th annual international ACM SIGIR conference on Research and development in information retrieval, ACM, p. 85-92, 1996.