Structural and functional evolution
of genes in conifers
Thèse
Juliana Stival Sena
Doctorat en sciences forestières
Philosophiae doctor (Ph. D.)
Québec, Canada
Structural and functional evolution
of genes in conifers
Thèse
Juliana Stival Sena
Sous la direction de :
Jean Bousquet, directeur de recherche
John Mackay, codirecteur de recherche
RÉSUMÉ
Le développement de nouvelles techniques a accéléré l'exploration structurale et fonctionnelle des génomes des conifères et contribué à l’étude de leur physiologie et leur adaptation aux conditions environnementales. Cette thèse s’intéresse à l’évolution des gènes chez les conifères et (i) fait le point sur les facteurs génomiques qui ont influencé la structure des gènes et (ii) analyse une grande famille de gènes impliqués dans la tolérance à la sécheresse, les déhydrines. Notre étude de la structure génique s’est fait à partir de diverses séquences de l’épinette blanche (Picea glauca [Moench] Voss) provenant de clones BAC, de l'assemblage du génome et de l’espace génique obtenu à partir de la technologie de «sequence capture». Par le biais d’analyses comparatives, nous avons observé que les conifères présentent plus de séquences introniques par gène que la plupart des plantes à fleurs (angiospermes) et que la longueur moyenne des introns n'était pas directement corrélée à la taille du génome. Nous avons constaté que les éléments répétitifs qui sont responsables de la très grande taille des génomes des conifères affectent également l'évolution des exons et des introns. Dans la deuxième partie de la thèse, nous avons entrepris la première analyse exhaustive de la famille des gènes des déhydrines chez les conifères. Les analyses phylogénétiques ont indiqué l'apparition d'une série de duplications de gènes dont une duplication qui a provoqué l'expansion de la famille génique spécifiquement au sein du genre Picea. L’analyse démontre que les déhydrines ont une structure modulaire et présentent chez les conifères des agencements variés de différents motifs d'acides aminés. Ces structures sont particulièrement diverses chez l'épinette et sont associées à différents patrons d'expression en réponse à la sècheresse. Dans l’ensemble, nos résultats suggèrent que l'évolution de la structure génique est dynamique chez les conifères alors que l'évolution des chromosomes est largement reconnue comme étant lente chez ceux-ci. Ils indiquent aussi que l'expansion et la diversification des familles de gènes liés à l'adaptation, comme les déhydrines, pourraient conférer de la plasticité phénotypique permettant de répondre aux changements environnementaux au cours du long cycle de vie qui est typique de plusieurs conifères.
ABSTRACT
Technical advances have accelerated the structural and functional exploration of conifer genomes and opened up new approaches to study their physiology and adaptation to environmental conditions. This thesis focuses on the evolution of conifer genes and explores (i) the genomic factors that have impacted the evolution of gene structure and (ii) the evolution of a large gene family involved in drought tolerance, the dehydrins. The analysis of gene structure was based on white spruce (Picea glauca [Moench] Voss) sequence data from BAC clones, the genome assembly and the gene space obtained from sequence capture. Through comparative analyses, we found that conifers presented more intronic sequence per gene than most flowering plants (angiosperms) and that the average intron length was not directly correlated to genome size. We found that repetitive elements, which are responsible for the very large size of conifer genomes, also affect the evolution of exons and introns. In the second part of the thesis, we undertook the first exhaustive analysis of the dehydrin gene family in conifers. The phylogenetic analyses indicated the occurrence of a series of gene duplications in conifers and a major lineage duplication, which caused the expansion of the dehydrin family in the genus Picea. Conifer dehydrins have an array of modular amino acid structures, and in spruce, these structures are particularly diverse and are associated with different expression patterns in response to dehydration stress. Taken together, our findings suggest that the evolution of gene structure is dynamic in conifers, which contrast with a widely accepted slow rate of chromosome evolution. They further indicate that the expansion and diversification of adaptation-related genes, like the dehydrins in spruce, may confer the phenotypic plasticity to respond to the environmental changes during their long life span.
TABLE OF CONTENT
RÉSUMÉ ... iii
ABSTRACT ... iv
TABLE OF CONTENT ... v
LIST OF TABLES ... viii
LIST OF FIGURES ... x
LIST OF ABBREVIATIONS ... xiii
ACKNOWLEDGEMENTS ... xv
FOREWORD ... xvi
Chapter 1: General introduction... 1
1.1 Preamble ... 1
1.2 Genome analysis and evolution ... 3
1.2.1 Genome sequencing and assembly ... 4
1.3 Genome evolution ... 6
1.3.1 Transposable elements ... 6
1.3.2 Gene content ... 8
1.3.3 Impacts of whole genome duplication and single duplications ... 9
1.3.4 Gene structure ... 11
1.4. Evolution at the functional level ... 13
1.4.1 Evolution of gene families ... 13
1.4.2. Gene expression ... 17
1.5. Project context, research objectives and hypotheses ... 20
1.5.1 Gene structure evolution in conifers ... 20
1.5.2 Molecular structure and evolution of dehydrins in Picea glauca ... 21
1.6 References ... 22
Chapter 2: Evolution of gene structure in the conifer Picea glauca: a comparative analysis of the impact of intron size ... 31
2.1 Abstract ... 31
2.2 Résumé ... 33
2.3 Introduction ... 35
2.4 Results ... 37
2.4.1 Genomic sequences ... 37
2.4.2 Gene expression profiles ... 38
2.4.3 Gene structures and comparative analysis with angiosperms ... 40
2.4.4 Comparative analysis of gene structures between Picea glauca and Pinus taeda ... 45
2.4.5 Repeat elements in Picea glauca genes ... 47
2.5 Discussion ... 48
2.5.1 Evolution of gene structure in plants... 48
2.5.2 Repetitive sequences in gene evolution ... 51
2.5.3 Slow evolution of conifer genes ... 52
2.7 Methods... 55
2.7.1 Picea glauca BAC isolation and validation ... 55
2.7.2 Pinus taeda orthologous sequences... 57
2.7.3 Screening for highly expressed genes in the whole genome shotgun assembly .. 58
2.7.4 Identification of closest homologs in angiosperms ... 58
2.7.5 Statistical analyses of introns ... 59
2.7.6 Gene space obtained from sequence capture technology ... 59
2.7.7 Picea glauca repetitive library and identification of repeat elements ... 60
2.8 Acknowledgements ... 62
2.9 References ... 62
2.10 Supplementary information ... 68
2.10.1 Additional experimental procedures for BAC isolation and sequence capture. 68 2.10.2 Supplementary tables ... 70
2.10.3 Supplementary figures... 79
Chapter 3: Expansion of the dehydrin gene family in conifers is associated with considerable structural diversity and drought responsive expression ... 86
3.1 Abstract ... 86
3.2 Résumé ... 88
3.3 Introduction ... 89
3.4 Materials and Methods ... 91
3.4.1 Dehydrin sequences... 91
3.4.2 Phylogenetic analysis ... 91
3.4.3 Identification of conserved amino acid motifs and classification of dehydrins ... 92
3.4.4 Plant material... 93
3.4.5 RNA extraction and cDNA synthesis ... 94
3.4.6 Primer design and quantitative RT-PCR ... 94
3.4.7 Sequence analysis of amplicons ... 95
3.5 Results ... 96
3.5.1 Identification of abundant dehydrins sequences in spruce ... 96
3.5.2 Dehydrins are highly divergent between angiosperms and conifers ... 97
3.5.3 A major duplication is uniquely detected in the genus Picea ... 100
3.5.4 Degenerate K-segments and structural variations in conifer dehydrins ... 100
3.5.5 Dehydrin expression varies between different tissues and conditions ... 102
3.5.6 Members of the dehydrin family respond differently to water stress ... 103
3.6 Discussion ... 107
3.6.1 Structural diversity in dehydrin protein sequences ... 107
3.6.2 Dehydrin gene family evolution and expansion in spruce ... 109
3.6.3 Expression of dehydrin genes in developmental and stress responses... 111
3.7 Conclusions ... 114
3.8 Acknowledgements ... 114
3.9 References ... 115
Chapter 4: Conclusions ... 144
4.1 Major findings and conclusions ... 144
4.1.1 Evolution of gene structure ... 144
4.1.2 Gene family evolution: a case study of dehydrins ... 146
4.2 Critical overview and contributions ... 147
4.3 Perspectives... 150
4.3.1 Large scale gene structure evolution and comparative analyses of intergenic regions ... 150
4.3.2 Dehydrins: multi-function proteins ... 151
4.3.3 Linking gene structure and gene family evolution. ... 152
LIST OF TABLES
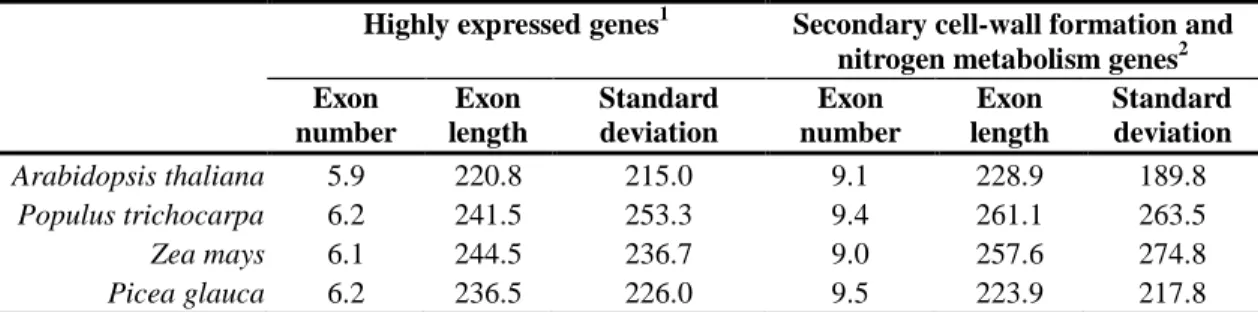
Table 1.1- Characteristics of sequence assemblies published for forest trees. ... 3 Table 2.1- Average number and length of exons in genes used for comparative analyses . 40 Table 2.2- Abundance of repetitive elements in P. glauca genes obtained from sequence
capture ... 48
Table S2.1- Gene structure data of orthologs of Picea glauca and Pinus taeda. ... 70 Table S2.2- Genes associated with secondary cell-wall formation or with nitrogen
metabolism in P. glauca targeted for BAC isolations. ... 71
Table S2.3- Primer information and sequences used for BAC screening and sequencing
validation ... 72
Table S2.4- Accession numbers of P. taeda orthologs and sequence similarity to P. glauca.
... 73
Table S2.5- Accession numbers for the closest homologous sequences between P. glauca,
Arabidopsis thaliana, Populus trichocarpa and Zea mays... 74
Table S2.6- Summary of sequencing results of P. glauca BAC clones isolated each
containing a different single copy gene associated with cell- wall formation or with nitrogen metabolism. ... 76
Table S2.7- GenBank accessions of complete cDNA utilized for gene structure definition
when the cDNA in Picea glauca gene catalogue was incomplete. ... 77
Table S2.8- Repetitive elements detected within gene structure of the 35 P. glauca genes1. ... 78
Table S3.1- Gene specific primers utilized to determine RNA transcript levels from
drought stress and tissue comparison experiments by using quantitative RT-PCR. ... 122
Table S3.2- A total of 144 conifer dehydrins were clustered on the basis of at least 97% of
sequence similarity, 78 clusters were formed using CD-hit. The sequences indicated by asterisks were used as the representative sequence of the cluster. ... 123
Table S3.3- A total of 76 angiosperm dehydrins were clustered by sequence similarity
(97%), 57 clusters were formed using CD-hit. Sequences indicated by an asterisk were used as representative sequence of the cluster. ... 131
Table S3.4- Classification of angiosperm and conifer dehydrins based on their conserved
amino-acid segments (segment-K, A, E, S, Y and N1). The graphical representation of all possible classifications (models) is in Fig.3. Sequences indicated by //, *, ** presented one degenerate A, K or Y segment, respectively. ... 135
Table S3.5- The one-way ANOVA tested if the expression levels between the three tissues
(phelloderm, xylem and young foliage) were different. ... 140
Table S3.6- A three-way ANOVA with water potential as a function of type of treatment
(watering regimes), genotype, sampling dates and their interaction. ... 140
Table S3.7- A three-way ANOVA with expression as a function of type of treatment
LIST OF FIGURES
Figure 1.1- A. White spruce is a large conifer forest tree. B. It is widely produced in
Canada both in natural forests (as seen here) and plantations and is used in multipurpose manufacture of wood products including boards as well as pulp and paper. C. White spruce is also used in Christmas tree production. ... 2
Figure 1.2- White spruce is native of North America. It has a transcontinental distribution
covering all of Canada and several northern American states... 2
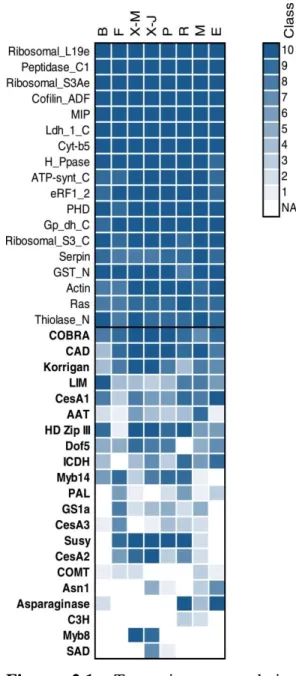
Figure 2.1- Transcript accumulation profiles from the PiceaGenExpress database
(Raherison et al. [30]) of the P. glauca genes. The transcript abundance data are classified from 1 to 10, from lowest to highest microarray hybridization intensities detected within a given tissue. The profiles of highly expressed genes (top) (according to Raherison et al. [30]; class 8 to 10 are contrasted with most of the genes associated with secondary cell wall formation and nitrogen metabolism (bottom, names in bold). NA: Not detected. Tissues: B (Vegetative buds), F (Foliage), X-M (Xylem – from mature trees), X-J (Xylem –juvenile trees), P (Phelloderm), R (Adventitious roots), M (Megagametophytes), E (Embryogenic cells)... 39
Figure 2.2- Comparative analysis of individual intron length in P. glauca, A. thaliana P.
trichocarpa and Z. mays. Box plots represent intron length data for all of the introns of the 35 genes used in comparative analyses. Intron lengths were compared among the four species by Kruskal-Wallis test with post-test analysis by Dunn’s multiple comparisons: NS, not significant (P ≥ 0.06); *P = 0.06; **P < 0.01; ***P < 0.001. ... 41
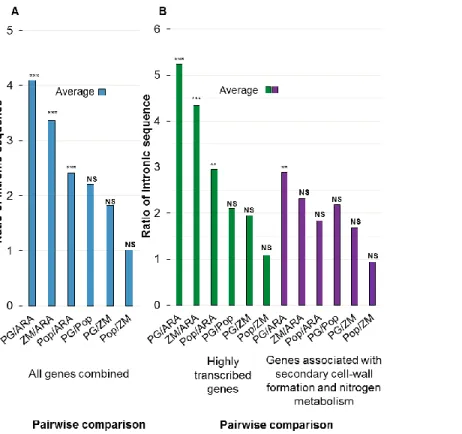
Figure 2.3- Comparative analysis of total intron length in P. glauca, A. thaliana, P.
trichocarpa and Z. mays. Average ratio of total length of intron sequences in pair-wise comparisons in: A- all genes; B- highly expressed genes and genes involved in secondary cell-wall formation and nitrogen metabolism (For individual ratios, see Figure 2.4). The total intron lengths were compared among the four species by Kruskal-Wallis test with post-test analysis by Dunn’s multiple comparisons: NS, not significant (P ≥ 0.05); **P < 0.01; ***P < 0.001. ... 43
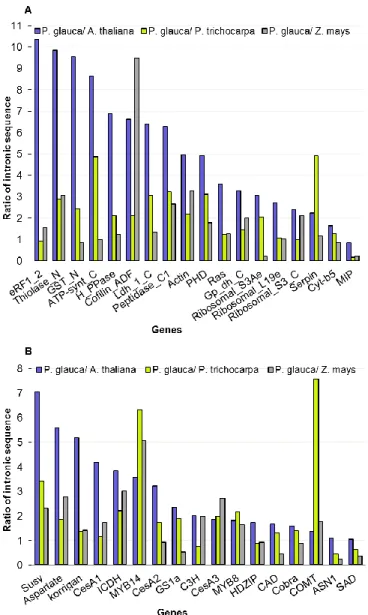
Figure 2.4- Gene by gene pair-wise comparisons of total length of intronic sequences in P.
glauca, A. thaliana, Populus trichocarpa and Z. mays. (A) highly expressed genes and (B) genes associated with secondary cell-wall formation and nitrogen metabolism. ... 44
Figure 2.5- Gene structures of six genes from different angiosperm and gymnosperm
species. The first three genes are associated with secondary cell-wall formation and nitrogen metabolism; and highly expressed genes are bolded. ... 45
Figure 2.7- Variation in intron length and genome size in 35 target genes. Average intron
size for Arabidopis, P. trichocarpa, Z. mays and P. glauca determined from the analysis of 35 homologous genes. Note that Y- axes are in log 10 scale. ... 50
Figure S2.1- Content of repetitive elements in 21 different BAC clones. The analysis used
the RepeatMasker software and a P. glauca repetitive sequence library (see Methods). Repetitive elements were classified as LTR (long terminal repeat) and unclassified (no hit in RepBase)... 79
Figure S2.2- Comparative analysis of individual intron length in P. glauca, A. thaliana, P.
trichocarpa and Z. mays. A. Average and median length of individual introns in all genes. B Average and median length of individual introns in highly expressed genes and genes associated with secondary cell-wall formation and nitrogen metabolism in four species. Intron lengths were compared among the four species by Kruskal-Wallis test with post-test analysis by Dunn’s multiple comparisons: NS, not significant (P > 0.06); * P < 0.06; **P < 0.01; ***P < 0.001. ... 80
Figure S2.3- Boxplot of the 35 homologous genes in P. glauca, A. thaliana, P. trichocarpa
and Z. mays. ... 81
Figure 3.1- Phylogeny of the conifer dehydrin gene family represented by a consensus tree
from Bayesian analysis, with threshold support equal or superior to 0.75. We used 41 white spruce dehydrins and 37 other conifer sequences; see details of sequence clusters in Table S3.2. A dehydrin from Physcomitrella was used as the root. The phylogeny was obtained with MrBayes after protein alignment with MAFFT, and visualized with FigTree... 98
Figure 3.2- A) Phylogeny of the angiosperm and conifer dehydrin gene family represented
by a consensus tree from Bayesian analysis, with threshold support equal or superior to 0.75. A dehydrin from the moss Physcomitrella was used to root the tree. The phylogeny was obtained with MrBayes after protein alignment with MAFFT. B) Synthesis of speciation and gene duplication events with N1 Skn type as ancestor; D - duplication, S - speciation. ... 99
Figure 3.3- Conifer and angiosperm dehydrins classification based on their amino-acid
motifs. A) Sequences were grouped by similarity and classified by motif composition. B) Each dehydrin type was represented showing the variation in number of motifs. ... 101
Figure 3.4- Transcript accumulation profiles from F (Foliage), X (Xylem) and P
(Phelloderm) measured by qPCR. Significant differences between tissue expression levels are indicated on the right side, ANOVA, Tukey's HSD (P <0.05; ns indicates no significant difference between the expression level among the three tissues). ... 103
Figure 3.5- Midday water potential in needles of well-watered plants (dashed line) and
unwatered plants (solid line) in three different genotypes (clones 8, 11 and 95). The water potential of water-stressed plants was compared with that of control plants for each sampling date in all three genotypes (ANOVA, Tukey’s HSD, *** P <0.001). ... 104
Figure 3.6- Expression profile of dehydrin genes during 22 days of treatment. The gene
expression of water-stressed plants (solid lines) was compared with that of control plants (dashed lines) for each sampling date in all three genotypes (clones 8, 11 and 95). ANOVA, Tukey test, *P < 0.05; **P < 0.01; ***P < 0.001. ... 106
Figure S3.1- Logo of motifs discovered in angiosperms and conifers by MEME. ... 120 Figure S3.2- Phylogeny of the angiosperm dehydrin gene family represented by a
consensus tree from Bayesian analysis, threshold support equal or superior to 0.75. We used 57 angiosperm dehydrins; see details of sequence clusters in Table S3.2. A dehydrin from Physcomitrella was used as the root. The phylogeny was created with MrBayes after protein alignment with MAFFT. ... 121
LIST OF ABBREVIATIONS
BAC; paired-end bacterial artificial chromosome cDNA; complementary DNA
CDS; coding sequence DNA; deoxyribonucleic acid EST; expressed sequence tag FL-cDNA; full-length-cDNA LEA; late embryogenesis abundant
LTR-RT; long terminal repeat retrotransposons NGS; next generation sequencing
Nt; nucleotide
ORF; open reading frame PCR; polymerase chain reaction qPCR; quantitative real-time PCR RNA-seq; ribonucleic acid –sequencing RT-qPCR; reverse transcription–qPCR SSR; simple sequence repeat
TEs; transposable elements
UTR; untranslated transcribed region WGD; whole genome duplications
ACKNOWLEDGEMENTS
I am so happy to get here, to complete this step. When I look back, I realize how much the new country, the new language, the new friends, and all the effort invested along this academic journey have had a great influence on me. I am so grateful for what I have learned these last years and I keep looking forward for new challenges with the same excitement of the beginning.
I would like to thank John Mackay and Jean Bousquet for the patience and commitment during the realization of this thesis. Thank you for all the advices, support and encouragement.
My sincere thanks to François Belzile, Armand Séguin and Maria Teresa Cervera for accepting to evaluate this thesis.
Thank you to all the colleagues and professionals of the Mackay’s lab group for the critiques, comments and friendship. Especially Isabelle Giguère and Sébastien Caron for the guidance in the laboratory work. Thank you to Jérôme Laroche and Brian Boyle for the advices in bioinformatics.
Thank you to all my multicultural friends and family. Merci d’être là, d’apporter de la joie et pour vos mots d’encouragement. Obrigada aos que estão longe, mas que permanecem próximos, é sempre bom receber o apoio e carinho de vocês. Obrigada Brice por ser o meu braço direito (ou esquerdo).
Thank you to my parents who have always encouraged me in my projects. Graças à vocês eu continuo a realizer meus sonhos.
FOREWORD
This thesis includes two articles, one peer-reviewed and published one (Chapter 2) and another one to be submitted for review (Chapter 3). Part of the general introduction of this thesis (Chapter 1) was published in a book chapter, in which J. Stival Sena and J. Mackay were among the authors. The sections 1.2 and 1.3 of Chapter 1 were written by J. Stival Sena for the book chapter published in 2015 and were updated for their inclusion in the general introduction of this thesis.
Part of the sections 1.2 and 1.3 in Chapter 1 were published in:
Parent GJ, Raherison E, Sena J, MacKay JJ. Forest tree genomics: review of progress. Advances in Botanical Research. Elsevier; 2015. p. 39–92.
Chapter 2 is based on the published peer-reviewed article:
Stival Sena J, Giguère I, Boyle B, Rigault P, Birol I, Zuccolo A, et al. Evolution of gene structure in the conifer Picea glauca: A comparative analysis of the impact of intron size. BMC Plant Biology. 2014; 14:95.
Chapter 3 of this thesis represents a manuscript to be submitted as:
Stival Sena J, Giguère I, Rigault P, Bousquet J, Mackay J. Expansion of the dehydrin gene family in conifers is associated with considerable structural diversity and drought responsive expression.
In both studies, J. Stival Sena planned and executed the experiments, conducted lab manipulations, the bioinformatics and statistical analyses, interpretation of results, and drafted the manuscripts with the supervision of J. Mackay and J. Bousquet.
Chapter 1: General introduction
1.1 PreambleBoreal forests cover approximately 30% of the global forest area and provide major ecosystem services but their health is being negatively impacted by climate change (Aitken et al., 2008; Alberto et al., 2013). It has been proposed that mitigating the effects of droughts and higher temperatures on boreal forests requires a better understanding of biological processes and a re-thinking of forest management practices (Gauthier et al., 2015). In the last few years, developments in genomics have contributed new knowledge on the function and evolution of trees that is expected to help adopt new practices. Understanding how organisms evolve and adapt to environmental change is a complex task that involves a wide range of investigations including structural and functional analyses which are being enriched by genome studies at the individual and population levels (Neale and Ingvarsson, 2008; Soltis and Soltis, 2013).
This thesis reports on the evolution of gene structure and gene families in conifers with a primary focus on white spruce (Picea glauca (Moench) Voss) (Fig.1.1), a member of the family Pinaceae. Conifer trees present a set of genome features that make them unique (MacKay et al., 2012). Most notorious among these features is their uniformly large genome size, varying from 18 to 35 Gpb in size (Murray et al., 2012). They also contain a large fraction of repetitive sequences, have a gene space representing less than 1% of their genome, a unique evolutionary trajectory in many gene families compared to angiosperms, and low mutation rates (reviewed in Parent et al., 2015), which are thought to have contributed to their adaptation to diverse environments (Fig.1.2). One example of evolution that is relevant for adaptation to climate change is that some gene families involved in abiotic stress responses, including dehydrin encoding genes, have expanded in white spruce compared to angiosperm plants (Rigault et al., 2011).
This chapter presents recent developments in genome analysis and evolution in forest trees, with a particular emphasis on genes – the functional unit of heredity. Genome evolution invariably results in changes in gene content, which in turn may produce functional changes and are accompanied by changes in gene expression. These various aspects are explored and developments are compared between conifers, which belong to the gymnosperms, and hardwood trees, which belong to the angiosperms. Research hypotheses and objectives are described at the end of the chapter.
Figure 1.1- A. White spruce is a large conifer forest tree. B. It is widely produced in
Canada both in natural forests (as seen here) and plantations and is used in multipurpose manufacture of wood products including boards as well as pulp and paper. C. White spruce is also used in Christmas tree production.
1.2 Genome analysis and evolution
Forest tree genome sequencing has accelerated significantly very recently. With the development of Next Generation Sequencing (NGS) technologies, most forest tree genomes have been reported recently since 2013. To date, published forest tree genomes span both hardwood and conifer trees distributed among several genera including Populus (Tuskan et al., 2006), Salix (Dai et al., 2014), Eucalyptus (Myburg et al., 2014), Betula (Wang et al.,
2013), Fraxinus (http://www.ashgenome.org), Castanea
(http://www.hardwoodgenomics.org/chinese-chestnut-genome), Quercus (Plomion et al,. 2016), Picea (Birol et al., 2013; Nystedt et al., 2013; Warren et al., 2015) and Pinus (Neale et al., 2014; Stevens et al., 2016) (See table 1.1). In this section, we focus on the most fully characterized hardwood genomes which are Populus and Eucalyptus and, on recently available conifer genomes.
Table 1.1- Characteristics of sequence assemblies published for forest trees.
Specie
Genome assembly
No. of
scaffolds Contig N50 (Kbp) Scaffold N50
Populus trichocarpa a 422.9 Mbp 1.4 K 552.8 19.5 Mb Eucalyptus grandis b 691 Mbp 4.9 K 67.2 57.5 Mb Salix suchowensis c 303.8 /425 Mbp 103.1 K 17.4 925 Kbp Betula nana d 450 Mbp 551.9 K 5.1 18.7 Kbp Quercus robur e 1.5 Gbp 17.9 K NA 260 Kbp Picea glauca f * 22.4 Gbp 4.3 M 6.8 19.9 Kbp Picea abies g 19.6 Gbp 10.2 M 0.6 0.72 Kbp Pinus taeda g 22 Gbp 14.4 M 8.2 66.9 Kbp b
release of Phytozome assembly v2, Myburg et al., 2014;
c
Dai et al., 2014; d Wang et al., 2013; e Plomion et al., 2016; f Warren et al., 2015; g Zimin et al., 2014
* : No. of scaffolds ≥ 500 bp
a
release of Phytozome assembly v3, Tuskan et al., 2006; NA : information not available
1.2.1 Genome sequencing and assembly Hardwoods – Populus and Eucalyptus
The first forest trees genome sequenced was that of a P. trichocarpa female tree (Nisqually 1). It was obtained by using a hybrid strategy that combined whole genome shotgun sequencing, construction of a physical map based on bacterial artificial chromosome (BAC) restriction fragment fingerprints, BAC-end sequencing, and extensive genetic mapping based on simple sequence repeat (SSR) length polymorphisms that allowed chromosome reconstruction with the assembled genome (Tuskan et al., 2006).
The improved version of the Populus genome assembly (v 3) has approximately 422.9 Mb. It includes 81 Mb of finished clone sequences combined with a high density physical map, which resulted in a genome assembly of 422.9 Mb. This assembly can be accessed in the JGI comparative plant genomics portal at: http://phytozome.jgi.doe.gov.
For Eucalyptus grandis, the genome assembly was based on whole-genome Sanger shotgun sequencing, paired-end bacterial artificial chromosome sequencing and a high-density genetic linkage mapping, resulting in the first non-redundant chromosome-scale reference (V1.0) sequence (Myburg et al., 2014). A recent comparison between new high-resolution genetic maps for E. grandis and E. urophylla (Bartholomé et al., 2015) with the reference genome highlighted non collinear and non syntenic regions. These regions were corrected in the latest version (V2.0) which is available on Phytozome 11 (https://phytozome.jgi.doe.gov/pz/portal.html). The E. grandis assembly (V2.0) is approximately 691 Mb arranged in 4,943 scaffolds.
Conifers
Genome sequences were recently reported for Norway spruce (Nystedt et al., 2013), white spruce (Birol et al., 2013) and loblolly pine (Neale et al., 2014). In addition, assemblies were released for sugar pine (Stevens et al., 2016) and Douglas-fir
genome sequencing and associated bioinformatics methods (Simpson et al., 2009; Birol et al., 2013; Nystedt et al., 2013; Zimin et al., 2013) which have been applied to analyzing both haploid (Norway spruce and loblolly pine) and diploid conifer DNA. Different strategies were explored to assemble the genomes into contigs and scaffolds. Despite these efforts, assemblies reported to date remain highly fragmented, presenting millions of unordered scaffolds.
The conifer sequences and assemblies are shedding new light into conifer genome evolution (Soltis & Soltis, 2013; De la Torre et al., 2014); however, the very large size and the highly repetitive content of conifer genomes continue to represent a challenge for achieving contiguous assemblies (Warren et al. 2015). We may also expect that pseudogenes, which appear to be abundant in conifer genomes (Bautista et al., 2007; Kovach et al., 2010; Magbanua et al., 2011; Nystedt et al. 2013), will complicate further analyses and finishing of assemblies. To overcome the fragmentation challenge, the conifer sequencing projects have developed bioinformatics tools and make use of sequenced fosmids (Nystedt et al., 2013), BAC clones, RNA-Seq data (Warren et al., 2015) and linking libraries. In parallel to the improvement of reference sequences, another long term objective is to place the scaffolds onto chromosomes, by anchoring the genome assembly to a genetic map (De la Torre et al., 2014).
In contrast to conifers, genome size was not the most important challenge in the genome assembly of Populus and Eucalyptus, but these projects also faced the challenges of assembling repeat sequences represented by transposable elements and duplicated regions originated from whole genome and/or tandem duplications (Tuskan et al., 2006; Myburg et al., 2014). These projects have improved the quality of their genome assembly by increasing contiguity and minimizing haplotypes within the assembly, besides improving linkage maps and scaffold anchoring (https://phytozome.jgi.doe.gov/pz/portal.html).
All of the genomic resources available for forest trees have permitted a better understanding of genome organization, composition and functionality and, through
comparative analyses with other sequenced plant genomes; insights have been gained into forest tree genome evolution.
1.3 Genome evolution
Given the very large difference in genome sizes, it is not surprising that genome structure and evolution differ greatly between Eucalyptus and Populus on the one hand, and conifers on the other. The conifers stand out as having the largest average genome sizes among plant orders, which have been estimated between 18 to over 35 Gbp for major conifers (Murray et al., 2012). In contrast, the genomes of Populus (450 Mbp) and Eucalyptus (640 Mbp) are much more compact. For example, at 20 Gbp, the Picea glauca genome is 31 and 44 times larger than the Populus and Eucalyptus genomes, respectively. It is well known that among angiosperms large genomes are the consequence of multiple genome duplications and polyploidization events with intense periods of transposable element activity and multiplication (Bennetzen 2002). In conifer genomes analyzed to date, retrotransposons are abundant and widespread (Nystedt et al., 2013; Neale et al., 2014, Wegrzyn et al., 2014) and recent evidence indicates that whole genome duplications (WGD) were also involved in the dynamics of conifer genome evolution (Li et al., 2015).
1.3.1 Transposable elements
Transposable elements (TEs) are widespread in plant genomes, exceptionally abundant in species with large genomes, and they play a major role in their evolution. In conifer trees, transposable elements can represent a large portion of the genomes, estimated at 69% in Picea abies (Nystedt et al., 2013) and up to 80% in Pinus taeda (Wegrzyn et al., 2014). Class I TEs (retrotransposons) are by far the most abundant and are primarily represented by long terminal repeat retrotransposons (LTR-RT). The LTR-RT sequences were estimated to represent 58% of the genome both in Picea abies and in Pinus taeda (Nystedt et al., 2013; Neale et al., 2014, Wegrzyn et al., 2014). Only three families, the Ty3/Gypsy, Ty1/Copia and Gymny superfamilies make up the bulk of LTR-RTs in conifers as shown by
Wegrzyn et al., 2014) and BAC sequencing (Kovach et al., 2010; Magbanua et al., 2011; Stival Sena et al., 2014).
Hardwood tree genomes also comprise significant but variable TE content. As in many plant species, retrotransposons account for a major portion of the Eucalyptus genome (44.5%), with LTR-RT sequences being the most abundant (21.9%) (Myburg et al., 2014).
The DNA transposons (class II TEs) represent only 5.6% of the genome and Helitron elements were found to be the most abundant with an estimated 15,000 copies (3.8 % the genome) (Myburg et al., 2014). Populus trichocarpa has approximately 40% of repetitive elements; however, a small fraction seems to be transposable elements as described in RepPop (Zhou and Xu 2009). The most abundant classes of transposable elements are LTR Gypsy and Copia (Douglas and DiFazio 2010).
Transposable elements have variable roles in the evolution of tree genomes. In Populus, it was suggested that very few TEs are transcriptionally active. Their estimated insertion date indicated that Copia and Gypsy elements have both been active after the separation of the different poplar sections but with different time courses (Cossu et al., 2012). A comparison of E. globulus (530 Mbp) and E. grandis (640 Mbp) indicated that recent TE activity only accounts for 2 Mbp of the genome size difference and that a very large number of small non-active transposable elements account for most of the difference. A parallel may be drawn to comparisons between the congeneric A. thaliana (125 Mbp) and A. lyrata (~200 Mbp) genomes but in the case of Arabidopsis most of the difference in genome size could be accounted for by hundreds of thousands of small deletions, mostly in noncoding DNA (Hu et al., 2011).
By comparison, conifers present a very different evolutionary history. The accumulation of TEs in conifers is ancient and has occurred over a very long timeframe spanning tens to hundreds of millions of years (Nystedt et al., 2013). The lack of removal of replicated LTR-RTs appears to be responsible for their massive accumulation rather than a higher rate of multiplication (Morgante and De Poali, 2011; Nystedt et al., 2013).
1.3.2 Gene content
Gene content, i.e. the number of predicted genes, was estimated to be in the same range for Populus and Eucalyptus, but could be slightly higher in conifers. In Populus, Tuskan et al. (2006) identified a first draft reference set of 45,555 protein-coding gene loci in the nuclear genome using a variety of ab initio, homology-based and expressed sequence tag (EST). Since then, the gene models have been improved by using RNA-seq transcript assemblies. Phytozome v10.1 (http://phytozome.jgi.doe.gov) contains 41,335 loci containing protein-coding transcripts for poplar. In Eucalyptus grandis, 36,349 protein-protein-coding transcripts were predicted based on EST and cDNA data. The gene models are also available in Phytozome v10.1 (http://phytozome.jgi.doe.gov).
Gene content estimates range from 50,174 in loblolly pine (Wegrzyn et al., 2014) to 70,968 in Norway spruce (Nystedt et al., 2013), but in the latter case, only about one third of the gene models were reported as high confidence, i.e. supported by expressed sequences. The white spruce gene catalog which is based on transcribed sequences predicted approximately 33,000 genes, fewer than estimated in loblolly pine and Norway spruce (Rigault et al., 2011; Warren et al., 2015). Conifer genome annotations have revealed a surprisingly large fraction of sequences classified as genes or gene-like fragments. Gene-like sequences represented 2.4% and 2.9% of the P. abies and P. taeda genome, respectively, (Nystedt et al., 2013; Neale et al., 2014) and as high as 4% from earlier analyses (Morgante and De Paoli, 2011). This is far larger than would be expected for the number of predicted genes. This discrepancy may be explained by the abundance of pseudogenes reported in conifers (Bautista et al., 2007; Kovach et al., 2010; Magbanua et al., 2011) and truncated and misassembled genes as reported in different gene families by Warren et al. (2015).
One factor that may explain the difference in gene number between Populus, Eucalyptus and conifer species is their different polyploidization histories. Other factors which may have had an influence are tandem duplication frequency and the evolutionary forces that influence the fate of duplicated copies.
1.3.3 Impacts of whole genome duplication and single duplications Hardwoods
Single gene and whole-genome duplications (WGD) have played a major role in the evolution of angiosperm plants. The genome sequences of Populus and Eucalyptus provided evidence of two whole-genome duplications, an ancient paleohexaploidy event shared with many dicotyledonous plants, and a more recent and lineage-specific WGD. The recent WGD detected in Populus was specific of the Salicaceae family and occurred 60-65 Myr ago (Tuskan et al., 2006) whereas, in Eucalyptus, the lineage-specific WGD occurred about 106-114 Myr ago. Interestingly, the Eucalyptus WGD is older than those detected in other rosids and could have played an important role in the origin of Myrtales, since it is estimated to have occurred around the same time as the origin of this plant order (Myburg et al., 2014).
Over the course of evolution, duplicated gene copies resulting from WGD events may be retained, as indicated by the 8,000 pairs of duplicated genes in Populus. Duplicated genes may retain the same set of functions as the ancestral copy (Davis and Petrov, 2004), retain only a subset of the original set of functions (subfunctionalization) (Lynch and Force, 2000; Guillet-Claude et al., 2004), acquire a new function (neofunctionalization), or degrade into a nonfunctional gene (nonfunctionalization) (Ohno, 1970). Rodgers-Melnick et al., (2012) used microarray expression analyses of a diverse set of tissues in Populus and functional annotation to evaluate the factors that are associated with the retention of duplicate genes. They hypothesized that duplicate gene retention from WGD in Populus is driven by a combination of subfunctionalization of duplicate pairs and purifying selection favoring retention of genes encoding proteins with large numbers of interactions, as proposed by the gene balance hypothesis. This hypothesis posits that genes encoding components of multi-subunit complexes are more likely to evolve in concert because the dosage change in the quantities of subunits affects the interaction and function of the whole complex (Birchler et al., 2007).
Gene loss in Populus after the salicoid genome duplication has been less extensive than following the previous whole genome duplication (c. 120 Myr), suggesting that the Populus genome reorganization is a dynamic process in progress. In contrast to Populus, most of the Eucalyptus duplicates have been lost after the most recent WGD. The extensive loss of duplicates in Eucalyptus has been shown by a pairwise comparison of syntenic segments with Vitis, which was selected for comparison as outgroup because it is a basal rosid lineage that is a paleohexaploid and without evidence of more recent WGD events, as were detected in Populus and Eucalyptus (Jaillon et al. 2007).
In contrast to genes encoding proteins with large numbers of interactions, genes with poorly connected products in a network would have an elevated probability of retention following tandem duplication (Ren et al., 2014). A study of the gene family of Class III peroxidases (PRX) in Populus identified other mechanisms that play a role on gene retention such as protein subcellular relocalization associated with a new function. Class III PRX are involved in stress responses in plants but some PRX duplicates have been recruited to cell wall metabolism, including lignin polymerization, or to the vacuole as part of defense responses to abiotic and biotic stresses (Ren et al., 2014). Although the Eucalyptus grandis genome has lost many paralogous genes that appeared following the recent WGD, it has retained genes in tandem duplications (34% of the total genes) at a much higher frequency than observed in the Populus genome (Tuskan et al., 2006, Myburg et al., 2014). Some of the expanded gene families are related to lignocellulosic biomass production, secondary metabolites and oils (e.g. phenylpropanoid biosynthesis, terpene synthase and phenylpropanoid gene families). It was proposed that tandem duplication has a significant role in shaping functional diversity in Eucalyptus (Myburg et al., 2014).
Conifers
Polyploidy has had a large impact in the evolution of angiosperm genomes but in gymnosperms, only a few natural polyploids have been described, among them two conifer species: alerce (Fitzroya cupressoides) and coastal redwood (Sequoia sempervirens)
Although just two conifer species have been identified as polyploids, it was suggested that an older WGD would have occurred before the split of angiosperms and gymnosperms, being restricted to seed plants and not shared with ferns and relatives (Li et al., 2015b). These authors also reported that two independent WGDs occurred in the ancestor of the Pinaceae and that of cupressophyte conifers (Cupressaceae and Taxaceae), about 200 to 342 million years ago and 210 to 275 million years ago, respectively (Li et al., 2015b).
Nystedt et al. (2013) proposed a model for conifer genome evolution with no WGDs and low chromosomal rearrangements in which the 12 ancestral Pinaceae chromosomes expanded at slow rate due the activity of transposable elements. It is well established that transposable elements had an impact in genome size evolution but findings from other authors suggest that the chromosome number is likely to have varied rather than remained static over time since the inception of conifers. Based on very recent work, a hypothesis was supported where more substantial chromosome rearrangements have occurred between conifer families. Within the Pinaceae family, comparative mapping revealed high levels of synteny and collinearity (Pavy et al., 2012; Miguel et al., 2015), suggesting a lack of WGD. However, a comparison of genome structure between Pinaceae and Cupressaceae suggests rearrangements of ancestral conserved blocks with conservation of gene order in the interior of the blocks (de Miguel et al., 2015). The two independent WGDs in Pinaceae and cupressophytes reported by Li et al. (2015) may explain these rearrangements. Additional comparative genomic analyses among different conifer species will be necessary to delineate the impact of these WGDs more fully on the chromosomal organization in different conifer families.
1.3.4 Gene structure
In eukaryotic genes, amino-acid coding sequences are often interrupted by intervening non-coding sequences called introns, which may vary in size and number, and which are removed after transcription. The intron-exon structure varies considerably between genes and its evolution seems to be affected by several factors such as genome size, recombination rate, expression level and even effective population size (Lynch and
Connery, 2003; Deutsch and Long, 1999; Comeron and Kreiman, 2000; Castillo-Davis et al., 2002). As a consequence, the gene structure of homologous genes may vary between different species as a result of their genome architectures and evolutionary histories.
Exon size seems to be more conserved than intron size in forest trees. For example, similar exon lengths have been reported when comparing homologous genes and their exons between Picea glauca and Populus trichocarpa (Stival Sena et al., 2014) and Eucalyptus grandis (Myburg et al., 2014). In contrast, intron lengths are more variable among these species. Conifer genes tend to accumulate long introns with the largest introns surpassing 60 kb in spruce (Nystedt et al., 2013) and 120 kb in pine (Wegrzyn et al., 2014). On average, the P. abies introns are 1000 bp in length, Populus 380 bp and, Eucalyptus approximately 425 bp (Tuskan et al., 2006; Nystedt et al., 2013; Myburg et al., 2014). The intron average length is higher in conifer genes, which typically accumulate one or a few very long introns although the majority of introns are in the 100 – 200 bp range and are comparable in size to those found in angiosperms (Stival Sena et al., 2014).
Comparative analyses have shown conserved gene structure among conifers. Selected orthologous genes between P. glauca and P. taeda clearly showed the conservation of gene structure and the distribution of intron sizes despite a divergence time of 100 to 140 Myr (Stival Sena et al., 2014). The conservation of long introns was also observed across gymnosperm taxa, where a group of long introns in P. abies was identified as orthologous to long introns in P. sylvestris and Gnetum gnemon (Nystedt et al., 2013). These observations pointed to the slow evolution of conifer gene structure and suggest that the long introns observed in conifers likely date back to the divergence of major conifer groups.
1.4. Evolution at the functional level 1.4.1 Evolution of gene families
A gene family is a group of genes that have descended from a common ancestral gene. The size of a gene family is variable across different species and may have an impact on adaptation and speciation. The main factors that affect gene family size are gene duplication and gene deletion.
Gene duplications can occur as consequence of WGDs or at a smaller scale by segmental duplications or tandem duplications. Unequal crossing over and transposable element activity are the most common molecular mechanisms causing segmental duplication. The duplicated genes can be preserved by neo-functionalization or sub-functionalization, which means to evolve a new beneficial function or to partition an ancestral function among duplicated copies (Lynch and Force, 2000; Guillet-Claude et al., 2004). Another possible scenario is that the duplicate gene becomes non-functional (Lynch and Force, 2000). Gene losses can be the consequence of an abrupt mutational event with physical removal of the gene from the organism’s genome or the consequence of a slow accumulation of mutations with loss of function (Albalat and Ca ñestro, 2016). The process of expansion or contraction of gene number is influenced by the molecular processes involved in gene duplication and also the population genetic forces that impact the dynamics of newly arisen genes (Lynch and Force, 2000).
Many gene families are shared among plants as a “core” proteome (Guo, 2013). Comparative analyses and phylogenetic studies of gene families have shown different evolutionary trajectories between conifers and angiosperms. These different trajectories can lead to expansion or contraction of gene families, facilitating functional specializations and structure variation in protein sequences. In this section, we examine the different evolutionary trajectories of a few gene families in angiosperms and conifers, highlighting the variation in the number of gene family members and possible variations in protein structure.
The expansion and contraction of many gene families has contributed to the evolution and biology of plants. A few gene families involved in lignocellulosic biomass production, secondary metabolites, reproduction and response to biotic/abiotic stresses have been investigated because of their relevance to the growth habit and longevity of many forest tree species. They include transcription factors such as R2R3-MYB NAC and knox-1, terpene synthase genes, late embryogenesis abundant family (LEA) gene families, which we discuss here. Other gene families that have been discussed elsewhere include enzymes involved in the biosynthesis of lignin precursors, peroxidases and laccases, auxin transporters (Aux/IAA), GRAS family of transcription factors, among others (Tuskan et al., 2006; Myburg et al., 2014; Li et al., 2015a).
Phylogenetic analyses have been useful to compare the different evolutionary trajectories of gene families among various species. Let us take as examples the NAC and MYB gene families that are part of the network of transcription factors regulating secondary cell wall biosynthesis. Eucalyptus grandis has the largest NAC domain family (189 members) (Hussey et al., 2015) when compared to Arabidopsis thaliana (117 members) (Naruzzaman et al., 2010), Populus trichocarpa (163 members) (Hu et al., 2010), Vitis vinifera (74 members) (Wang et al., 2013), Oryza sativa (151 members) (Naruzzaman et al., 2010) and Picea glauca (36 members) (Duval et al., 2014). The NAC expansion in Eucalyptus is mainly explained by tandem duplications in several clades (Hussey et al., 2015). Most NAC subfamilies are represented in angiosperms with apparently no specific lineages, with the exception of one subfamily in the Solanaceae (Singh et al., 2013). The NAC genes in conifers are not distributed among all clades (Pascual et al., 2015).
This gene family is defined by a NAC DNA-binding domain in the N-terminal region. The protein domains are compact and conserved regions of a protein that often are related to a distinct function (Bagowski, Bruins and Velthuis, 2010). In the case of NAC, it has been associated with DNA binding and the formation of homo- or heterodimers with other NAC domains (Olsen et al., 2005). Beyond domain functional classification, conserved motifs have been identified in many protein families. NAC genes present a modular structure with
N-terminal regions are conserved among angiosperms and gymnosperms while the C-terminal region is more variable, presenting lineage-specific motifs (Pascual et al., 2015; Hussey et al., 2015).
For the MYB gene family, Populus harbored the larger R2R3-MYB family (192 members) as a consequence of gene retention after a quite recent WGD in the Salicaceae lineage and tandem gene duplications (Wilkins et al., 2009). Eucalyptus and Picea glauca possess a total of 141 (Soler et al., 2015) and 122 (Rigault et al., 2011) MYB genes, respectively. Unequal expansion of particular clades has been observed in the R2R3-MYB gene family. The subgroups WPS-I to WPS-V are only present in woody species and some of them seem to be implicated in the regulation of wood development (Soler et al., 2015). Another subgroup (Sg4C) has expanded mainly in conifers with evidence of gene family expansion after the split of angiosperms and gymnosperms (Bedon et al., 2010). The MYB gene family also presents a modular structure. As the NAC gene family, it has a conserved DNA binding domain in the N-terminal region and a more variable C-terminal region. The MYB DNA binding domain is composed of sequence repeats, and as the name suggests, R2R3-MYB are composed by repeats R2 and R3 (Ambawat et al., 2013). This region is highly conserved between angiosperms and gymnosperms while in the C-terminal region, lineage-specific motifs were identified in conifers (Bedon et al., 2007).
The terpene synthase (TPS) gene family has also attracted much recent attention for its expansion in Eucalyptus (113 genes) (Külheim et al., 2015) and in Picea glauca (83 genes) (Warren et al., 2015), when compared to other angiosperms such as Populus (32 genes) (Tuskan et al., 2006) and Arabidopsis (32 genes) (Aubourg et al., 2002). This gene family is important in the synthesis of terpenes, which are compounds with protective functions against pests, which are highly relevant in ecological interactions. Four of the seven subfamilies are lineage-specific: TPS-a, TPS-b and TPS-g are angiosperm-specific and the subfamily TPS-d is gymnosperm-specific (Keeling et al; 2011). Lineage-specific expansion occurred in the TPS gene family. In flowering plants, TPS-a usually account for more than half of their TPS genes (Chen et al., 2011) while in conifers, the majority are TPS-d (Keeling et al; 2011; Warren et al., 2015). In Eucalyptus, the expansion of the gene family
was mainly due to single duplications, since they are mainly organized in tandem arrays (Külheim et al., 2015). The vast diversity found in the TPS gene family is reflected in their functional diversification. Several functional characterizations have been reported, however many genes remain to be characterized (Bohlmann et al., 1997; Keeling et al., 2011; Chen et al., 2011). For example, in Eucalyptus, the role of TPS genes in non-green tissues remains unknown (Külheim et al., 2015).
The Late Embryogenesis Abundant (LEA) gene family is a multigene family involved in the response to abiotic stresses such as drought, cold, salinity and heat. They are not only associated with environmental changes but also to water limitation produced under normal conditions during plant development such as the development of seeds (Battaglia et al., 2008). The LEA proteins can be classified in seven different groups based on their specific amino-acid motifs. The number of LEA genes varies among Eucalyptus (129 genes) (Li et al., 2015a), Populus (53) (Lan, Gao and Zeng, 2012) and Picea glauca (122) (Rigault et al., 2011), and there is even a greater variation between the different classes. For example, in Picea glauca, almost half of LEA genes are dehydrins (Rigault et al., 2011), showing an expansion of this class when compared to Eucalyptus (14 dehydrins) (Li et al., 2015a), and Populus (10 dehydrins) (Lan, Gao and Zeng, 2013). On the other hand, the high number of LEA genes in Eucalyptus is due to the many tandem duplications that occurred in another LEA class that has been called LEA2 (85 members) (Li et al., 2015a).
The most studied LEA genes are the dehydrins. They are composed of many amino-acid motifs (K, S, A, E, Y segments) presenting a variable composition and rearrangements of motifs. The K-segment defines the dehydrins and is present in all dehydrins studied to date with one exception in Pinus taeda (Perdiguero et al., 2014). Other motifs are lineage-specific such as the Y-segment present only in angiosperms (Tunnacliffe and Wise, 2007) and the A- and E-segments present only in conifers (Perdiguero et al., 2012). The different dehydrins have diversified expression profiles under drought, cold or salinity stresses. The relationship between classification and expression profiles is still unclear (Perdiguero et al., 2012; Falavigna et al., 2015; Hundemark and Hincha, 2008), though Perdiguero et al.
1.4.2. Gene expression
1.4.2.1 Response to abiotic stress with emphasis on dehydration
As sessile and perennial organisms, trees have to endure environmental stresses such as drought, salinity and high and low temperatures. These environmental changes affect tree physiology and metabolism, impacting their growth and development as consequence (Cramer et al., 2011; Mackay and Dean, 2011). Stresses like drought, salinity and cold are interrelated, causing loss of cell water and decrease of cell osmotic potential, disrupting the osmotic and ionic homeostasis. Cell turgor also decreases, and as consequence, leaf expansion rate and plant growth rate also decrease (Duque et al., 2013). To adapt to adverse conditions, plants have developed cascades of molecular networks. The initial stress signals trigger downstream signaling processes and transcriptional regulation, which activate genes and proteins implicated in stress defensive mechanisms to re-establish cellular homeostasis and repair damaged proteins and membranes (Vinocur and Altman, 2005; Gong, Rao and Yu, 2013).
In recent years with the advance of sequencing technologies, several studies in forest trees have focused on understanding the transcriptomic network involved in stress response, especially drought stress (Harfouche, Meilan and Altman, 2014). Microarray and RNA-seq based transcriptomic studies have shown that environmental stresses affect gene expression of several groups of genes (Harfouche, Meilan and Altman, 2014). The expression patterns of genes involved in the response can be conserved but can also vary depending on the species, the genotype, the tissue and the type of stress. For example, the comparison of two genotypes of Populus showed differences in transcript abundance in response to drought (Wilkins et al., 2009). Moreover, comparisons of the transcriptome of leaves and roots have identified organ specificity in response to water deficit (Bogeat-Triboulot et al., 2007). In another example, transcriptome comparisons were made between two conifers (Pinus contorta and the natural hybrid Picea engelmannii x Picea glauca) that diverged over 100 million years ago (Savard et al., 1994). The analyses involved conditions varying in temperature, humidity and day length, and it showed that despite the time of divergence
between the two species, they have conserved expression patterns in response to stress in several orthologous genes (Yeaman et al., 2014).
Substantial knowledge has accumulated about proteins induced under dehydration stress (Ramanjulu and Bartels, 2002). One of the groups of proteins that accumulate during dehydration is the LEA. The LEA proteins have been described in a range of plants, from ferns to angiosperms. The LEA proteins are hydrophilic and accumulate in vegetative tissues under normal conditions and seeds at the last stages of embryogenesis (Tunnacliffe and Wise, 2007). LEA genes have been largely studied in many angiosperms and their expression profiles indicate that not all LEA genes are implicated in dehydration stress response (Tunnacliffe and Wise, 2007; Wang et al., 2007; Bies-Ethève et al., 2008; Lan, Gao and Zeng, 2013). In Populus, nine LEA genes from three different classes (4, 7 and 8) were differentially expressed under salt and drought stress. The LEA 4 class, which is the largest LEA group in Populus, presented the highest number of genes (6 genes) with differential expression under stress. Only two dehydrins (called LEA 8) responded to drought and salt stress (Lan, Gao and Zeng, 2013). In gymnosperms, many LEA genes have been identified (Gonzalez-Martinez et al., 2006; Lorenz et al., 2011; Rigault et al., 2011; Reid et al., 2013), but only a few of them have been studied structurally and functionally. Among conifer LEA genes, mainly dehydrins have been implicated in drought response (Perdiguero et al., 2012; Eldhuset et al., 2013; Perdiguero, Soto and Collada, 2015), in cold stress (Joosen et al., 2006) and in timing of bud burst (Yakovlev et al., 2008).
1.4.2.2 The dehydrin family
The dehydrin proteins have been shown to be implicated in biochemical processes such as buffering water, sequestering ions, stabilizing membranes, and also acting as chaperones (Kovacs et al., 2008). Their unstructured nature, lacking defined secondary and tertiary structure, confers the inability to denature during desiccation or at freezing temperatures. The unfolded state of dehydrins, their higher accumulation in various compartments inside the cells, and their capability to bind water, confers the capability of keeping the original
cell volume and preventing cellular collapse under dehydration conditions (Hanin et al., 2011).
In accordance with the cellular function of their gene products, the accumulation of dehydrins transcripts has been correlated with the effects of dehydrating conditions (Graether and Boddington et al., 2014). Several of these proteins are important in growth and plant development under permissive conditions since they accumulate in several tissues such as stem, leaves, flowers, fruit, phloem and xylem under normal conditions (Nylander et al., 2001; Bies-Ethève et al., 2008).
In Populus under normal growth conditions, different dehydrins were expressed in at least one of the following tissues: young leaves, roots, xylem and female and male catkins; presenting a diversified expression profile (Liu et al., 2012). In the PiceaGenExpress database (Raherison et al., 2012) the Picea glauca dehydrins showed also diversified expression profiles. Eight dehydrins were expressed in all tested tissues: vegetative buds, foliage, xylem, phelloderm, roots, megagametophytes and embryogenic cells, while the other 42 dehydrins were expressed in at least one of these tissues, wherein the great majority was expressed in more than four of the tissues listed above (Raherison et al., 2012).
Dehydrin expression can change in response to dehydration following drought, salinity or cold, but it is not a rule for all dehydrins. From the eight dehydrins analyzed in Pinus pinaster and Pinus pinea, three of them showed notable expression increase in roots and needles with the increase of water deficit. In the stem only, Pinus pinea showed an expression increase of these three dehydrins (Perdiguero, Soto and Collada, 2015). In Picea obovata, eight out of nine dehydrins increased their expression during acclimation to low temperature and decreased expression during deacclimation, suggesting an implication of dehydrins in protecting cells and tissues against freezing (Kjellsen et al., 2013), as suggested in other woody species. Similar patterns were observed in Malus domestica, Populus nigra, and Prunus persica, among others (Wisniewski et al., 1996). Under stress
conditions, only one dehydrin (PgDhn1) could be characterized in Picea glauca, revealing induction upon drought and cold stress (Richard et al., 2000).
1.5. Project context, research objectives and hypotheses
This thesis addresses two main subjects related to the evolution of genes in conifers. First, the evolution of gene structure is examined in the context of specific genome features that may have an impact on their evolution. Second, the evolution of the dehydrin gene family was analyzed to follow up on the observation of Rigault et al. (2011) that the dehydrin family was larger in conifers by reconstructing phylogenetic relationships and analyzing expression in response to dehydration stress.
This research was initiated before any of the conifer genome sequences were available, but different projects were underway to sequence the genomes of white spruce, Norway spruce and loblolly pine (Birol et al. 2013, Nystedt et al. 2013, Neale et al. 2014). A small number of BAC sequences had become available and other genomic sequence data was being produced including exome capture data. It thus became possible to catch a first glimpse of gene structure on a larger scale than previously possible in conifers. The accumulation of RNA-Seq data (Verta et al. 2016) and large-scale gene expression profiles (Raherison et al. 2012, 2015) complementing the gene catalogue available in white spruce (Rigault et al. 2011) also translated into opportunities to investigate entire gene families efficiently. Within this context of developing white spruce genomic resources, specific objectives and hypotheses were developed.
1.5.1 Gene structure evolution in conifers
We aimed to develop an understanding of gene structure in conifers based on interspecific comparisons in conifer trees and angiosperm plants by examining exon and intron sequences. We explored three main hypothesis: (1) Intron length is the major type of variation affecting gene structure in conifers compared to other plant species; (2) there is a positive relationship between genome size and intron length when comparing Picea glauca
taeda present a conserved gene structure despite the fact that they diverged over 100 million years ago in keeping with their low rate of genome evolution.
The analyses initially focused on sequences isolated from a white spruce BAC library through comparisons with loblolly pine (Pinus taeda) BAC sequences and genome sequences from angiosperm plants. We then expanded the analyses to include sequences from the first genome draft assembly and sequence capture data from white spruce.
Our objectives were: (1) to define the gene structure (exons and introns) of 35 genes of Picea glauca taking into account gene expression profiles, i.e. highly expressed ubiquitous genes as well as more specialized genes with tissue preferential expression; (2) perform comparative structural analyses of the 35 Picea glauca genes and their close homologues in Arabidopsis thaliana, Zea mays and Populus trichocarpa; (3) perform pairwise comparisons of introns and exons between Picea glauca and Pinus taeda; (4) develop a Picea glauca repetitive library and screen nearly 2000 gene sequences obtained from sequence capture aiming to explore the potential impact of repetitive sequences on intron size.
1.5.2 Molecular structure and evolution of dehydrins in Picea glauca
A preliminary identification of 53 dehydrin genes in the white spruce transcriptome database (Raherison et al., 2012) suggested a possible expansion of this gene family in conifers. Taking into consideration the putative function of dehydrins, a premise of this work was that the expansion of this gene family could be linked to adaptation to dehydration stress resulting from arid or very cold conditions. As a basis to understand the role and evolution of dehydrin genes in conifers and to evaluate their involvement in water stress responses, we explored the following hypothesis: (1) the dehydrins containing the A- and E-segments exclusive to conifers, classified as A2E2SKn and ESKn, harbor profiles of increased expression under water deficit conditions: (2) Picea glauca dehydrins are classified in diverse groups presenting divergent patterns from angiosperm dehydrins.