AVIS
Ce document a été numérisé par la Division de la gestion des documents et des archives de l’Université de Montréal.
L’auteur a autorisé l’Université de Montréal à reproduire et diffuser, en totalité ou en partie, par quelque moyen que ce soit et sur quelque support que ce soit, et exclusivement à des fins non lucratives d’enseignement et de recherche, des copies de ce mémoire ou de cette thèse.
L’auteur et les coauteurs le cas échéant conservent la propriété du droit d’auteur et des droits moraux qui protègent ce document. Ni la thèse ou le mémoire, ni des extraits substantiels de ce document, ne doivent être imprimés ou autrement reproduits sans l’autorisation de l’auteur.
Afin de se conformer à la Loi canadienne sur la protection des renseignements personnels, quelques formulaires secondaires, coordonnées ou signatures intégrées au texte ont pu être enlevés de ce document. Bien que cela ait pu affecter la pagination, il n’y a aucun contenu manquant.
NOTICE
This document was digitized by the Records Management & Archives Division of Université de Montréal.
The author of this thesis or dissertation has granted a nonexclusive license allowing Université de Montréal to reproduce and publish the document, in part or in whole, and in any format, solely for noncommercial educational and research purposes.
The author and co-authors if applicable retain copyright ownership and moral rights in this document. Neither the whole thesis or dissertation, nor substantial extracts from it, may be printed or otherwise reproduced without the author’s permission.
In compliance with the Canadian Privacy Act some supporting forms, contact information or signatures may have been removed from the document. While this may affect the document page count, it does not represent any loss of content from the document.
Development of Cellular and Gene Therapies for
IJ-
Thalassemia and
Sickle Cell Disease
By
Hady Felfly
Molecular Biology Program
Faculty of Graduate Studies
Thesis presented to the Faculty of Graduate Studies in partial
fulfillment of the requirements of the degree of Doctorate of
Philosophy in Molecular Biology
February,2008
2008 JUIN 0 5
Université de Montréal
Faculty of Graduate Studies
This Thesis entitled:
Development of Cellular and Gene Therapies for
p-
Thalassemia and
Sickle Cell Disease
Presented by:
Hady Felfly
Was evaluated by a jury composed of the following people:
Claude Perrault, Ph.D.
PresidentMarie Trudel, Ph.D.
SupervisorJacques Galipeau, M.D.
MemberGeorges Atweh, M.D.
External Examinator...•.•...••••••••••••••••...••••••••••
Deleguae of the DeanRÉsUMÉ
La p-thalassémie et la drépanocytose sont deux maladies hématopoïétiques qui résultent d'anomalies affectant la chaine P-globine de l'hémoglobine (Hb). L' Hb est la molécule qui transporte l'oxygène et c'est normalement un tétramère formé de deux chaines d'(1-globine et deux chaine de P-d'(1-globine. La p-thalassémie est caractérisée par un débalancement entre les chaines de (1- et p-globine dû à une absence ou diminution du taux de la globine résultant en une anémie. La drépanocytose est causée par une P-globine anormale qui entraine la formation de globules rouges anormaux allongés, appelés drépanocytes. Ceci résulte en une anémie, ainsi que des vaso-occlusions aboutissant à des complications ischémiques dans tous les organes. Les deux maladies sont associées à une morbidité et une mortalité élevée. La transplantation de moelle osseuse (m.o.) est un traitement potentiellement curatif. La transplantation allogénique est disponible pour une minorité de patients qui auront des donneurs histocompatibles, et laisse les receveurs vulnérables à la réaction de greffon contre l'hote. La transplantation autologue devrait en principe permettre d'éviter ces complications. D'autre part, des cas où des patients receveurs de transplantation de m.o. ne dépendaient plus de transfusions même avec seulement un chimérisme partiel, suggèrent qu'un remplacement total de la m.o. ne semble pas nécessaire pour avoir un effet thérapeutique. De plus, des études cellulaires chez des modèles murins suggèrent que les anomalies de la lignée érythroide thalassémique et drépanocytaire pourront conférer un avantage sélectif pour les cellules érythroides normales suite à une transplantation de m.o. Ce qui précède suggère qu'une correction de ces deux maladies pourrait être possible avec un remplacement partiel de la m.o., et indique qu'il y a un besoin important de développer des stratégies de transplantation de m.o. appropriées pour établir un chimérisme stable et efficace.
Cette thèse porte principalement sur le développement de conditions optimales de thérapies cellulaires pour la p-thalassémie et la drépanocytose par transplantation de m.o., avec des pré-requis minimals. En utilisant des modèles murins de la p-thalassémie
intermedia et de la drépanocytose, j'ai d'abbord déterminé le pourcentage minimal de
cellules de m.o. normales nécessaire pour avoir une correction du phénotype à long terme, en générant des séries de chimères hématologiques. Mes résultats ont établis une
intervalle de 19-24% (~-thalassémie) et 26-31 % (drépanocytose) de cellules de m.o. normales comme étant le niveau thérapeutique corrigeant les différents aspects des deux maladies, et la durée de vie des souris est devenue normale. Ces résultats ont démontré qu'un remplacement" partiel de m.o. malade peut corriger les phénotypes thalassémiques et drépanocytaires. Conséquemment, mon étape suivante a été de déterminer le niveau minimal de cellules et de myélosuppression, ainsi que les stratégies optimales de transplantation, qui permettront d'atteindre ce niveau thérapeutique chez des receveurs malades. Pour cela, j'ai effectué des transplantations de m.o. sur des souris thalassémiques et drépanocytaires après une myélosuppression partielle en modulant cinq paramètres. J'ai établi les conditions de transplantations qui permettent à 100% des souris transplantées d'avoir une prise de greffon et des niveaux thérapeutiques de chimérisme après une dose d'irradiation de 1Gy ou 2Gy, à condition que suffisamment de cellules soient injectées au temps approprié après l'irradiation. J'ai aussi déterminé qu'une transplantation de m.o. sans aucune myélosuppression peut permettre jusqu' à 100% des souris transplantées d'avoir une prise de greffon. Finalement, j'ai effectué une évaluation in vivo d'un nouvel vecteur lentiviral portant un gène de y-globine humaine et démontré une expression efficace et long-terme du transgène après transduction des cellules souches hématopoïétiques avec une faible quantité de particules virales.
En conclusion, j'ai déterminé le pourcentage minimal de cellules de m.o. nécessaire pour corriger significativement le phénotype murin de la ~-thalassémie intermedia et de la drépanocytose à long terme. J'ai aussi optimisé les stratégies de transplantation de m.o. et d'une manière reproductible achevé un remplacement partiel thérapeutique de la m.o. de souris malades après un niveau de myélosuppression modérée des receveurs. De plus, j'ai démontré l'efficacité in vivo d'un nouvel vecteur lentiviral portant le gène de y-globine humaine. Mes études constituent une base pour developper des transplantations de m.o. chez l'humain afin de traiter la ~-thalassémie et la drépanocytose avec des pré-requis minimals de cellules et de myelosuppression.
Mots clés: ~-thalassémie, drépanocytose, érythropoïèse, hémoglobine, globule rouge, transplantation de moelle osseuse, chimère, thérapie cellulaire, thérapie génique.
SUMMARY
~-thalassemia and sickle cell disease (SCD) are two hematopoietic disorders that result from anomalies affecting the adult ~-globin chain of hemoglobin. Hemoglobin is a tetramer that transports oxygen and is constituted of two a-globins and two ~-globins
chains. ~-thalassemia is characterized by an imbalance between a- and ~-globin chains due to decreased levels or absence of ~-globin resulting in anemia. SCD is due to the production of an abnormal ~-globin leading to the formation of abnormal elongated red blood cells (RBC) called sickled RBCs. This results in anemia as weIl as vaso-occlusions leading to ischemic damage of aIl organs. Both diseases are associated with high morbidity and mortality.
Bone marrow transplantation (BMT) (stem cell transfer) is a potentially curative treatment. However, allogenic BMT which leaves the recipients vulnerable to graft versus host disease is available to only a minority of patients with histocompatible donors. Autologous BMT with gene therapy could in principle prevent these complications and exp and the range of patients who could benefit from a BMT. On the other hand, while complete bone marrow (BM) replacement was previously considered necessary to overcome the disease phenotype, cases of occasional transfusion-independent patients with mixed chimerism after BMT suggest otherwise. Furthermore, strong myeloablative pre-conditioning regimens by irradiation and chemotherapy would not be required for achieving mixed chimerism, thus sparring multiple side effects. In addition, cellular studies in mouse models have suggested that the anomalies of the erythroid cells in ~-thalassemia and SCD would confer a selective advantage for normal erythroid cells after BMT. What preceded implies that a correction of both diseases would be possible by a partial replacement of the recipient's BM, and highlights the need to develop appropriate BMT strategies that allow establishing stable and efficient chimerism.
This thesis describes mainly the establishment of optimal conditions of cellular therapy for ~-thalassemia and SCD by BMT, with minimal requirements of cells and
myelosuppression. Using mouse models of p-thalassemia intennedia and SCD, 1 first determined the minimal percentage of normal bone marrow (BM) cells necessary for long term phenotype correction of both diseases by generating series of hematopoietic chimeric mice. My results established the range of 19-24% (p-thalassemia) and 26-31 % (SCD) normal BM cells as the therapeutic threshold for correction of these diseases, and mice lived to a normal lifespan. These results demonstrated that a partial replacement of the diseased BM is sufficient to correct the thalassemic and SCD phenotypes. Therefore, my second step was to determine the minimal level of myelosuppression and cellular requirements, as weIl as the optimal transplantation strategies, which could allow reaching that therapeutic threshold. To this end, 1 performed BMTs on sickle and thalassemic mice after minimal myelosuppression by modulating five transplantation-related parameters. 1 established transplantation conditions allowing 100% of recipients to engraft with therapeutic levels of chimerism after an irradiation dose of IGy or 2Gy, provided appropriate number of cells and timing of infusion after conditioning. 1 also determined that BMTs without prior myelosuppression allows up to 100% of recipient mice to engraft. Finally 1 performed an in vivo evaluation of a novel lentiviral vector carrying the human anti-sickling y-globin gene and demonstrated long term efficient expression of the transgene after transduction of hematopoietic stem cells with low load of infectious units.
In conclusion, 1 determined the minimal percentage of normal BM cells that can significantly correct murine p-thalassemia intennedia and SCD for long term. 1 have also optimized transplantation strategies and reproducibly achieved therapeutic partial replacement of diseased murine BM after minimal myelosuppression of recipients. Furthermore, 1 demonstrated the in vivo efficiency of a nov el globin lentiviral vector. My studies constitute the basis for transplantation therapies in human p-thalassemia and SCD with minimal conditioning and cellular requirements.
Keywords: p-thalassemia, sickle cell disease (SCD), erythropoiesis, hemoglobin, red blood ceIl, bone marrow transplantation, chimera, cellular therapy, gene therapy.
TABLE OF CONTENTS
TITLE OF T.HE. T.HE.SIS ••••...•...•••••••.•.•...•...••••••...••...••••••••..••••••••••...•. i
IDENTIFICATION OF T.HE. JURy ••••.•...•••••••••••••...•••••••...•••••... ii
, , ~SlJ~ ..••••••...•.•••••...••.•••••••.••...•...••••••••••.••••.••••.•...•....•••.... iii
~lL~Y ••••••••••••••••••••••••••••••••••••••••••••••••••••••••••••••••••••••••••••••••••••••• v TABLE OF CONTENTS ••...•...•••••.•.••.••.•••.••••...••..••••••.••••••..•••••..•.••.• vii
LIST OF FIGURES ...•...•...•.•.••...•...•...•... xiii
LIST OF TABLES ••••••••..•.•••••••••••.•.•.•....••••••••••••••••••••••••••••...••..•••••••••• xv
LIST OF ABB~VIATIONS •.••••••••••••••••..•.•••••••••••••••••••.•...•.••••••••.•••••• xix
DEDI CATIONS •.•....•••••••••••.•....•..•.•••••••••••••••••••••••••.•...•••••••...•..• xxii
ACKNOWLEDGE~NTS ...••••••••••.••••..••••••••••.••...•...••••••••••••••••.••••• xxiii
CHAPTERI. INTRODUCTION ... ' ... 1
1.1 Hematopoiesis and the hematopoietic system ••••••••••••••••••••••••••••••••••••••••• .2 1.1.1 The hematopoietic tissue ... A 1.1.1.1 Bone marrow ... ; ... 4
1.1.1.2 Spleen ... ~ ... 5
1.1.1.3 Developmental hematopoietic organs ... 6
1.1.1.4 Blood ... 7
1.1.2 Stem cells of the hematopoietic system ... 7
1.1.2.1 Definition and types ... 7
1.1.2.2 Hematopoietic stem cell niche ... 9
1.1.2.3 Hematopoietic stem ceIl homing ... 9
1.1.3 Erythropoiesis ... 11
LIA The red blood cells (RBC) ... 14
1.1.4.1 General properties of RBCs ... 14
1.1.4.2 RBC senescence ... 15
I.1.5.1 Nonnal globins in human ... 17
I.1.5.2 Nonnal globins in the mouse ... 18
I.1.5.3 Hemoglobin variants ... 19
1.2 Anemias and hemoglobinopathies ... 19
I.2.1 General symptoms of anemias ... 19
I.2.2 Pathophysiology and classification of anemias ... 20
I.2.3 The thalassemias ... 21
I.2.3.1 Epidemiology of the thalassemias ... 21
I.2.3.2 Molecular basis of ~-thalassemia ... .22
I.2.3.3 Pathophysiology of ~-thalassemia ... 23
I.2.3.4 Clinical manifestations of ~-thalassemia ... 25
I.2.3.5 Treatment options for ~-thalassemia ... 27
I.2.3.6 Spectrum of the thalassemias ... 27
I.2.4 Sickle cell disease (SCD) ... 29
I.2.4.1 Epidemiology of SCD ... .29
I.2.4.2 Molecular basis of SCD ... 30
I.2.4.3 Spectrum of sickle cell disorders ... .30
I.2.4.4 Pathophysiology of SCD ... .33
I.2.4.5 Clinical manifestations of SCD ... 36
I.2.4.6 Hereditary persistence of fetal hemoglobin ... .38
I.2.4.7 Treatment options for SCD ... .39
I.3.Bone marrow transplantation (BNIT) ... . 40
I.3.1 History of BMT ... 41
I.3.2 Immunological difficulties with allogenic BMT ... .42
I.3.3 Modalities of BMT ... .43
I.3.3.1 Route of cell transfer ... .43
I.3.3.2 Number of cell doses ... .44
I.3.3.3 Timing of cell transfer after myeloablative conditioning ... .44
I.3.4 Conditioning regimens ... .44
1.4. Gene therapy ... 46
1.4.1.1 Viral delivery systems ... . 047
1.4.1.2 Non-viral delivery systems ... . 047
1.4.2 Lentivirus and lentiviral vectors ... ... 048
104.2.1 Life cycle of HIV -1 ... . 048
1.4.2.2 Genome of HIV -1 ... 49
1.4.2.3 Structural proteins of HIV -1 ... .. 049
1.4.204 Accessory proteins of HIV -1 ... 50
1.4.2.5 Lentiviral and y-retroviral vector ... 50
104.3 Gene therapy trials in mouse models for p-thalassemia and SCD ... 57
1 0 5 0 Mouse models for p-thalassemia and SCDo 0 0 0 0 0 0 0 0 0 0 0 0 0 0 0 0 0 0 0 0 0 0 0 0 0 0 0 0 0 0 0 0 0 0 0 0 0 0 0 0 0 0 0 6 1 1.5.1 Mouse models for p-thalassemia ... 61
1.5.2 Mouse models for SCD ... 63
1.5.2.1 Models producing both murine and human globin chains ... 63
1.5.2.2 Models producing exclusively human globin chains ... 65
CHAPTERIIo AIMS OF THE PROJECT ... 66
CHAPTER 1 1 1 0 )lItTIC~E 1 ... fS~ FOREWORD ... 70 TITLE ... 71 ABSTRACT ... 72 INTRODUCTION ... 73
MATERIALS AND METHODS ... 76
RESULTS ... 80
DISCUSSION ... 97 .
ACKNOWLEDGMENTS ... : ... 102
REFERENCES ... 103
CHAPTERIV. ARTICLE 2 ... ... 109 FOREWORD ... 110 TITLE ... 111 ABSTRACT ... 112 INTRODUCTION ... 113
MATERIALS AND METHODS ... 116
RESULTS ... 119 DISCUSSION ... '" ... 135 ACKNOWLEDGMENTS ... 140 REFERENCES ... 141 SUPPLEMENTARY TABLES ... 144 CHAPTERV. }l1t1rI<:~~ 3 ... ... 1~" FOREWORD ... 148 TITLE ... 149 ABSTRACT ... 150 INTRODUCTION ... 151
MATERIALS AND METHODS ... 153
RESULTS ... 155 DISCUSSION ... 160 ACKNOWLEDGMENTS ... 162 REFERENCES ... 163 CHAPTERVI. ARTICLE 4 ... 167 FOREWORD ... 168 TITLE ... 169 ABSTRACT ... 170 INTRODUCTION ... 171
MATERIALS AND METHODS ... 173 RESULTS ... 176 DISCUSSION ... 185 ACKNOWLEDGMENTS ... 188 REFERENCES ... 189 CHAPfER VII. DISCUSSION ... 195
1. Selection of the mouse models ... 197
2. Generation of chimeric mice ... 198
3. Selective advantage for normal erythroid cells ... 199
4. Protective effect of normal RBCs toward thalassemic RBCs in peripheral blood ... 200
5. Factors contributing to the improvement of the pathology of hemi-pthal chimeric mice ... 201
6. Full correction of many thalassemic disease parameters with very low percentage of normal WBCs ... 202
7. Validation of the therapeutic effect of 19-24% normal WBCs on the thalassemic phenotype ... 202
8. Correction of SCD with low percentage of normal cell chimerism similarly to p-thalassemia ... 203
9. Full correction of all disease parameters is not required for the treatment of p-thalassemia intermedia and SCD ... 205
10. Therapeutic conditions with minimal myelosuppression and cellular requirements ... 206
10.1 BMT with partial myelosuppression and single IV injection of donor cells ... 207
10.2 The importance of multiple injections of donor cells ... 208
10.3 High engraftment efficiency after BMT with no myelosuppression and IV injection of donor celIs ... 208
10.4 Reproducible engraftment after BMT with IBM injection of donor
cells ... 211
11. A novel globin lentiviral vector promising for future applications in gene therapy trials ... 213
12. Potential modifications to optimize lentiviral gene transfer with low MOL ... 215
13. RBC half-life as a comerstone in the therapy of anemia ... 217
14. Clinical extrapolation of the CUITent study ... .219
CHAPTER VIII. CONCLUSION ... .221
REFEREN CE LIS T ... .224
APPENDICE 1 ... . .xxiv
APPENDI CE II ... .. .xxxiv
APPEND 1 CE III ... .xxxvi APPENDI CE IV ... ... .xl APPENDICE V ... .. .xlii APPENDICE VI ... ... .xliii APPENDICE VII ... . .xlv
List of Figures
Chapter l-Introduction
Figure 1. The hierarchial model of hematopoiesis and its regulation by cytokines ... 3
Figure 2. Graphie representation of the bone marrow hematopoeitic tissue ... 5
Figure 3. Histologieal section of a normal spleen ... 6
Figure 4. Stem cell homing after intravenous injection ... 11
Figure 5. Normal red blood cells on peripheral blood smear ... 14
Figure 6. Schematic representation of normal hemoglobin molecule ... 17
Figure 7. Heinz bodies ... 24
Figure 8. Red blood cells in ~-thalassemia major ... ... 25
Figure 9. Sickled red blood cells ... 29
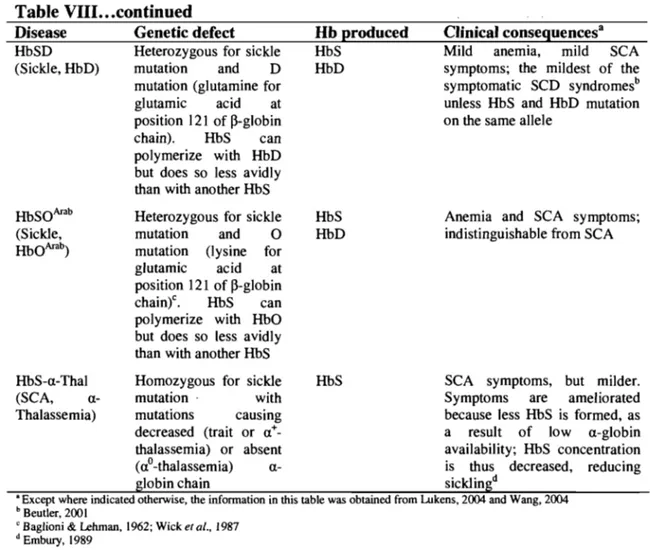
Figure 10. Alterations of RBC membrane by polymers of sickle hemoglobin ... 34
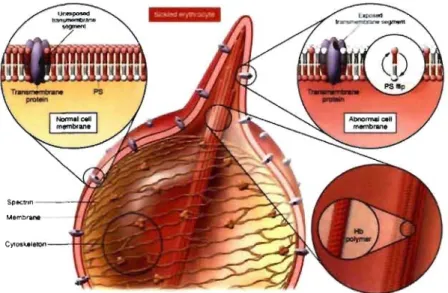
Figure 11. Simplified view of a vaso-occlusive process in siekle cell disease ... 35
Chapter 3-Article 1 Figure 1. Chimerism in hemi-~thal mice ... 81
Figure 2. Peripheral blood cell smears of chimeric hemi-~thal mice ... 84
Figure 3. Analysis of erythroid cell precursor maturation in chimerie hemi-~thal mice ... 88
Figure 4. Histopathologie analysis of chimerie hemi-~thal mice ... 91-92 Chapter 4- Article 2 Figure 1. Chimerism in SAD mice ... 120
Figure 2. Analysis of erythroid cell precursor maturation in SAD chimeric mice .... 127
Figure 3. Histopathologic analysis of chimerie SAD tissues ... 130-131 Chapter 6-Article 4 Figure 1. Self-inactivating lentiviral vectors ... 176
Figure 2. Intensity of expression from lentiviral vectors in MEL cells ... 178
Figure 3. Flow cytometrie functional evaluation of cHS4-EGFP lentiviral vector transduction effieiency ... 179
List of Figures ... continued
Figure 4. In vivo long-term time-course follow-up of EGFP and y-globin positive RBCs in peripheral blood oftransplanted mice ... 181 Figure 5. Various expressing ceIl populations detected by flow cytometry ... 183 Figure 6. Protein analysis of globin chains ... 184
List of Tables
ChaRter 1. Introduction
Table 1. Morphological characteristics of the erythrocyte precursors ... 13
Table II. Changes occurring during aging ofred blood cells ... 15
Table III. Composition of the various normal human hemoglobin molecules ... 18
Table IV. Clinical symptoms of anemia ... 20
Table V. Classification of anemias by etiology ... 21
Table VI. Overview of a-thalassemias ... 27
Table VII. Spectrum of the thalassemia and the thalassemia-like syndromes ... 28
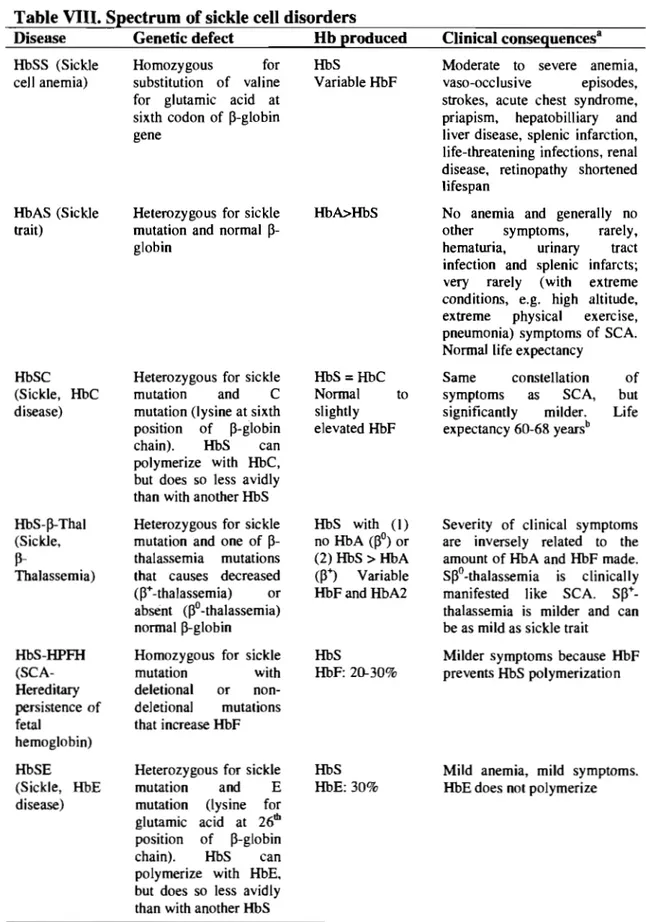
Table VIII. Spectrum of sickle cell disorders ... 32-33 Table IX. Clinical features of sickle cell disease ... .38
Table X. Acessory proteins ofHIV-1 ... 51
Table XI.Major properties of lentiviral and y-retroviral vectors ... 56
Table XII. Major gene therapy assays for ~-thalassemia and sickle cell disease.58-60 Table XIII. Major disease characteristics in the SAD mou se mode!.. ... 64
ChaRter 3- Article 1 Table 1. Hematological parameters of chimeric hemi-~thal mice ... 83
Table 2. Quantification of cellularity and multipotent cells in chimeric hemi-~thal mice ... 87
Table 3. Pathological assessment in chimeric hemi-~thal mice ... 90
Table 4. Engraftment and chimerism of hemi-~thal mice with minimal myeloablation ... 94
Table 5. Hematology parameters of minimally myelosuppressed chimeric hemi-~thal mice ... 95
Table S 1Hematologic parameters of chimeric hemi-~thal mice ... 106
Table S2Quantification of red blood cell morphologic anomalies in chimeric hemi-~thal mice ... 107
Table S3Quantification of erythroid precursor in chimeric hemi- ~thal mice ... 108
List of Tables ... continued
Table 1. Hematological parameters of SAD chimeric mice ... ~ ... 122 Table 2. Quantification of medullary and splenic multipotent cells in chimeric SAD mice ... : ... 124 Table 3. Semi-quantitative analysis of pathology in SAD chimeric mice ... 125 Table 4. Survival of SAD chimeric mice ... : ... 131 Table 5A. Engraftment and chimerism of myelosuppressed SAD mice with one cell dose ... 133 Table 5B. Engraftment and chimerism of myelosuppressed SAD mice with multiple cell doses ... 133 Table SI. Quantification of erythroid precursors in; SAD chimeric mice ... : ... 144 Table S2. Hematological parameters of myelosuppressed SAD chiineric mice ... 145 Table S3. Analysis of hematopoiesis/erythropoiesis in myelosuppressed SAD chimeric mice ... 146
Chapter 5- Article 3
Table 1. Engraftment and chimerism of intravenously-transplanted SAD
chimeric mice ... 156 Table 2. Engraftment and chimerism SAD chimeric mice ffiM-transplanted in single
cell dose ... 157 Table 3. Engraftment and chimerism of SAD chimeric mice IBM-transplanted
in three cell doses ... ~ ... 157 Table 4. Hematological parameters of intra-venously-transplanted SAD
chimeric mice ... : ... 159
ChaRter 6- Article 4
Table 1. Titers of the lentiviral vectors ... 180 Table 2. Percentage of RBCs with y-globin or EGFP as detected by flow cytometry in peripheral blood ofrecipients ... 182
List of Tables •.. continued
Appendix 1- Preliminary results
Table 1.1 Variation of RBC half-life with increasing dose of irradiation ... xxvii
Table 1.2 Variation of RBC half-life with age ... xxix
Appendix 11- Characterization of non-transplanted hemi-6thal mice Table 11.1 Complete blood count ... xxxiv
Table Il.2 Quantification of RBC morphological abnormalities and half-life ... xxxiv
Table Il.3 Erythropoiesis ... xxxv
Table Il.4 Quantification of cellularity and multipotent cells ... xxxv
Table 11.5 Pathologie assessment. ... xxxvi
Table 11.6 Survival ... xxxvi
Appendix 111- Characterization of non-transplanted SAD mice Table 111.1 Complete blood count. ... xxxvii
Table 111.2 Quantification of RBC half-life ... xxxvii
Table 111.3 Erythropoiesis ... xxxviii
Table 111.4 Quantification of cellularity and multipotent cells ... xxxviii
Table 111.5 Pathologie assessment. ... xxxix
Table 111.6 Survival. ... xxxix
Appendix IV - Engraftment efficiencies with mini-transplants
Table IV.1 Engraftment efficiency in partially myelosuppressed and fully
non-myeloablated transplanted SAD mice ... xl Table IV.2 Engraftment efficiency in partially myelosuppressed hemi-~thal
mice ... : ... xli
Appendix V - Donor chimerism in wild-type recipients
List of Tables ... continued
Appendix VI. Production of chimeric mice by CRA
Table V.l Infused versus detected percent age of nonnal WBCs in hemi-~thal
chimeras ... xliii Table V.2 Infused versus detected percentage of nonnal WBCs in SAD
List of Abbreviations
- % Hypo-% Retic -&
-±
: Percentage of hypochromic cells : Percentage of reticulocytes : And
: More or less
-i
:
Increase-~ : Decrease
-AHSP: Alpha hemoglobin stabilizing protein
-BM : Bone marrow
-BMT : Bone marrow transplantation
-bp : Base pair
-CA : Capsid protein
-CFU-S : Colony forming unit in the spleen -cHS4 : Chicken hypersensitive site 4 -CRA : Competitive Repopulation Assay
-dl : Deciliter -DNA -ESC -Elts -Fe++ -ft -Fibn : Deoxyribonuc1eic acid : Epithelial stem cell : Elements
: Ferrous iron
: femtoliter (10-15 liter) : Fibronectin
-g : Gram
-G-CSF : Granulocyte colony stimulating factor
-GIn : Glutamine
-Glu : Glutamic acid
-GVHD : Graft versus host disease
-Gy : Gray
-Hb : Hemoglobin
-HbA : Adult hemoglobin (major form) -HbA2 : Adult hemoglobin (minor form)
-HbC : Hemoglobin C
-HbF : Fetal hemoglobin
-HbS : Hemoglobin S
-HCT : Hematocrit
-HDW : Hemoglobin distribution width -Hemi-~thal : Hemizygous ~-thalassemic
-HG : Human genomic
-HIV : Human immunodeficiency virus -HLA : Human leukocyte antigen
-HS : Hypersensitive
-HSC : Hematopoietic stem cell
-HSCT: Hematopoietic stem cell transplantation -HSPC: Hematopoietic stem and progenitor cell -HTL V: Human T -cellieukemia virus
List of Abbreviations ... continued
-Hyper % -mM -IL -IN -Inc -Ins -ISC -IV -K+ -kb -kd -LCR -Lin--LTR -Lys -M:E-MA
-MCH -MCHC -MCV -MHC-I -MLV -MMTV -MOI -MSC -N:C -NIA -Na+ -NaPy -NC -ND -Nef -N.1. -NK cells -NLS -PB -PCR -PE -pg -Pr. -PR -Prot -Pre -PS: Percentage of hyperchromie cells : Intra-bone marrow
: Interleukin : Integrase : Incubation : Insulin
: Irriversibly sickled cell : Intravenous 1 intravenously : Potassium cation
: Kilobase : Kilodalton
: Locus control region
: Lineage negative 1 negative for lineage markers : Long terminal repeat
: Lysine
: Myeloid-to-erythroid ratio : Matrix prote in
: Mean corpuscular hemoglobin
: Mean corpuscular hemoglobin concentration : Mean corpuscular volume
: Major histo-compatibility antigen type 1 : Murine leukemia virus
: Moloney murine leukemia virus : Multiplicity of infection
: Mesenchymal stem cell : NucIear-to-cytoplasmic ratio : Not applicable : Sodium cation : Sodium pyruvate : Nuc1eocapsid : Not determined : Negative regulator : Not indicated : Natural killer cells
: Nuc1ear localization signal : Peripheral blood
: Polymerase chain reaction : Phosphatidyl ethanolamine : Picogram : Protein : Protease : Protamine : Preculture : Phosphatidyl serine
List of Abbreviations ... continued
-RBC -RDW -RES -Ret -Rev -Ref -RNA -RRE -RT -SCA -SCD -SCF -SIN -SpG -T ceIls -Transf -Tat -Tg -USA -Vif -Vpr -Vpu -WBC -wt -YS -(1 -~_WlIa
j _~min -~-ME -y -3 -€-ç
-!..lm: Red blood ceIl
: Red ceIl distribution width : Reticular endothelial system : Retronectin
: Regulator of expression of viral proteins : References
: Ribonucleic acid : Rev response element : Reverse transcriptase : Sickle cell anemia : Sickle cell disease : Stern cell factor : Self-inactivating : Splenomegaly : T lymphocytes : Transferrin : Transcription activator : Transgene
: United States of America : Viral infectivity
: Viral protein R : V iraI prote in U : White blood cell : Wild-type : Yolk sac : Alpha : Beta : ~-globin major : ~-globin minor : ~-mercapto-ethanol : Gamma : Delta ; Epsilon : Zetta : Micrometer
ACKNOWLEDGEMENTS
1 present my thanks, respect and gratitude, to Dr Marie Trudel, my research supervisor, for receiving me in her lab and providing me quality training. 1 also thank her for her support, her kindness, as weIl as for financial assistance for my studies.
1 would like to thank the members of the jury, who accepted to read my thesis, and who committed valuable amount of their time for its correction.
1 thank the members of the thesis committee who followed me during my formation.
My thanks are addressed to the Faculty of Graduate Studies, for receiving me at the Université de Montréal, providing support during my academic formation, and financial assistance for finishing my thesis
1 am thankful for the Molecular Biology Pro gram, in particular to its director Dr Trang Hoang, and coordinator, Mme Vivianne Jodoin, for their full support during my academic formation.
rd like to thank the Clinical Research Institute of Montreal (IRCM) for providing me quality training during my PhD studies, and its director Dr Eric Cohen for support.
My thanks and gratitude are addressed to Dr James Ellis for the precious collaboration, and for providing me quality training in his laboratory.
1 would like to express my deep thanks and gratitude to the Programme Canadien des Bourses de la Francophonie (PCBF) and aIl its members for providing full support during my presence in Canada. 1 also thank the PCBF for financing my doctoral studies.
Last but not least, my deep thanks and gratitude to my parents, for their love and moral support during my doctoral formation.
CHAPTERI
1.1 Hematopoiesis and the hematopoietic system
Hematopoiesis represents the dynamic processes of blood cell production and development (Baudurant & Khoury, 1998) through a complex network of tissues, organs, stem cells and regulatory factors. (Perkins, 1998). Hematopoiesis proceeds in a hierarchial fashion where an immature undifferentiated pluripotent cell called the hematopoietic stem cell (HSC), under the influence of various cytokines, leads to the progressive formation of hematopoietic cells of restricted potential known as precursors, each committed to give one type of blood lineage (Bell, 2002) (Figure 1). The normal hematopoietic system continuously maintains a cell population of erythrocytes or red blood cells (RBCs) that transport oxygen, leukocytes or white blood cells (WBCs) that perform immune functions, and platelets (or thrombocytes) that play a role in hemostasis. (Baudurant & Khoury, 1998). The hematopoietic system of vertebrates, derived from the mesodermal germ layer in early embryogenesis occurs in two waves. At early stages, the first wave, primitive hematopoiesis, takes place in visceral yolk sac (YS) or its analog (Dieterlen-Lievre, 1975; Lassila et al, 1978), and is characterized by the transient circulation of large, nucleated red cells (Maximow, 1909; Ingram, 1972) that originate in structures known as blood islands (Haar et al, 1971; Silver et al, 1997). The primitive hematopoiesis is followed by a second wave, known as definitive hematopoiesis which takes place in intraembryonic areas (Dieterlen-Lievre, 1975; Lassila et al, 1978), and is characterized by the continuous circulation of small enucleated red cells (Maximow, 1909; Ingram, 1972). The predominant anatomie site of definitive hematopoiesis changes several times during human and murine development. Definitive hematopoiesis occurs in the liver, spleen and bone marrow (BM) in the fetallife of humans (Baudurant & Khoury, 1998; Erslev & Gabuzda, 1995) and mice (Medvinsky, 1996; Cumano, 1996), and in the BM and spleen of adult mice (Keller et
al., 1999; Clapp et al., 1995; McGrath et al., 2003; Ji et al., 2003) and BM of adult humans (Baudurant & Khoury, 1998; Williams et al., 1995). Thymus and lymph nodes have only minor contribution to hematopoiesis, during the fetal stage (Papayannopoulo and Abkowitz, 1995).
'f 'L 1 :~~ / / "
/-~
CFU-GE_ IL·3 M~ GM-cSF 1 GM-GSF Il3 ILJ IL,J/
~
~
~
~
BFV-E GM-GSF GM-GSF1
GM-GSF GM-GSF M-GSF Il-3 IL·J tL·3 Il.J~ Il.3~ CF\J-G CFIJ-M CFU-Eo ll-5J
<"
CFu-E ~...-....
-
~. 1 EPO jGMIlJ .CSF P r o r t - ~-.-
EoeInopnIlIc 1IyeIocy" MywIocy"EPO 1 fh_omoo· 1 (;A.'-CSF i GM·CSF
-
"'
, G-GSf 111.5j
:9
e,yIt1'"."... Thrombcxy1e. PottmOfPhO- Monocyle Eo .. """,,11
nllde.ted 1 GM-GSF ..,.,..,.",M M-CSF
*""""-
--CFU-8 . . "' IL"" III 'L·~~
~..
lIMophilic ~ liai CalI ---"" Il c.l1 ~hyrTIocyt. Il-' Il2 IL·4 IL 2 IL·5 IL J Il-6 Il L ymphobInI T Lymphob/.eet ""''!IO'' Inll~ "'..en OrrVfY' B c.l1 T C.I! Plo..". CeuFigure 1. The hierarchiaJ model of hematopoiesis and its regulation by cytokines. BFU-E
=
burst fornùng unit-erythroid; CFU-Bas=
colony fonning unit-basophil; CFU-E=
colony fonning unit-erythroid; CFU-Eo = colony forming unit-eosinophil; CFU-G =colony forming unit-granulocyte; CFU-GEMM = colony forming unit-granulocyte, erythroid, monocyte, macrophage, megakaryocye; CFU-M = colony fonning unit-monocyte; CFU-Meg =colony fonning unit-megakaryocyte; EPO
=
erythropoietin; G-CSF = granulocyte-colony stimulating factor; GM-CSF = granulocyte-monocyte-macrophage-colony stimulating factor; M-CSF, monocyte-colony stimulating factor; Meg-CSF=
megakaryocyte colony stimulating factor. The name "CFU' reflects the ability of the designated cells to fonn a colony when cultured in a semi-solid medium (Adapted from Bell, 2002).1.1.1 The hematopoietic tissue
1.1.1.1 Bone marrow
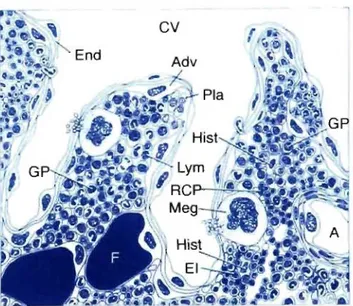
The bone marrow is one of the bodies largest organs, representing 3.4 to 6 percent of total body weight and averaging about 1500 grams in adult humans (Bloom & Fawcett, 1975). It consists of hematopoietic cens (erythroid, myeloid, lymphoid, and megakaryocyte), bone and its cens (osteoblasts, osteoclasts), and stroma and stromal cens (such as adipocytes and fibroblasts) (Bloom & Fawcett, 1975). The hematopoietic marrow is organized around the bone vasculature (Tavassoli & Jossey, 1978; Lichtrnan, 1981). An artery entering the bone branches out toward the periphery to specialized vascular spaces called "sinuses". Several sinuses combine in a collecting sinus, forrning a central vein that retums into the systemic circulation. Hematopoiesis takes place outside of the sinuses in spaces called hematopoietic cords
(Figure
2). Following maturation in the cords, the hematopoietic cells cross the walls of the sinuses and enter the blood (Tavassoli & Shaklai, 1979; Aoki & Tavassoli,r
Figure 2 - Graphie representation of the bone marrow hematopoietie tissue.
The vascular compartment consists of arteriole (A) and central sinus (CV). The venous sinusoids are lined by endothelial ceJls (End), and their wall outside is supported by adventitial-retieulum cells (Adv). Fat tissue (F) is part of the marrow. The compartmentalization of the hematopoiesis is represented by areas of granulopoiesis (GP), areas of eryhropoiesis (RCP), and erythropoietie islands (El) with their nu trient histiocyte (Hist). The megakaryocytes protrude with sm ail cytoplasmie projections through the vascular wall (Meg). Lymphocytes (Lym) are randomly scattered among the hemopoietie cells, whereas plasma cells (Pla) are usually situated along the vascular wall. (Adapted from Ehsan 2002)
1.1.1.2 Spleen
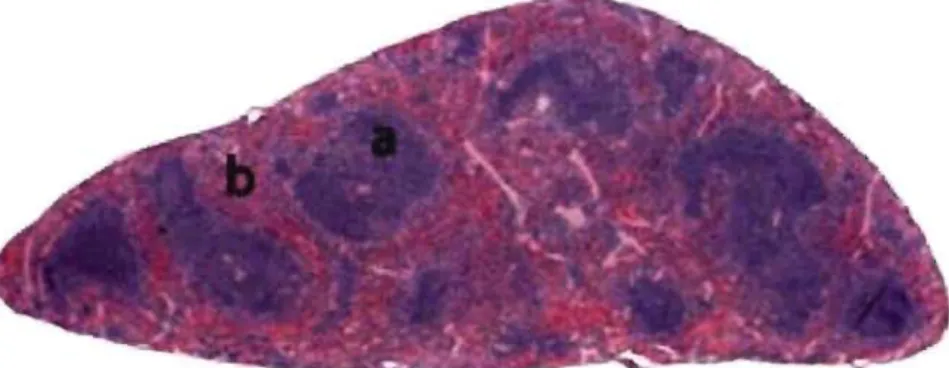
The spleen is a dark red to blue-black organ located in the left cranial abdomen and surrounded by a fibrous capsule. It's an elongated organ, roughly triangular in cross section. Although the size of the spleen varies among species, the ratio of splenic weight to body weight remains fairly constant within the same individual, regardless of age (Losco, 1992).
The functions of the spleen are centered on the systemic circulation. It is comprised of two functionally and morphologically distinct compartments, the red pulp and the white pulp (Figure 3). The red pulp is a blood filter that removes foreign materials and damaged or aged erythrocytes.
"
,
. i.,
..
"-
"t,,.
of"..
•
••
...
~..
,-,
\
• J,
...
..
l'
,..
..
- 1 ';..." -:-:....'-
~,.'
.
.
.
.
..
..-'Figure 3. Histological section of a nonnal spleen. Note the while pulp (a) organized as foUicles, and the red pulp (b) as diffuse formation. (Modified from Suttie, 2006)
It is also a storage site for iron, erythrocytes, and platelets, and plays a role hematopoiesis. The spleen is also the largest secondary lymphoid organ containing about one-fourth of the body's lymphocytes and initiates immune responses to blood-borne antigens (Kuper et al., 2002; Nolte et al., 2002; Balogh et al., 2004). This function is performed by the white pulp which surrounds the central arterioles (Schmidt et al., 1993).
1.1.1.3 Developmental hematopoietic organs
Embryonic blood islands are clusters of primitive erythroblasts sUITounded by an endothelial covering and nestled between the outer visceral endoderm and inner mesothelial cell layers comprising the yolk sac, and involved in embryonic hematopoiesis (Moore, 2004). The thymus is a tlat, bilobed lymphoid organ situated above the heart, surrounded by a capsule and divided in lobules, involved in the maturation of T -cells (Goldsby et al., 2000). Lymph nodes are encapsulated bean-shaped structures containing a reticular network packed with lymphocytes, macrophages and dendritic cells, and constitutes a major site for antigen recognition and antibody production (Goldsby et al., 2000). The liver is a complex organ of man y functions including the production of numerous proteins and detoxification of nocive products. In fetal life it is involved in hematopoiesis for sorne duration, while in the adult this function could be resumed only in severe anemias (Papayannopoulo &
1.1.1.4 Blood
Blood is a viscous substance that circulates in blood vessels. It varies in color depending on how much oxygen it carries. Arterial blood is well oxygenated and therefore, bright red, while venous blood is less well oxygenated and has a much darker color. Blood constitutes approximately 6-8% of total body weight (Hinchliff & Montague, 1988), and is made up of two components: fluid, known as plasma, and cens that float freely in the plasma. Plasma accounts for 55-60% of the blood volume and is 91% water, which helps to dissolve blood proteins. The blood proteins constitute 7% of plasma volume, and the electrolytes 2% (Huether & McCance, 1996). Plasma proteins, such as albumin, globulin and fibrinogen, are the most abundant solutes in the plasma. Most plasma proteins are fonned in the liver and have a variety of functions. The remaining 40-45% of blood consists mainly of red blood cens (Kapit, 1987). The volume of red cens in 100 ml of blood is known as the hematocrit. White blood cells and platelets constitute only a small fraction of the blood.
1.1.2 Stem ceUs of the hematopoietic system
1.1.2.1 Definition and types
Stem ceUs are immature non-differentiated ceUs, characterized by three properties: proliferation, self-renewal, and capacity to differentiate (Hillman & Finch, 1996). There are at least three different types of stem cens that exist in the hematopoeitic tissue: hematopoietic stem ceU (HSC), epithelial stem ceU (ESC), and mesenchymal stem cell (MSC). HSC and ESC are believed to arise from a common precursor stem cell known as hemangioblast (Choi et al., 1998; Keller et al., 2001; Robertson et al., 2000; Sabin, 1920). These ceUs can be distinguished by various morphological and functional characteristics.
Hematopoietic stem cells are pluripotent stem cells that give rise to blood cellular elements (RBCs, WBCs, and platelets) and they can repopulate a recipient host after lethal irradiation. Two major subpopulations of HSCs could be distinguished: long-term repopulating HSCs and short-long-term repopulating HSCs, based on their ability to repopulate irradiated hosts for long-term and short term, respectively (Lanzkron et al.,
1999; Zhao et al., 2000).
The purification of HSCs usually leads to a cell suspension enriched in HSCs. HSCs are usually defined by their ability to regenerate aIl of the hematopoietic lineages in vivo. Purification of ceIl populations capable of such repopulation is usually done on the basis of particular cell surlace markers. Yet, the results obtained suggest that even such populations are not 100% pure HSCs (Osawa et al, 1996; Wagers et al., 2002). Therefore, depending on the particular combination of markers used, subpopulation with various purities of HSCs could be obtained. The majority of human hematopoietic cells capable of producing multlineage hematopoietic engraftment in myeloablated recipients express the CD34 (CD34+) (Zanjani et al., 1997; Larochelle
et al., 1996; Andrews et al., 1992), and human HSCs are usuaIly considered negative for lineage markers (Lin-), CD34+, CD38- (Hogan et al., 2002; Verstegen et al., 1998;
Mazurier et al., 2003). Murine HSCs are usually considered Lin-, cKit+, Scal+ (Spangrude et al., 1998; Osawa et al., 1996), but mouse HSCs also express the CD34 although its regulation is different from humans (Okuno et al, 2002; Morel et al., 1998). However, studies both in mouse and humans indicate that CD34 is a marker of activated and/or cycling stem cells, and that CD34+ stem ceIls can revert to quiescent CD34- state (Sato et al., 1998; Dao et al., 2003; Zanjani et al., 2003). Sorne reports have indicated that the most primitive murine HSCs are CD34-, cKit+, Scal+, and Lin-(Osawa et al., 1996a; Smith et al., 1991; Spangrude et al., 1995; Uchisda et al., 1996;
Matsuzaki et al., 2004), while reports on whether human CD34- CD38- population is more primitive than the CD34+ CD38- population are still controversial (Vetfaillie et
al., 2000; Uchida et al., 2001). A subpopulation of stem cells was identified based on its ability to extrude the Rhodamine 123 or the Hoechst 33341, and called side population (SP), both in mice (Goodell et al., 1996) and humans (Goodell et al.,
1997). A high-purity HSCs is positive for side-population (SP+), CD34+, CD38- in humans (Uchida et al., 2001), while the cells that have the strongest efflux activity C'Tip" SP cells) have the phenotype CD34-, cKit+, Scal+, Lin- in the mouse (Matsuzaki et al., 2004).
• Epithelial stem cells (ESCs)
Aiso called endothelial progenitor cells or angioblasts, these cells can give rise to mature endothelial cells in vessels. (Asahara et al., 1999; Lin et al., 2000; Shi et al., 1998; Kocher et al., 2001).
• Mesenchymal stem cells (MSCs)
Aiso called stromal cells (Phinney et al., 1999; Prockop, 1997; Pittenger et al., 1999), MSCs can differentiate into many cell types including adipocytes, chondrocytes, osteocytes and muscle cells (Prockop, 1997; Pittenger et al., 1999).
1.1.2.2 Hematopoietic Stem cell niche
The control of stem cell properties is affected by the localization of HSCs themselves (Croizat et al., 1970; Gidali & Lajtha, 1972). The niche hypothesis, formulated by Schofield (Schofield, 1978) suggested that true HSCs exist in association with one or more other supporting cells and would therefore, in essence, be fixed tissue cells. These mieroenvironmental cells were postulated to form a specifie niche that, when in close association with the HSC, confer on it the attribute of indefinite self-renewal capacity, while effectively inhibiting differentiation and maturation of the cell. HSCs exhibit selective lodgment in the hypoxie area at the endosteal region (Nilsson et al., 1997 & 2001; Cipolleschi et al., 1993; Lord 1992), as opposed to the proliferating and maturing progenitors which tend to be closer to blood vessels in areas with more oxygen (Cipolleschi et al., 1993; Lord 1992).
1.1.2.3 Hematopoietic stem cell homing
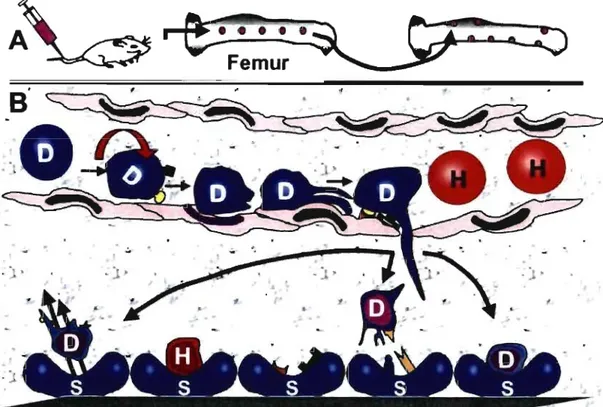
Homing is the process by which stem cells reach the bone marrow after intra-venous injection into recipient hosts (Figure 4). It involves many complex processes such as
cell adhesion, rolling, passage through the bone marrow endothelium (Mazo et al., 1999; Zanjani et al., 1999; Kollet et al., 2001; Peled et al., 2000;Lapidot et al., 2005; Quesenberry et al., 2005) and entering the BM extravascular tissue (Calvi et al., 2003; Avecilla et al., 2004; Sorrentino, 2004; Zhang et al., 2003; Kopp et al., 2005). Following the entry into the BM other processes take place, including interaction with BM stromal cells (Quesenberry & Becker, 1998), endolgement in one of the extravascular bone marrow niches (Calvi et al., 2003; Avecilla et al., 2004) where they interact with the endosteal niche and vascular niche (Calvi et al., 2003; Avecilla
et al., 2004; Zhang et al., 2003; Kopp et al., 2005) and proliferate in the bone marrow
microenvironment. AlI of the different classes of cell adhesion receptors appear to play a role in anchoring hematopoietic cells within the marrow or in promoting hematopoietic differentiation (Carlos & Harlan, 1994; Long, 1992; Lewishon et al., 1990; Yong et al., 1998; Long et al., 1992; Bruno et al., 1995; Quesenberry et al., 1998; Aizawa & Tavassoli, 1987)
1
e:;
. · ..
~
H
~.
'=0
Femur
~
.... ___
)tT-Figure 4. Stem cell homing after intravenous injection. After injection (A), the stem cells leave the vascular space and enter the trabecular marrow compartments from central marrow vessels. Once in this space, there is subsequent localization within the bone marrow according to the phenotype of the cells. Stem cells demonstrate selective redistribution to the endosteaJ region. Taking a closer look at the vascular space within marrow is depicted in (8). The donor (D) and host (H) cells travel through marrow vessels and sinusoids. Adhesion receptors such as VCAM-l, P- and E-selectins and others on the stem cells are responsible for the initial process of endothelial migration. This occurs by the "stickiness" of the cell, by rolling, crowling, and then migrating into the extravascular marrow stromal space. The cells find their respective niche in stromal (S) cells by additional cell receptors. Note the open spaces within the marrow cavity. Stem cells are not static, they leave the marrow stroma and go out into the circulation. Proteopodal (pseudopod-like) extensions may be the mechanism of how the cells home to their respective marrow niche. (Adapted from Quesenberry et al., 200S)
1.1.3 Erythropoiesis
The term erythropoiesis refers to the entire process by which RBCs (erythrocytes) are produced (Dessypris, 1998; Bull et al., 1995). In response to erythropoietin, a growth factor that stimulates the erythroid precursors, erythropoiesis occurs in the central sinus beds of medullary marrow over a period of about 5-7 days through at least 3 successive reduction divisions from proerythroblast to basophilie erythroblast, then to
polychromatophilic erythroblast, and finally to orthochromatophilic erythroblast. With successive developmental stages, the following changes occur (Table 1): reduction in cell volume, condensation of chromatin, decrease in N:C ratio, loss of nucleoli, decrease in ribonucleic acid (RNA) in the cytoplasm, decrease in mitochondria, and graduaI increase in synthesis ofhemoglobin (Dessypris, 1998; Bull
et al., 1995). The nucleus of the orthochromatophilic erythroblast is eventually
extruded, leaving a non-nucleated polychromatophilic erythrocyte (reticulocyte) which is released into the circulating blood to mature in 1 to 2 days. Progressive cellular divisions of one proerythroblast results in the production of 14 to 16 RBCs (Dessypris, 1998). Erythropoiesis takes place in distinct anatomie units called erythropoietic islands (Gulati et al., 1988). Each island consists of a macrophage surrounded by a cluster of maturing erythroblasts. Hemoglobin synthesis occurs as early as the proerythroblastic stage, but most hemoglobin synthesis occurs in the polychromatophilic stage. The average life span of circulating red cells is -120 days in humans (Ehsan, 2002), and -60 days in mice (Singer, 1986)
Table I. Morphological characteristics of erythrocyte precursor subpopulations
~
Proerythroblast* Basophilie Polychromatophilic Orthochromatophilic Reticulocyte MatureErythroblast Erythroblast Erythroblast Erythrocyte
Cell size, ~m 14-19 12-17 12-15 8-12 7-10 7-8
N:C ratio 4:1 4:1 4:1 1:1 nJa nia
N uclear shape Round Round Round Round nJa: nucleus has nJa
been extruded
Nuclear position Central Central Central Central nJa nJa
Dark blue, smaller
Blue-purple, small Nuclear Reddish-blue finely Increased, larger nucleus with nucleus with pyknotic
color/chromatin stippled, granulate granularity of parachromatin, degenerationJcondensed nJa nia
chromatin nuclear chromatin increased clumped
chromatin chromatin
Usually none,
Nucleoli 0-2 ~m occasional None None None None
indistinct nucleolus
Color/amount of Dark or royal Clear gray-blue,
cytoplasm blue/slight Basophilic/slight Bluish-pinklmoderate Pinklmoderate polychromatophilic Pink
to pink Cytoplasmic
, None None None None None None
granules
Morph, morphology of the ceUs; type, the type of erythrOld subpopulauon; nia, not applicable; N :C, nucleus-to-cytoplasm ratio (Bell, 2002)
*Proerythroblast is the ear/iest recognizab/e erythroid precursor by light microscopy. Its can be very large in size (up to 20-2511m in diameter). The nuclear--cytopIasmic ratio is high, the chromatin pattern is immature (high proportion of euchromatin), nuc\eoli are present, and a characteristic pale, small golgi zone abuts the nucleus, The Golgi contains small acid phosphatase-positive granules containing ferritin and the cytoplasm is filled with polyribosomes, which results in its characteristic basophilia (intensely blue color) (Lichtman el al.,
.'
1.1.4 The red blood cells (RBCs)
1.1.4.1 General properties of RBCs
The red blood cells (RBCs) or erythrocytes are 6- to 8-J.lm biconcave discs (Harmening, 2002) representing the blood celIs that transport oxygen to the different organs of the body via its major component, hemoglobin (Figure 5) (Bunn, 1994). The RBC membrane contains numerous proteins (Cabantchik, 1999), inc1uding glycophorin, a major transmembrane protein (Mohandas & Evans, 1994). Glycophorin is heavily glycosylated and accounts for most of the membrane sialic acid, which gives the erythrocytes their negative charge as a result of which they repel each other as they move through the circulation. Anomalies in the RBC membrane components can lead to loss of its deformability and pliability (Harmening, 2002). Affected cells are at a marked disadvantage when they pass through the small (3- to 5-J.lm diameter) sinusoidal orifices of the spleen, one of the functions of which is extravascular sequestration and removal of aged, damaged or less deformable RBCs or fragment of their membranes. (Telen & Kaufman, 1999). The normal RBC membrane is freely permeable to water and anions and relatively impermeable to cations. It is primarily through the control of the sodium and potassium intracellular concentrations that the RBC maintains its volume and water homeostasis (Harmening, 2002).
Figure 5. Normal red blood
cells (RBCs) on peripheral blood smear. Note the roughly round appearance and a central pallor due to the biconcave shape of RBCs (Adapted from Schrier, 1997)
1.1.4.2 RBC senescence
RBC senescence represents the process of RBC aging during its life in the circulation (Harmening, 2002). Each day -1 % of the old RBCs in the circulation are taken out by a system of fixed macrophages in the body known as the reticuloendothelial system (RES). These RBCs are replaced by the daily release of -1 % of the younger RBCs reticulocytes from the bone marrow storage pool. As erythrocytes become older, certain glycolytic enzymes decrease in activity, resulting in a decrease in the production of energy and loss of defonnability. At a certain critical point, the RBCs are no longer able to traverse the microvasculature and are phagocytized by the RES cells. Although RES cells are located in various organs and throughout the body, those of the spleen are the most sensitive detectors of RBC abnonnalities (Cotran et al., 1994). Various metabolic and physical changes associated with the aging of RBCs are listed in Table Il
Table Il. Changes occurring during aging of red blood cells Increases Membrane-bound IgG Density Spheroidal shape MCRC Internai viscosity Agglutinability Na+ Methemoglobin Oxygen affinity Decreases
Several enzyme activity Sialic acid Deformability MCV Phospholipid Cholesterol K+ Protoporphyrin
Abbreviations: MCHC = mean cell hemoglobin concentration; MCV = mean cell volume; Na+, sodium cation; K+, potassium cation (Garratty, 1981)
Ninety percent of the destruction of senescent RBCs occurs by the process of extravascular hemolysis. During this process, old or damaged RBCs are phagocytized by the RES ceIIs, digested by their lysosomes, and their hemoglobin components recyc1ed for the major part, in a process involving the liver (Deiss, 1999). Only 5% to 10% of nonnal RBC destruction occurs through intravascular hemolysis. During this process, RBC breakdown occurs within the lumen of blood vessels. The RBC ruptures, releasing hemoglobin directly into the bloodstream. The hemoglobin molecule dissociates into a~ dimers and is picked up by the prote in carrier,
haptoglobin (Deiss, 1999). The haptoglobin-hemoglobin complex pre vents renal excretion of the hemoglobin and carries the dimers to the liver cell for further catabolism
1.1.5 Hemoglobin
The most important protein of red blood cells is hemoglobin, the mole cule involved in the delivery of oxygen from the lungs to the tissues and facilitation of carbon dioxide exchange from the tissues to the lungs (Rodwell, 2000; Garratty, 1981). It constitutes 95% of the RBC dry weight or 33% of the RBC weight by volume (Bunn,
1994). Approximately 65% of the hemoglobin synthesis occurs during the nuc1eated stages of RBC maturation, and 35% occurs during the reticulocyte stage.
Hemoglobin is a conjugated globular protein with a molecular weight of approximately 64.4 Kilodaltons (Kd). Normal hemoglobin is a tetramer of two pairs of unlike globin polypeptide chains, two alpha-like (141 amino-acids) and two beta-like (146 amino acids) (Harmening, 2002) each folded around a heme molecule
(Figure 6). Each heme consists of a protoporphyrin ring plus ferrous iron (Fe2+) (Bunn, 1994). The net synthesis of (1- and ~-type globin polypeptide chains is
normally balanced at 1:1 (Whitney, 1977). Anomalies affecting globin chains lead to disorders of various severities.
----(X,
Figure 6. Schematic representation of normal hemoglobin molecule. Normal hemoglobin is a tetramer of two a-Iike and two ~-like globin chains. The light blue spheres in the center of each globin represents the heme (Adapted from Bank, 2005)
1.1.5.1 Normal globins in human
Human ~-globin is encoded by a structural gene found in a cluster with the other ~
like genes on chromosome 11. The cluster contains five functional genes, €, Gy, Ay, 8,
~, which are arranged in the order of their developmental expression (Bulger et al.,
2000). € is an embryonic globin gene expressed primarily in yolk sac-derived cells
from 3 to 8 weeks of gestation; Gy and Ay are fetal globin genes expressed primarily in fetal liver-derived cells from 6 weeks of gestation to - 3 months after birth; and 8 and ~ are adult globin genes expressed primarily in bone marrow-derived cells starting shortly before birth and persisting throughout adu/t life. The ~ gene is responsible for 97-98% of adult ~-globin, and the
0
gene is responsible for -2-3%(Whitelaw et al., 1990). Upstream of the entire ~-globin complex is the locus control region (LeR), a regulatory element essential for the expression of ail the genes in the complex (Bulger et al., 2000). a-globin genes are found on chromosome 16, including
ç
chain expressed in the embryonic stage and a chain expressed in the fetal and post-natal stages. ~-like chains pair with the a-like globinç
chain in the embryonic life, and with a-chain in fetal and post-natal life, to form the various hemoglobin molecules (Table III) (Harmening, 2002). The change in globin production from embryonic to feta! and from fetal to adult is called hemoglobin switching (Peterson, 2003).Table III. Composition of the various normal human hemoglobin molecules
Stage of Development Globin Chains Hemoglobin
Embryo Ç2E2 Gower 1
a2E2 Gower 2 Ç2Y2 Portland Fetus a2 A Y2 F G F a2 y2 Adult a2P2 A a282 A2 (Harrnening, 2(02)
1.1.5.2 Normal globins in the mouse
Genes for mouse P-globin are encoded in a complex of p-like loci on chromosomes 7 (Hutton, 1969; Popp, 1969). There are four functional genes in the mouse P-globin gene c1uster: bhl (or PhI), an early embryonic globin gene expressed primarily in yolk sac-derived cells from 9.5 to 12.5 days of gestation; y, (or Ey2) a late embryonic globin gene expressed primarily in fetalliver-derived cells from 11.5 to 16.5 days of gestation. Two P-globin genes located toward the 3' end of the P-globin gene complex are normally expressed in adult mice (Jahn & Hatchison, 1980; Edgell et al.,
1981), first at 9.5 days of gestation in yolk sac-derived cells, then in fetal liver-derived cells, then in spleen, and finally in bone marrow-liver-derived cells throughout adult life (Whitelaw et al., 1990). These genes occur in polymorphic forms (Ranney
et al., 1960; Russel & McFarland, 1974) that encode four types of P-globin polypeptides (Popp, 1973; Popp et al., 1973; Gilman, 1976). Mice of the Hbbs haplotype possess two genes that make an identical p-globin subunit, fJ-single. Mice of the Hbbd haplotype produce two distinct globins, fJ-major and fJ-minor, while mice of the HbbP haplotype make p-major and a variant form of p-minor. The fJ-major gene is responsible for -80% of adult P-globin, and fJ-minor is responsible for -20% (Whitney, 1977), while in the Hbbs, both P-globin genes contribute equally (Ranney and Gluecksohn, 1955; Morton, 1962). The organization of the mouse P-globin gene complex is similar to that of humans (Lawn et al., 1978; Fritsch et al., 1979), goats (Haynes et al., 1980), sheep (Kretshmer et al., 1981) and rabbits (Lacy et al., 1979)
also regulated by a locus control region (LCR). Murine a-globins are encoded in a complex of a-like locus on chromosome 11 (Russel & McFarland, 1974) and include
ç
chain in the embryonic life and a-chain in the fetal and adult stages (Trimborn, 1999); they pair in al: 1 ratio with ~-like globins. The hemoglobin switching in mice involves the switch from the production of embryonic globins to fetal-adult globins (Trimborn, 1999).1.1.5.3 Hemoglobin variants
Several hemoglobin variants exist. Most are accompanied by normal phenotype. Sorne, however, result in anomalies including altered affinity to oxygen (HbChesapeake, HbBethesda, Hbkansas, HbSeattle, HbAntille), slight anemia and morphological changes of RBCs (HbC, HbM), or severe anemia (HbS) (Harmening et al., 2002).
1.2. Anemias and hemoglobinopathies
Anemia is defined as the decrease in the amount of hemoglobin per unit of blood volume, below normal range (Bernard et al., 1998, DeRossi & Raghavendra, 2003). Hemoglobinopathies are defined in the broadest sense as conditions in which there are either qualitative or quantitative abnormalities in the synthesis of hemoglobin (Huisman et al., 1998). More than 625 hemoglobin variants have been described (Huisman et al., 1998) and most of them have no clinical significance. Only about one third (200) of the se variants represent hemoglobinopathies with clinically significant hemolytic anemia.
1.2.1 General symptoms of anemias
The symptoms of anemia are related to its severity, the rapidity of its ons et and the overall condition of the organism. A rapid onset of anemia (acute anemia) is accompanied by more severe symptomatology than a progressively established anemia (chronic anemia), for the same degree of anemia, since adaptation to hypoxia
takes place progressively in the latter. On the other hand, the patient age and overall conditions play an important role in the possibilities of adaptation. (Bernard et al.,
1998). The common symtpoms of anemia are listed in Table IV.
Table IV. Clinical symptoms of anemia -Pail or -Weakness -Fatigue -Lethargy or malaise -Exercise dyspnea -Palpitation
-Pica (consumption of substance such as ice, starch or clay) -Syncope (particularly following exercise)
-Dizziness -Headache
-Tinnitus or vertigo -Irritability
-Difficulty sleeping or concentrating -Gastrointestinal symptoms
(Sonakul et al., 1988)
1.2.2 Pathophysiology and classification of anemias
The decrease in the amount of hemoglobin can result from one of two mechanisms: increased loss where compensation by the bone marrow is not enough to correct the situation, and a decreased medullary production. In the first case, there is an increase in the reticulocyte count, accounting for the medullary regeneration, and which appears slightly after the onset of anemia, whereas in the latter, there is a decrease in reticulocyte count preceeding the onset of anemia, and this is the primum movens of the anemia. The first group is usually referred to as regenerative anemias and the second as non-regenerative anemias (Bernard et al., 1998). Anemias could be c1assified according to their etiology into hemolytic, hemorrhagic, deficiencies, and aplastic anemia (Ravel, 1994), as shown in Table V