EFFECTS OF RESIDUAL STRESS AND MATERIAL
GRADIENTS PRODUCED BY INDUCTION HARDENING
ON ROLLING CONTACT FATIGUE
by
Hoa Ngan NGUYEN
THESIS PRESENTED TO ÉCOLE DE TECHNOLOGIE SUPÉRIEURE IN
PARTIAL FULFILLMENT OF THE REQUIREMENTS FOR THE DEGREE
OF DOCTORATE OF PHILOSOPHY
PH.D.
MONTREAL, AUGUST 27TH 2019
ÉCOLE DE TECHNOLOGIE SUPÉRIEURE UNIVERSITÉ DU QUÉBEC
This Creative Commons licence allows readers to download this work and share it with others as long as the author is credited. The content of this work can’t be modified in any way or used commercially.
BOARD OF EXAMINERS
THIS THESIS HAS BEEN EVALUATED BY THE FOLLOWING BOARD OF EXAMINERS
Pr. Philippe Bocher, Thesis Director
Mechanical Engineering Department at École de technologie supérieure
Pr. Annie Lavasseur, President of the Board of Examiners
Construction Engineering Department at École de technologie supérieure
Pr. Victor Songméné, Member of the jury
Mechanical Engineering Department at École de technologie supérieure
Pr. Salah Guenfoud, External Evaluator
Mechanical Engineering Department at University 8 mai 1945, Algeria
THIS THESIS WAS PRENSENTED AND DEFENDED
IN THE PRESENCE OF A BOARD OF EXAMINERS AND PUBLIC JULY 17TH 2019
To love what one does is to be on the path of happiness, to be patient is to maintain love, to be persevering is to nurture confidence, to be open-minded is to approach the truth.
ACKNOWLEDGMENT
First and foremost, I would like to express my sincere gratitude to Professor Philippe Bocher for his supervision of this research; for all his inspiration, guidance, support, and confidence in my capacities with respect to this work. His passion and enthusiasm are contagious, and are inspiring to me, I am truly so honoured and privileged to have had him as supervisor.
I would also like to thank all Optimization of Aerospace Manufacturing Process Laboratory (LOPFA) group members for sharing friendly team moments with me. The same goes for the Mechanical Department laboratory staff for their support all through the many years I worked on this project. Special thanks to Professor Dao Thien My for his moral and material support in this experience, for his perseverance and encouragement.
I would like to thank the entire staff of the ÉTS Dean of Studies office, Mr. André Goyette and his supervisor for their understanding and all their efforts in helping me realize my dream.
Finally, I dedicate this work, in gratitude, to my father, Van Viet Nguyen; my mother, Thi Vang Tran; my daughter, Claudia My Ninh; my loving brother, Hoai Nam Nguyen; my sister, Titana Nguyen, and my nephew, Evan Nguyen for their precious time as I went through the particular experience of completing this work, and for being by my side with ever-ready help, moral support, care, affection and encouragement, all of which gave me the strength and courage to cope with the combined challenges of my academic and social life.
In short, I thank everyone who made it possible for me to complete this work.
Effets des gradients de contrainte résiduelle et de propriétés matériaux produits par durcissement d’induction sur la fatigue de contact
Hoa Ngan NGUYEN
RÉSUMÉ
Cette recherche a permis de mieux comprendre les effets du durcissement par induction sur la fatigue de contact de roulement (FCR) grâce à des simulations numériques par éléments finis. L’analyse par éléments finis a été développée en 3D pour estimer la charge maximale et les positions des sites de nucléation de fissure dans le cas de roulement pur au contact du cylindre. Le contact de roulement avec ou sans contrainte résiduelle de compression superficielle a été étudié et comparé. Le profil de contrainte résiduelle a été choisi pour simuler les effets d'un traitement de durcissement par induction sur un composant en acier AISI 4340 trempé à 48 HRC. Comme ce processus de durcissement génère non seulement un gradient de contrainte résiduelle dans la composante traitée, mais également un gradient de dureté (appelé région sur-revenue), les deux types de gradients ont été introduits dans le présent modèle. Des contraintes résiduelles en compression surfacique ont été générées dans la zone durcie (environ 60 HRC), des valeurs de tension ont été introduites dans la région sur-revenue, où une dureté aussi basse que 38 HRC a été définie. Afin d'estimer les charges maximales admissibles sur les cylindres en contact pour atteindre une durée de vie de 10 cycles, le critère de Dang Van multiaxial et une limite de fatigue en contrainte de cisaillement ont été utilisés respectivement dans les conditions hydrostatiques positive et négative, respectivement. Avec l’approche proposée, il a été montré que la composante durcie par induction avait une charge maximale admissible significativement supérieure à celle obtenue avec une composante non traitée, et il a été observé que le pic de contrainte de tension résiduelle trouvé dans la région sur-revenue limitait le facteur de durée de vie en fatigue. Plusieurs simulations ont été effectuées avec différentes profondeurs durcies et intensités de pic de contrainte résiduelle en tension dans la région sur-revenue afin de prédire leur effet sur la charge maximale admissible. Ceci permet également d’étudier la position des fissures. Il a été constaté qu'avec les hypothèses formulées dans cette étude, la profondeur durcie permettant de maximal la charge appliquée pour une vie de 10 cycles correspondant à une profondeur durcie d'environ 1,2 mm. La charge maximale est alors 375% supérieure à celle d'une pièce non traitée. Les résultats sont présentés en détail et discutés, et une recommandation pour le développement ultérieur du modèle est donnée.
Mots clés : induction, AISI 4340, contrainte résiduelle, dureté, couche durcie, région sur
revenue, roulement, nucléation des fissures, la charge maximale, la pression maximale, cisaillement maximal de contrainte résiduelle, critère de Dang Van, limite de fatigue en cisaillement, cylindres en contact, pure roulement.
Effects of residual stress and material gradients produced by induction hardening on rolling contact fatigue
Hoa Ngan NGUYEN
ABSTRACT
This research was conducted to provide a better understanding of the effects of induction hardening on rolling contact fatigue (RCF), using a finite element analysis. The finite element analysis was developed in 3D to estimate the maximum loading and the positions of crack nucleation sites for cylinder rolling contact. Rolling contact, with or without surface compressive residual stress, was studied and compared. The residual stress profile was chosen to simulate the effects of an induction hardening treatment on a 48 HRC tempered AISI 4340 steel component. As this hardening process does not only generate a residual stress gradient in the treated component, but also a hardness gradient (called the over-tempered region), both types of gradients were introduced in the model. Residual stresses in compression were generated in the hard case (about 60 HRC), tensile values were introduced in the over-tempered region, where harnesses as low as 38 HRC were set. In order to estimate the maximum allowable loads in the rotating cylinders to target a life of 10 cycles, a multiaxial Dang Van criterion and a shear stress fatigue limit were used, under positive and negative hydrostatic conditions respectively. With the proposed approach, the induction-hardened component was found to have a significantly higher maximum allowable load than that obtained with a non-treated component and it was observed that the residual tensile stress peak in the over-tempered region could become a limiting factor for rolling contact fatigue life. Several simulations were run with various case depths and tensile residual stress peak intensities in the over-tempered region. The goal was to document their load performance in terms of maximum 10 cycles and the related locations at which cracks would appear. It was found that with the hypotheses set in this study, the case depth at which the rolling contact fatigue behaviour was maximized is around 1.2 mm and the maximum load is 375% higher than with a non-treated part. The results are presented in detail and discussed, and recommendations for further development of the model are made.
Key words: Induction hardening, AISI 4340, residual stress, hardness, case depth,
over-tempering region, nucleation crack, maximal loading, maximal pressure, maximal residual shear stress, Dang Van criteria, torsional fatigue limit, cylinders in contact, pure rolling.
TABLE OF CONTENTS
Page
INTRODUCTION ... 1
CHAPTER 1 REVIEW LITTERATURE ... 3
1.1 Introduction ... 3
1.2 Induction hardening ... 3
1.2.1 Induction hardening hardness profile ... 4
1.2.2 Residual stress resulting from induction hardening ... 5
1.3 Rolling contact fatigue ... 9
1.3.1 Surface/subsurface crack initiation mechanics ... 11
1.3.2 Pure rolling contact effect on nucleation crack region ... 13
1.3.3 Surface motion analysis ... 14
1.3.4 Rolling contact cylinders modeling ... 16
1.3.5 Effects of sliding on rolling contact fatigue ... 17
1.4 Prediction of rolling contact fatigue ... 20
1.4.1 Multiaxial fatigue criteria ... 22
1.4.2 Dang Van criterion ... 23
1.5 Research objectives and outline ... 24
CHAPTER 2 METHODOLOGY ... 27
2.1 Introduction ... 27
2.2 Material and Hardness ... 27
2.3 Finite element modelling ... 29
2.3.1 FEA model validation by static contact stress in 3D description ... 29
2.3.2 Maximum contact pressure in 3D ... 30
2.3.3 Maximal shear stress in 2D ... 33
2.3.4 Geometry and rolling contact properties ... 35
2.3.5 Residual stresses modeling ... 38
2.3.6 Case depth of 0.8mm with a tensile hydrostatic stress peaks of 200 MPa ... 38
2.3.7 Residual stress simulations for case depth of 0.5, 0.8, 1.0, 1.2 and 1.8 mm and tensile hydrostatic stress peaks of 100, 200, 250 MPa ... 42
2.4 Multiaxial fatigue criteria ... 43
2.5 Loading path distance to Dang Van limit and torsional shear limit ... 44
CHAPTER 3 EFFECT OF INDUCTION HARDENING ON MAXIMUM ALLOWABLE LOADING ... 47
3.1 Introduction ... 47
3.2.1 Location of potential nucleation crack point for homogenous 48
HRC part (reference part) ...48
3.2.2 Effect of the hardness in homogenous parts ...50
3.2.3 Effect of residual stress in homogenous parts ...52
3.2.4 Multilayer and residual stress gradient ...55
3.3 Residual stress effect on the multiaxial failure criteria and nucleation crack plane ...57
3.4 Conclusions ...62
CHAPTER 4 EFFECT OF CASE DEPTH AND TENSILE HYDROSTATIC RESIDUAL STRESS ON ROLLING CONTACT FATIGUE .63 4.1 Introduction ...63
4.2 Residual stress and case depth thickness variations ...63
4.3 Maximal residual shear stress in axial-radial plane XY (maximal shear stress due to rolling load plane) ...65
4.4 Maximal loading and nucleation crack locations ...66
4.4.1 Nucleation crack positions as a function of maximal residual shear stress ...69
4.4.1.1 Nucleation cracks at case depth ...69
4.4.1.2 Nucleation cracks at over-tempering region ...71
4.4.2 Nucleation cracks as a function of case depth and 𝜎 _ peaks .74 4.4.3 Nucleation crack location as a function of 𝜏 at nucleation point ...75
4.4.4 Nucleation crack position as a function of tensile residual hydrostatic stress𝜎 _ at nucleation point ...77
4.4.5 Maximal pressure as a function of case depth and tensile hydrostatic RS peaks ...78
4.4.6 Maximal load as a function of tensile residual hydrostatic stress peaks...81
4.5 Comparison of induction hardening optimum case and through hardening (60 HRC) ...81
4.6 Conclusion ...83
CONCLUSIONS ...85
RECOMMENDATIONS ...89
CONVERGENCE STUDY ...91
NUCLEATION CRACK REGION IN CASE OF 38 HRC, 48 HRC, 60 HRC AND 3 LAYERS ...95
RESIDUAL STRESS DUE TO INDUCTION HARDENING IN VARIATION OF CASE DEPTH THICKNESSES AND TENSILE HYDROSTATIC RS PEAKS ...99
MAXIMUM COMPRESSIVE RESIDUAL STRESS ... 105
MAXIMUM CONTACT PRESSURE ... 107
NUCLEATION CRACK DEPTH ... 109
MAXIMAL LOADING ... 111
FLAMANT’S SOLUTION ... 113
LIST OF TABLES
Page Table 2-1 Hardness, thickness, and material fatigue parameters of different
material conditions present in induction hardened parts from Savaria
(2013) and Savaria et al. (2016) ...29 Table 3-1 Maximum loadings in homogenous parts of 48 HRC ...48 Table 3-2 Maximum loadings in homogenous parts of 38 HRC, 48 HRC and
60 HRC without RS ...51 Table 3-3 Simulation results for homogeneous hardness and residual stress ...53 Table 3-4 Simulation results for multilayer material with induction hardening
case ...56 Table 4-1 Hydrostatic compressive residual stress variation by tensile residual
hydrostatic stress 𝜎 _ peaks (MPa) and case depth thickness (mm) ...64 Table 4-2 Results: Summary of all simulations for residual stress variation by
𝜎 _ peaks (MPa) and case depth thicknesses (mm) ...68 Table 4-3 Limit of nucleation points at case depth ...71 Table 4-4 Limit of nucleation points in the over-tempering region ...72 Table 4-5 Maximal loading in induction hardening optimum case and
LIST OF FIGURES
Page Figure 1-1 Typical hardness profile of AISI 4340 treated by induction
hardening, (Savaria, 2013) ...4 Figure 1-2 Residual stress profile after induction hardening, (Grum, 2007);
Residual stress profile following depth direction z ...5 Figure 1-3 Residual stresses due to induction hardening, (Grum et al., 2007): σz
is the axial stress, σr is the radial stress, and σT is tangential stress ...6
Figure 1-4 Axial residual stress measurement of some heat induction hardening recipes in an AISI 4340 cylinder: Recipe A with case depth of 0.48 mm; Recipe B with case depth of 0.74 mm; Recipe C with case
depth of 0.88 mm, (Savaria, 2013) ...7 Figure 1-5 Residual stresses observed in low carbon induction hardened steel
(Yonetani and Isoda, 1989): a) before stressing; b) stressing below
the endurance limit ...8 Figure 1-6 Three pitting types of rolling contact fatigue on gear: a)Initial pitting
along the pitch line and just above the pitch line of helical gear teeth, (Alban, 1985); b)Destructive pitting, (Guichelaar et al., 1974);
c)Spalling pitting, (Guichelaar et al., 1974) ...10 Figure 1-7 Surface/Subsurface pitting type, (Guichelaar et al., 1974): a) Surface
origin pitting; b) Subsurface origin pitting ...12 Figure 1-8 Origin crack on surface and at subsurface, (Norton, 2006) ...12 Figure 1-9 Subsurface of bearing contact fatigue of roller contact, (Crehu,
2015): a) Bearing cracks at surface; b)spalling at bearing surface; c)
Spall bottom parallel to surface. OD: Over-rolling direction ...13 Figure 1-10 Base circle and involute line of gear ...14 Figure 1-11 Abrasive areas in the vicinity of pitch line at tooth flank in motion:
a) wear at pitch line; b) rolling and sliding combination along
contact line, (Alban, 1986) ...15 Figure 1-12 Normal pressure at contact region: a) Model transformation of
meshing gears to the equivalent model of two cylinders for the contact point, b) the normal pressure at contact point presented as
Figure 1-13 Maximal shear stress distribution in contacting surface due to pure
rolling, pure sliding and combined rolling and sliding, (Alban, 1985) ...17 Figure 1-14 Maximum shear stress by Tresca variation in depth as a function of
friction coefficient, (Broszeit, 1977) ...18 Figure 1-15 Spalling-a subsurface fatigue failure originating at case/core
interface, at transition of carburized case of gear tooth, (Alban,
1985) ...19 Figure 1-16 An internal rupture in a gear tooth at the case-core transition zone
which does not reach the surface, (Alban, 1985) ...19 Figure 1-17 Fatigue limit domain and typical loading path, (Dang Van, 1999) ...24 Figure 2-1 Hardness profile of induction treatment from the surface to the core ...28 Figure 2-2 Elliptical contact area for a non-confirming contact; for each contact
wheel, there are two radii in the axial and tangential directions; pmax
is the maximum contact pressure, a and b are the half-width of the
elliptical contact, (Antoine et al., 2006) ...30 Figure 2-3 Stresses generated due to transmission load W, (Jonhson, 2004) ...33 Figure 2-4 Maximal shear stress as a function of maximal pressure evaluated at
the center line below the contact centre, a is semi length contact ...35 Figure 2-5 Schematic representation of the mesh at contact zone: a) global view
of flat cylinder A and elliptic cylinder B; b) fine meshing in the spaces of elliptic center and flat cylinders in contact; c) zoom of
contact zone showing the fine mesh of 0.08 mm of YZ plane ...37 Figure 2-6 Residual stress distributions introduced in straight cylinder A
according to the 3 directions (in MPa): a) hoop stress; b) axial stress; c) radial stress; d) the correlation between the FEA simulation and
an experiment measurement of axial residual stress ...40 Figure 2-7 Typical profile by FEA: residual stresses in axial, hoop, and radial
directions ...41 Figure 2-8 Hydrostatic residual stress in depth (MPa) and tensile residual stress
peak of 200 MPa at depth of 1.0945 mm, by FEA results ...42 Figure 2-9 Hydrostatic stress at 200 MPa as a function of case depth, by FEA
Figure 3-1 Critical Dang Van distance and maximum shear stress under maximum loading conditions corresponding to a maximum loading of 580 N on a 48 HRC part: a) Distance to the Dang Van criterion along the A-A-axis below the contact point; b) 2D map with contour lines representing the distance to Dang Van criterion below the surface contact; c) Shear stress along the axis, along the A-A-axis below the contact point; d) 2D contours for shear stress on the plane
orthogonal to the contact surface at which 𝜏 = 𝜏 ...49 Figure 3-2 Zoom out of maximum shear stress of 529 MPa ...50 Figure 3-3 Evolution of stresses in the Dang Van diagram when applying
critical loading conditions on homogeneous 38, 48, and 60 HRC cylinders (without residual stress), corresponding to maximum of
420 N, 580 N, and 1320 N, respectively ...52 Figure 3-4 Evolution of stresses in the Dang Van diagram when applying
critical loading conditions on homogeneous 38, 48, and 60 HRC cylinders with the residual stress gradient typical of induction hardening, corresponding to maximum loadings of 840 N, 1130 N,
and 2345 N, respectively ...54 Figure 3-5 Evolution of stresses in the Dang Van diagram when applying the
critical loading condition on a multilayer cylinder with the residual stress gradient typical of induction hardening, corresponding to
maximum loadings of 1420 N ...56 Figure 3-6 Under a load of 1420 N, the zoom views the case where the
evolution line reaches the elastic shakedown and the Dang Van limit ...57 Figure 3-7 Effect of residual stress on nucleation crack point at a maximal shear
stress 580 N ...58 Figure 3-8 Zoom out of maximal shear stress on XY plane profile in case depth
region equivalent ...59 Figure 3-9 Maximal shear stress on axial radial XY plane profile in the
over-tempering region equivalent ...60 Figure 3-10 Maximal shear stress on axial radial XY plane, in multilayer without
load (blue line), and under a 1420 N loading case (red line);
compared with homogenous case under a maximal loading of 580 N
Figure 4-1 Variation of hydrostatic residual stress in case depth of 1.2 mm with 100 MPa, 200 MPa and 250 MPa of tensile hydrostatic residual
stress peaks ...64 Figure 4-2 Compressive hydrostatic residual stresses 𝜎 _ peaks as a function
of case depth thickness for each tensile hydrostatic residual stress
𝜎 _ peaks (100, 200 and 250 MPa) ...65 Figure 4-3 Function of nucleation crack position as a functions of case depth
thickness (mm). B- Torsional fatigue limit criterion; A- Dang Van limit; filled marker: nucleation crack in over-tempering region; blank marker: nucleation crack in case depth; blue: 100 MPa of 𝜎 _ peaks; green: 200 MPa of 𝜎 _ peaks; red: 250 MPa of 𝜎 _
peaks ...75 Figure 4-4 Nucleation cracks position in depth vs. maximal residual shear stress
at nucleation point 𝜏 _ . B- Torsional fatigue limit criterion; A- Dang Van limit; filled marker: nucleation crack in over-tempering region; blank marker: nucleation crack in case depth; blue: 100 MPa of 𝜎 _ peaks; green: 200 MPa of 𝜎 _ peaks; red: 250 MPa of
𝜎 _ peaks ...76 Figure 4-5 Nucleation crack position as a function of hydrostatic residual stress
at nucleation point. B- Torsional fatigue limit criterion; A- Dang Van limit; filled marker: nucleation crack in over-tempering region; blank marker: nucleation crack in case depth; blue: 100 MPa of 𝜎 _ peaks; green: 200 MPa of 𝜎 _ peaks; red: 250 MPa of 𝜎 _
peaks) ...78 Figure 4-6 Maximum pressure (GPa) as a function of hydrostatic residual stress
at nucleation point. B- Torsional fatigue limit criterion; A- Dang Van limit; filled marker: nucleation crack in over-tempering region; blank marker: nucleation crack in case depth; blue: 100 MPa of 𝜎 _ peaks; green: 200 MPa of 𝜎 _ peaks; red: 250 MPa of 𝜎 _
peaks) ...79 Figure 4-7 Maximum loads (N) as a function of case depths and tensile
hydrostatic stress peaks (MPa). B- Torsional fatigue limit criterion; A- Dang Van limit; filled marker: nucleation crack in
over-tempering region; blank marker: nucleation crack in case depth; blue: 100 MPa of 𝜎 _ peaks; green: 200 MPa of 𝜎 _ peaks; red:
250 MPa of 𝜎 _ peaks) ...80 Figure 4-8 Maximum loads (N) as a function of case depths and tensile residual
Figure 4-9 Evolution of stresses when applying the critical loading condition on a multilayer cylinder with the residual stress gradient typical of induction hardening, corresponding to maximum loadings of 2170 N
LIST OF ABREVIATIONS
AISI: American Iron and Steel Institute CD: Case-depth
CDT: Case-depth thickness
ÉTS: École de technologie supérieure HRC : Hardness Rockwell C
HV: Hardness Vickers
LOPFA: Optimization of Aerospace Manufacturing Process Laboratory OT: Overtempering
RCF: Rolling Contact Fatigue RS: Residual Stress
XY: Radial-axial plane perpendicular to surface contact and rolling direction FEA: Finite Element Analysis
LIST OF SYMBOLS
σ _ Tensile hydrostatic residual stress σ _ Compressive hydrostatic residual stress
_ Maximal residual shear stress on the plane of XY _ _ Maximal residual shear stress in compression limit _ _ Maximal residual shear stress in tension limit _ _ Maximal residual stress of case depth in
plane XY (plane of maximal shear stress due to rolling loading) _ _ Maximal residual stress of over-tempering region in plane XY (plane of
maximal shear stress due to rolling loading)
F Maximal loading
HRC Hardness Rockwell scale, C α Fatigue material constant β Fatigue material constant
Elastic limit (by simple torsion) (MPa) , Torsional fatigue limit (MPa)
po Maximum pressure (GPa) p Maximal contact pressure limit po/τe Shakedown ratio value
E Young’s modulus (MPa)
µ Poisson’s coefficient
𝜏 Maximum allowable shear stress 𝜎 Hydrostatic stress
d, Damage degree at position i and at angular position θ d Maximum degree of damage value
l, Distance from each point i at rotation angle θ during a revolution to the Dang Van limit
l Minimum distance of a revolution to Dang Van limit Ac3 Finish temperatures of austenite formation
INTRODUCTION
In the automotive and aerospace sectors, gears are generally of high quality and must be high performing and provide long service life. Accordingly, once damage is observed on a gear, the latter must be replaced. It is therefore essential to predict the maximum allowable load of these gears for a given fatigue requirement. In a gear, the contact surfaces that support rolling loads can be degraded in different ways, with crack initiation being the most frequent. This degradation may result in surface spalling, and damage may occur as a result of contact fatigue between the teeth of the gear and pinion. After a certain number of rolling cycles, cracks appear on the flank surface.
To ensure long gear life, it is important to apply surface treatments on them, to improve their mechanical and fatigue properties at the contact surface. To this end, two methods can be used, namely, chemical methods (nitriding and carburation) and thermal methods, such as induction or flame. For this research, induction hardening was the chosen technique. This process uses in aeronautic field to treatment gear. The induction hardening generates a multilayer material, very hard at surface to resist the wear and contact fatigue, soft in transition layer from the surface to core to absorb the shock. The prediction of the maximum allowable loading of an induction hardening-treated gear raises the problem of modeling and analyzing the influence of residual stresses on the gear’s contact fatigue resistance. With contact crack initiation being very frequent, it is also necessary to estimate the maximum allowable loading, where the first nucleation crack will be seen in the part.
The main objective of this study is to analyze the influence of induction residual stresses and material gradient on gear performance; in order to improve contact fatigue life, and predict the maximum allowable load and the nucleation crack region in the part. Currently, in induction processing, there is no procedure for predicting the influence of residual stresses on contact fatigue or their effect on the maximum allowable load. In our case, we developed a new contact fatigue analysis procedure for typical induction-treated gears. This new methodology helps predict the maximum allowable loading of the pure rolling contact which could be present at
the pitch line on the gear flank contact. This will be the first item to be validated by the model, in order to determine the optimal induction hardening recipe for use in the aeronautical safety domain.
The study begins by examining the correlation between experimental residual stress measurements and residual stress simulation. The correlation is then followed by an analysis of the effect of residual stress on the maximum allowable load for two cases: non-treated induction and treatment by induction hardening. Lastly, an analysis of the effect of residual stress and the case depth thickness is made, in order to determine pressure limits and nucleation crack conditions.
This research project is divided into two parts:
- A study of the effect of residual stress on maximum loading, for a 0.8 mm case depth and 200 MPa maximum tensile hydrostatic residual stress σ _ peak;
- A study of the effect of case depth thicknesses (0.5; 0.8; 1.0; 1.2; 1.8 mm) and residual stresses (150, 200 and 250 MPa under maximum tensile hydrostatic residual stress σ _ peaks) on maximal loading, with the aim of defining the pressure p and maximal residual shear stress limits for a general case.
This research project studies on the prediction of maximal load as well as the nucleation crack position of induction surface materials followed by quenching and will thus help to optimize the design of heat treatment process validating tests for parts used under rolling contact fatigue conditions. The finite element analysis of the induction residual stress effect under pure rolling contact will help in predicting the maximal load and residual stress limit. It is crucial to simulate the optimization of the residual stress profile resulting from induction hardening, in order to predict and validate contact fatigue tests through an experimental test plane.
CHAPTER 1
REVIEW LITTERATURE
1.1 Introduction
This chapter presents a scientific literature review on residual stress and hardness due to induction hardening. Then, a general analysis of typical gear movements under rolling contact are described; the necessity of the pure rolling study on rolling contact fatigue and especially for the case of heat treatment by induction hardening is highlighted. This section presents an overview of rolling contact fatigue, subsurface and surface crack nucleation mechanisms, and the effect of pure rolling/sliding on rolling contact fatigue. This section mentions the method chosen for predicting RCF by multiaxial fatigue criteria. Finally, a research objective and outline was proposed.
1.2 Induction hardening
Induction hardening is a very successful method of utilizing the hardenability of a medium carbon steel to produce core strength, as well as to produce a fairly hard case that can withstand wear and maintain contact resistance. The procedure involves uniformly heating, quenching and tempering a forged gear blank to a machinable hardness of 30-38 HRC (finish-machine and cut the teeth), and induction hardening of the tooth surface to 50 HRC-65 HRC.
The induction heat treatment by quenching, which aims to improve hardness and wear resistance properties on the surface of the part, is also a green procedure (i.e. environment friendly). Induction heating systems do not burn traditional fossil fuels; induction is a clean, non-polluting process that will help protect the environment. An induction system improves working conditions for your employees by eliminating smoke, waste heat, noxious emissions and loud noise. Heating is safe and efficient with no open flame to endanger the operator or obscure the process. With this technology, an axisymmetric ferromagnetic piece is placed in a
coil, called an inductor. A frequency current is applied in the inductor to create a magnetic field around the part. The currents induced inside the treated piece produce a concentrated Joule heating on the surface layers (Savaria, 2013). After a very short period (about one second), the piece is cooled by immersion in a polymer liquid or by a shower liquid bath. Since the surface steel has been heated above the transformation temperature, Ac3, quenching at this point results in the formation of a fresh martensitic layer on the surface. This extends to a depth of up to several millimeters. A multitude of parameters in the process (power, current frequency, heating time, type of quenching, form of inductor, etc.) can be varied, thus producing different hardness and residual stress profiles.
1.2.1 Induction hardening hardness profile
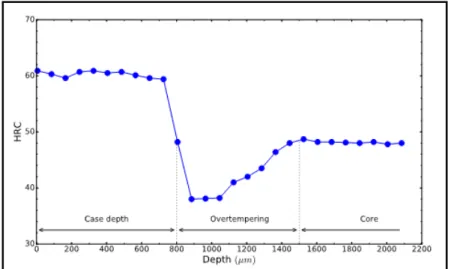
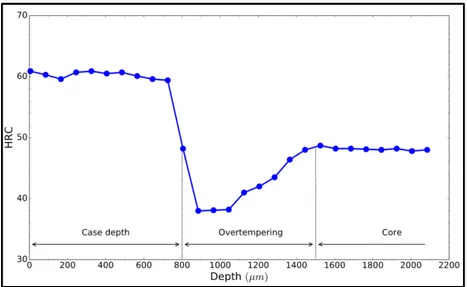
A typical micro-hardness profile of a cylinder is also shown in Figure 1-1. A detailed, microscopic optical analysis of a layer of AISI 4340 steel treated by induction generally identifies three areas: a hardened zone (case depth), an over-tempering zone of low hardness and the core of the piece that is unaffected by surface treatment (Savaria, 2013).
Figure 1-1 Typical hardness profile of AISI 4340 treated by induction hardening, (Savaria, 2013)
1.2.2 Residual stress resulting from induction hardening
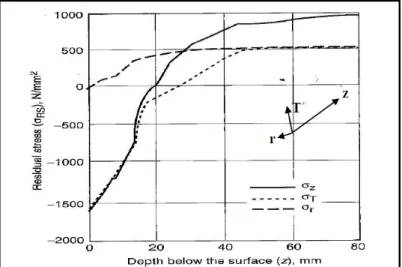
Residual stresses due to induction hardening originate from two sources: the strong thermal gradient during heating, and the cooling creating thermal stresses and a phase change located on the surface, which causes an increase in volume (Savaria, 2013; Durban, 1997; Rudnev et al., 2003; Markegard and Kristoffersen, 2007; Grum, 2007). Thermal stresses tend to plastically deform the surface of the piece during treatment. These permanent deformations, combined with local increases in volume, create an incompatibility with the core of the piece which remains cold during induction. For the surface to remain physically bound to the core of the part, a field of compressive residual stress in depth and tensile residual stress in core is generated to respect the geometric compatibility principle. The residual stress profile shown in Figure 1-2 is conventionally observed after induction in the long gear tooth, in the tangential and axial directions.
Figure 1-2 Residual stress profile after induction hardening, (Grum, 2007); Residual stress profile following depth
A typical residual stress profile in Figure 1-2a is characterized by the maximum tension below the surface, the distance from the compression transition to the tension, the slope between the minimum and maximum residual stress (the gradient) and the maximum residual compression near the surface. The level of surface compression generally drops as the hardened depth increases (Savaria, 2013; Denis, 1997; Tjernbeg, 2002).
Grum et al. (2007) carried out three residual stress measurements (axial z, tangential T and radial r) on the gear by applying the induction process. They showed that once rapid quenching is complete, the tangential and axial compressive residual stresses at the surface reach about -1600 MPa and the axial tensile residual stress at the core reaches about 1000 MPa. Figure 1-3 shows the distribution of the individual residual stress components, where σz is the axial stress,
σT is the tangential stress, and σr is the radial stress. The axial and tangential surface
compression stresses rise to -1600 MPa. The axial and tangential compressive stresses at the surface are of the same amplitude at the surface. Both stresses show decreasing amplitude with an increased depth. At 20 mm, these stresses stop being compressive and become tensile, and reach maximum amplitudes of 500 MPa (σT) and 1000 MPa (σz). The radial stress is zero at
the surface, but increases gradually with depth, reaching a maximum of 500 MPa.
Figure 1-3 Residual stresses due to induction hardening, (Grum et al., 2007): σz is the axial stress, σr is the radial
Savaria (2013) studied residual stresses and their impacts on the initiation of bending fatigue cracks in aeronautical hardening by induction in AISI 4340 steel. The author measured the axial residual stress of an AISI 4340 steel cylinder with the following characteristics: 48 mm diameter with peaks in tensile residual stress (RS) of 300 to 400 MPa, a compressive RS of -500 to -600 MPa, and a case depth of 0.48 to 0.88 mm, (see Figure 1-4).
Figure 1-4 Axial residual stress measurement of some heat induction hardening recipes in an AISI 4340 cylinder: Recipe A with case depth of 0.48 mm; Recipe B with case depth of 0.74 mm; Recipe C with case
depth of 0.88 mm, (Savaria, 2013)
Recipe A has significant compressive residual stresses, a relatively low gradient in the tensile transition zone. The change in stress sign is very close to the measured case depth. As for recipe B, the case depth stresses are completely compressive. C is the recipe with the lowest compression and tension in general. These recipes showed that the thicker the case depth, the more the compressive residual stress decreases.
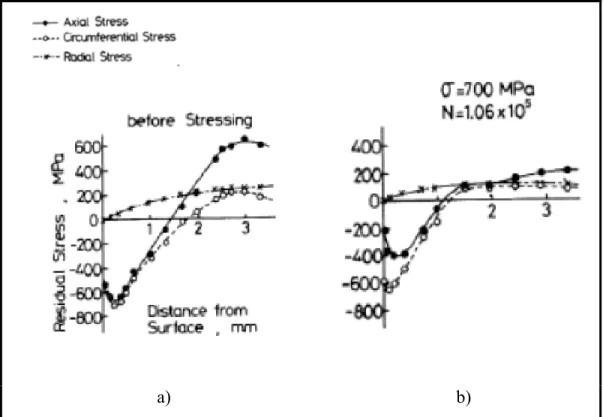
In the RS measurements done by previous authors, the measured tensile axial residual stress reaches a maximum ranging from 400 MPa to 1000 MPa, just after induction hardening. And in the Yonetani and Isoda (1989) study on the induction hardening of steel, the axial tensile residual stress reached 600 MPa after induction. In the relaxation, a before load tensile hydrostatic residual stress of 330 MPa is reached. After a hundred thousand cycles the tensile hydrostatic stress is relaxed and stable at 250 MPa, (see Figure 1-5). Thus, the varying of tensile hydrostatic stress in this study will be limited in range of 100 to 250 MPa because the 300 MPa of tensile hydrostatic stress is also the damage limit of AISI 4340, as estimated by testing fatigue properties in LOFFA laboratory.
a) b)
Figure 1-5 Residual stresses observed in low carbon induction hardened steel (Yonetani and Isoda, 1989): a) before stressing; b) stressing below the
1.3 Rolling contact fatigue
The fatigue failure of the gear systems can be of different types: bending fatigue; sliding contact fatigue; rolling contact fatigue; thermal fatigue; fatigue of the other components of the transmission system (shaft, bearing, gear). An analysis of 1500 gear failures showed that bending fatigue is the most common, at 32% (Alban, 1986). However, under certain conditions, contact fatigue may become more important than bending fatigue. Contact fatigue can manifest itself in different forms depending on the applied loads and: surface pitting; spalling; and cracking, in increasing order, (Fernandes et al., 1997).
Rolling contact fatigue (RCF) can take place even after a number of cycles greater than what is usually considered as the endurance limit, that is, at above 10 cycles with bearing. However, with some typical gears, rollers, RCF reach with a range of 10 to 10 cycles (Glaeser et al., 1996), as the nucleation mechanisms in this range are similar (crack nucleation from hard particles or inclusions). RCF is characterized by two types of crack nucleation: surface and subsurface. Micro-pitting can be generated on the contact surface, while subsurface cracking may form and propagate, remaining invisible from the surface until large surface defects are generated (Tallian, 1982; Halme and Andersson, 2009; Sadeghi et al., 2009). Rolling contact fatigue is a type of failure at the surface and subsurface region. It is commonly found in ball or rolling bearings or metal alloys, (see Figure 1-6). It is caused by varying contact pressures on the surface of rotating contacting parts. Elastic deformations resulting from contact loading are multiaxial, and the maximum value (elastic deformation) is found at a certain distance below the surface. The fluctuating stress varies according to the loading mode and lubrication conditions, affecting the fatigue performance of the power transmission. The rolling contact stress is concentrated in a small volume of material and produces intense stress. Thus, cracks are generally initiated and concentrated in this subsurface region, where shearing is maximum, (Cavallaro, 1995). The propagation of cracks due to contact causes losses of material, in a process called "pitting" (see Figure 1-6a). The pitting is initiated in a defect: either an inclusion or a microcrack. Pitting progresses throughout the operation of the gear and forms cracks that can join and release much larger pieces of material to the surface; it is a
phenomenon called "spalling", (see Figure 1-6b). The cavities thus formed generate a large concentration of stress which favours cracking through the tooth, due to the bending load, (see Figure 1-6c).
Figure 1-6a, shows a typical example of initial pitting. Pitting has started in the dedendum section of a wide face width gear. The relative directions of surface sliding and movement of the contact load in the gear teeth affects the surface crack direction and propagation, (Alban, 1985).
Figure 1-6 Three pitting types of rolling contact fatigue on gear: a)Initial pitting along the pitch line and just above the pitch line of helical gear teeth, (Alban,
1985); b)Destructive pitting, (Guichelaar et al., 1974); c)Spalling pitting, (Guichelaar et al., 1974)
Figure 1-6b shows destructive pitting in a gear from 1045 material heat treated to 38 HRC. The dedendum section is first to experience damage. However, as the pitting continues, the area along the pitch line usually pits away and then addendum pitting becomes prevalent (the gear from 1045 material heat treated to 38 HRC), (Guichelaar et al., 1974). Figure 1-6c shows case crushing of hardened gear which is a type of surface contact fatigue associated with cracks that originate in the core material. Cracks often propagate along the case to core boundary and then move perpendicularly to the surface. When several cracks reach the surface as shown, large elongated chunks of material are removed. Often failure may occur on one or two teeth in a pinion or gear with the remainder of the teeth undamaged, (Guichelaar et al., 1974).
In gear tooth failure, the initial pitting type is in the range of 0.4-0.8 mm in depth (Alban, 1985). It occurs in overstressed areas and can be reduced by improving the surface quality to obtain more evenly distributed polishing. Sometimes spalling occurs when the pits originate in a case-hardened pinion at or near the transition line between the hard case and the softer core material. Spalling also can be formed by destructive pittings breaking into each other, leaving wide voids (Glaeser, 1996).
With unhardened gears or medium hard gear (32 HRC), pitting often occurs as run-in processes due to bedding action (the distortion due to thermal treatment and ungrounding before meshing stay on the contact surface, including misalignment and minor profile errors). Such pitting often heals and the gear flank can become smooth again after a certain number of rotations. Pitting of this nature will tend to start during the first few hundred hours of running. The pitting could stop, in which case the pitted surface begins to polish up and burnish over.
Any pitting of hardened gears is generally a cause for alarm since the problem is unlikely to improve with time. Particularly, with case hardened gears if the case is thin or the core material weak, the case may be crushed and flaked off, leaving large pits in the surface. Case hardened gears operating at high loads and low speeds also sometimes show pitting at their pitch lines. This appears to be associated with the reversing surface sliding shear stresses which occur at this position and subject the hardened case to local fatigue failure (see Figure 1-6b), (Guichelaar et al., 1974).
1.3.1 Surface/subsurface crack initiation mechanics
As seen earlier, pitting can be of either surface origin or subsurface origin. The surface origin pits are usually associated with a thin oil film effect and surface irregularities. These could be flaws or inclusion at or very near the surface, tool marks, or imbedded debris. Figure 1-7a shows an arrow head type pit associated with surface initiated pitting, and is an example of the type of pits associated with the surface nucleation cracks.
Figure 1-7b shows subsurface cracks joint to contact surface. It shows that subsurface pits are often initiated by a maximum amplitude shear below the surface and inclusions. When a crack is formed by a frequently repeated stress, the crack propagates from the point of inhomogeneity in the material and progresses towards the surface in two directions; either parallelly or radially to the surface (see Figure 1-7b and Figure 1-8). When several radial cracks join a lateral crack below the surface, a certain volume of material will be detached, (Guichelaar et al., 1974).
a)
b)
Figure 1-7 Surface/Subsurface pitting type, (Guichelaar et al., 1974): a) Surface origin pitting; b) Subsurface origin pitting
Figure 1-8 Origin crack on surface and at subsurface, (Norton, 2006)
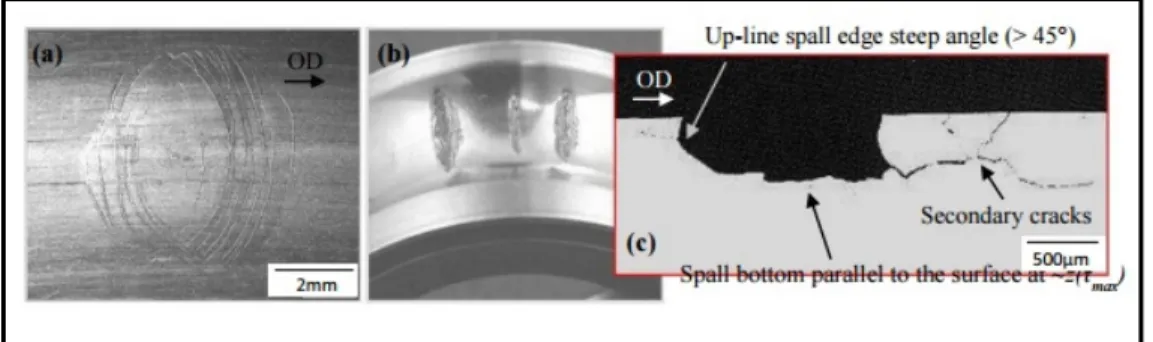
Figure 1-9 Subsurface of bearing contact fatigue of roller contact, (Crehu, 2015): a) Bearing cracks at surface; b)spalling at bearing surface; c) Spall
bottom parallel to surface. OD: Over-rolling direction
As opposed to surface initiated spalls, subsurface initiated spalls present an oval shape and are most often deep, as they initiate around the maximum shear stress depth z(𝜏 ) , (see Figure 1-8). Moreover, when observed on a circumferential cross section they present steep angled edges and a flat bottom, which is mostly parallel to the surface, (see Figure 1-9c). Subsurface initiated spalls tend to propagate in the direction of rolling and secondary cracks preferentially develop on the down-line spall edge, (Crehu, 2015).
1.3.2 Pure rolling contact effect on nucleation crack region
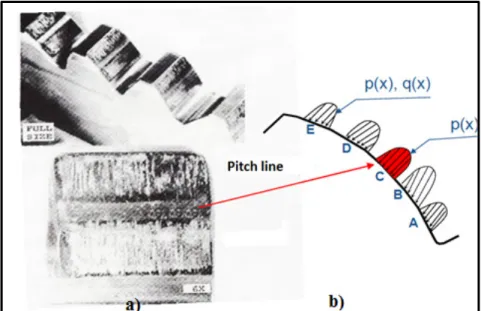
To better understand this mechanism, analysis of the stresses, which is a prerequisite for fatigue analysis, must be done. Gear tooth stresses have been analyzed by many researchers. When gear pinion teeth are in action, the teeth roll and slide against each other in the meshing. This creates sliding contacts between the surfaces. The meshing movement generates normal and tangential forces that induce compressive and shear stresses at points in repetitive contact. When the gear is in engagement contact with the pinion, each point of contact is considered as the contact point of two parallel cylinders in contact with their equivalent radii of curvature. This section summarizes the pure rolling contact effect on gear nucleation cracks. This study designed a parallel cylinder model to simulate pure rolling at the gear pitch line.
1.3.3 Surface motion analysis
When the wheel and pinion fit together, they produce contact points on the action line as a base circle (see Figure 1-10). The teeth number decides a half angle of teeth, θ. In the tangent line with base circle, a distance of a correspondent circumference segment L is the distance from the point in base circle to involute line (gear form). The direction of the force acting at the contact point of the gears with involute curves is constantly along the common tangent (z).
Figure 1-10 Base circle and involute line of gear
Depending on the position of the contact points, the surface movement can be in the form of two actions: rolling and sliding. Pure rolling creates normal pressure and pure sliding produces friction on the contact surface. At the pitch line, there is only pure rolling, while elsewhere, there is a combination of rolling and sliding.
When observing some cases of surface wear, it can be noticed that there are two distinct abrasive surface regions on the gear tooth flank, (see Figure 1-11a) and an intact surface in the middle. The intact surface is adjacent to the pitch line. It can thus be deduced that the abrasive surfaces are caused by sliding, combined with the rolling effect, and that the neighbouring
surface of the pitch line is intact because there is only pure rolling around it. Figure 1-11b shows some representative contact points in the flank tooth: A, B, C, D, and E (point C is the point of the pitch line). There is only pure rolling at the primitive line (point C) while at other points (A, B, D, E); there is a combination of rolling and sliding.
In other words, the pure rolling is based on point C, which forms a kind of normal parabolic pressure at the contact point, and at other representative points. The contact pressure forms an inclined parabolic pressure, due to the rolling and sliding combination of normal pressure distribution (p (x)) and slip (q (x)), along rolling direction (x).
Figure 1-11 Abrasive areas in the vicinity of pitch line at tooth flank in motion: a) wear at pitch line; b) rolling and
sliding combination along contact line, (Alban, 1986)
The normal pressure p(x) and sliding q(x) equation is presented by Coulomb’s law expressed by a friction coefficient, µ:
𝑞(𝑥) = µ. 𝑝(𝑥) (1.1)
where x is the distance from the contact center to the end of the contact width in the rolling direction, 𝑞(𝑥) is the sliding at the contact surface, and 𝑝(𝑥) is the normal pressure at the
b) a)
contact surface. In this study, the pure rolling point at the contact line was investigated by a similar approach using cylinders in contact.
1.3.4 Rolling contact cylinders modeling
Almost all methods regarding static contact stress are based on the analytical solution of Hertz (1881). Since the Hertz contact stress is calculated in the case where only normal pressure is present, it is a static stress. The stresses at the contact point are calculated by Hertz’s theory. It is assumed that contacts between a pair of gear and the pinion teeth are represented by two parallel cylinders in contact, (see Figure 1-12). In this study, which examines the influence of the residual stress profile on rolling fatigue contact, the pitch point was chosen with a pure rolling effect and a residual stress profile that can enable understanding of how to prevent wear by rolling contact fatigue. Figure 1-12 shows the concept of converting contact gears to two parallel cylinders at contact at pitch point, where 𝐹 is the normal load, 𝑝 is the maximal pressure at the center contact, 𝑎 is the semi width contact length, R is the radii of contact cylinder.
Figure 1-12 Normal pressure at contact region: a) Model transformation of meshing gears to the equivalent model of two cylinders for the contact point, b) the normal pressure at contact point presented as
1.3.5 Effects of sliding on rolling contact fatigue
To introduce dynamic contact, a combination of the two movements, rolling and sliding, must be considered. For a period of 24 years, Morrison (1968) conducted tests on copper, steel, bronze, aluminum and non-metallic materials to obtain surface fatigue resistance data using pure rolling and combined rolling and sliding with different slip percentages. He obtained that the relative rotational roll speed on the pitch line of the contact interface causes wear by contact rolling at the pitch region.
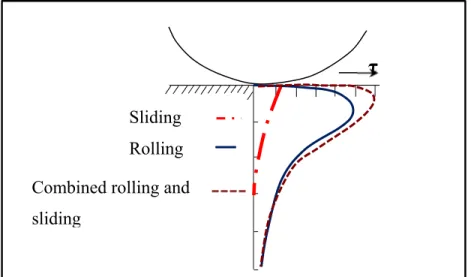
Thus, the normal stresses do not change in intensity but the tangential stress is modified by adding sliding. The distributions of maximum shear stress adjusted in dynamic contact in case of subsurface pure rolling, pure sliding and combined rolling and sliding are illustrated in Figure 1-13. In pure rolling, the shear stress reaches maximum peaks at a point deeper than is the case of combined rolling and sliding, (see Figure 1-13).
Figure 1-13 Maximal shear stress distribution in contacting surface due to pure rolling, pure sliding and combined
rolling and sliding, (Alban, 1985)
An analysis of the influence of friction in rolling-sliding contact by Broszeit (1977) shows that this effect offers another possibility to shift the maximum shear stress close to the surface while
Sliding Rolling Combined rolling and sliding
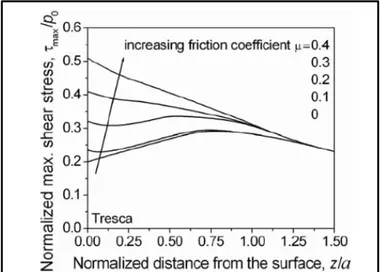
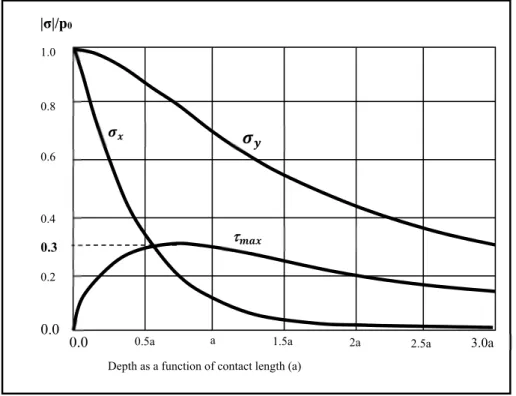
the friction increases, (see Figure 1-13). The maximum shear stress 𝜏 increases with surface friction, and the position changes from 0.786𝑎 for the contact surface (𝑎 is the semi length contact).
The sliding generates maximal shear stress peaks closer to contact surface and change the distribution of maximal shear stress in the subsurface, from the surface to a depth of 1.25 𝑎 ( 𝑎 is semi contact length) and increases the value from 0.2 𝑝 to 0.5 𝑝 at contact surface by increasing the friction coefficient from 0 to 0.4, (see Figure 1-14). Thus, the sliding effect does not reach deeper than in the hardening surface study. With significant case depth, the sliding effect favours nucleation crack occurrence much closer to the contact surface (small pitting risk). This effect is an interesting prospect for a future study.
Figure 1-14 Maximum shear stress by Tresca variation in depth as a function of friction
coefficient, (Broszeit, 1977)
On the other hand, most experimental tests show that pitting occurs mostly in the pitch region where the pure rolling load applies. Following Alban’s (1985) work on gear failure, the mechanics of subsurface pitting by pure rolling contact fatigue in normally loaded gear teeth mostly depend on the maximum shear stress 𝜏max plane, below the surface at a depth ranging
from 0.18 mm to 0.31 mm, ahead of the pure rolling contact point (pitch line-free sliding). For a heavy load, this distance of maximum shear stress is deeper and the crack propagation tends
to turn to inward. The cracks continue under repeated stress until heavy pitting or spalling takes place.
In many procedures, such as carburization, nitriding, and induction hardening, case-heat treatment is used to introduce compressive residual stress in case depth, which covers these distances of maximum shear stress area. These surface heat treatments have been experimentally shown to delay crack nucleation; thereby allowing heavier loading. The crack initiation mechanics depend on the maximum shear stress plane, but some spalling originates below the case/core transition zone, (see Figure 1-15, Figure 1-16), (Alban, 1985).
Figure 1-15 Spalling-a subsurface fatigue failure originating at case/core interface, at transition of
carburized case of gear tooth, (Alban, 1985)
Figure 1-16 An internal rupture in a gear tooth at the case-core transition zone which does not reach the surface, (Alban, 1985)
Fernandes (1997) confirmed that surface contact fatigue is the most common cause of frequent failure mode in gears. There are three modes of surface failure resulting from surface fatigue; these modes depend on the distribution of stress on the surface: the rolling contact fatigue occurs along the pitch line of gear flank and leads to nucleation cracks; spalling is the cause of wide and deep nucleation cracks on contact surfaces. This failure is either due to pure rolling or a combination of continuous sliding and rolling or cracks at the interface between case depth and the gear core.
As mentioned in the preceding paragraph, Alban (1985) and Fernandes (1997) worked on nucleation cracks below the contact surface 0.18 mm to 0.31 mm below the case/core transition region. Their study focuses on pure rolling case and the effect of residual stress on pure rolling contact fatigue and trying to predict the nucleation crack by FEA modeling base on this remark reference of nucleation region. It also aims to see how the residual stress profile influences nucleation cracks on the surface and subsurface of treated parts. Our study will explain these mechanics base on stress analysis by multiaxial criteria in the next chapter.
1.4 Prediction of rolling contact fatigue
In the past decades, a number of investigators have attempted to predict RCF by experimental or analytical methods. Most authors based their study on the analysis of rolling contact stress to describe the RCF process. This chapter presents some theories on RCF analysis.
For rolling contact analysis and modeling of homogeneous metal parts under elastic contact loading conditions, many approaches use the Hertz stress distribution theory to calculate the maximum shear stress on the orthogonal plane, in order to predict the maximum allowable loading needed to prevent RCF, (Hertz, 1881; Johnson, 2004). The orthogonal shear stress reaches a maximum in two planes below the surface simultaneously: one parallel and one perpendicular to the contact surface, (Zaretsky et al., 1965). The Lundberg-Palmgren theory postulates that the most critical stress factor for fatigue damage is described by the maximum subsurface orthogonal shear stress and that fatigue failure is always initiated by the maximum
orthogonal shear stress at the depth where it occurs, and it can be used to predict the maximum allowable loading and fatigue life, (Lundberg and Palmgren, 1952). Following these approaches, many authors have successfully predicted fatigue life, as well as the maximum allowable loading in the rolling contact fatigue life of homogeneous metal, (Sadeghi et al., 2009; Lundberg and Palmgren, 1952, Coy et al., 1975; Harris et al., 1999, Zaretsky et al., 1995; Harris et al., 1996).
For analysis and heterogeneity modeling of heat treated metal, heterogeneity is introduced. Models based on the assumption of homogeneity are no longer valid for surface treated parts as significant heterogeneity is present in the part. Heat surface treatments, such as induction hardening, carburization, and nitriding improve rolling contact fatigue performance. Many approaches have taken into account the need of generating heterogeneities in the microstructure to increasing hardness, as well as to induce residual stress gradients, (Savaria, 2014, Savaria et al., 2016; Palin-Luc et al., 2011). Alternative methods have been proposed to estimate the RCF life of components, including a linear combination of Hertz theory and heterogeneity gradient measurements, (Muro et al., 1975; Pazdanowski, 2014; Morison, 1968) and experimental approaches, (Koibuchi et al., 1982; Shipley, 1974; Townsend, 1995; Akata et al., 2004).
To control the RCF of a treated component, numerous authors have developed their own mathematical models and experimental methods to evaluate the effect of residual stress on RCF predictions. The residual stress intensity has been recognized as the most important parameter for controlling crack nucleation, (Muro et al, 1975; Pazdanowski, 2014; Morrison, 1968). Based on the Lundberg-Palmgren theory, Zaretsky et al. (1995) showed that the orthogonal shear stress in the perpendicular plane-to-surface contact is not significantly affected by either hoop or residual stresses. They suggested that in the presence of residual stress, the maximal shear stress on a plane (45- to 90-degree (horizontal) range), 𝜏 (Tresca stress) or octahedral stress (Von Mises stress) parameters should be used to analyze the rolling contact fatigue life.
In situations where high compressive hydrostatic stresses are present, the Dang Van criterion will overestimate the maximum allowable loading (Flavenot et al., 1984; Lefebvre, 1989), as this criterion cannot consider the possibility of exceeding a certain plastic limit in the compressive hydrostatic domain. In particular, plastic deformation may take place due to material kinematic hardening or softening, (Johnson, 2004), resulting in a shakedown process.
To keep the model as simple as possible, this kinematic behaviour will not be used in the present work; however, this study does not use the multiaxial Dang Van criterion in compressive hydrostatic conditions but rather a critical shear stress value (taken as the material torsional fatigue limit). This critical shear stress is used as the torsional fatigue limit and kinematic hardening is not considered. This represent an idealised material within yields elastic behaviour (Johnson, 2004). Several authors, including Desimone et al. (2006) and Bernasconi et al. (2005), have successfully predicted the allowable loading for RCF in the presence of residual stress using the Dang Van criterion, as well as a given stress fatigue limit in compressive hydrostatic conditions. While these works provided convincing results, they did not predict or discuss the positions of nucleation sites. Moreover, they did not consider any material property gradient in the rolling parts. These two aspects will be discussed in the present study, and represent the main novelty of the work.
1.4.1 Multiaxial fatigue criteria
Another approach is to consider a high hydrostatic stress gradient. Crossland (1954) has shown that hydrostatic stress does not seriously affect yield criteria, but may influence the strain required to cause fatigue failure. In particular, tensile stress favours this mechanism, whereas hydrostatic compressive stresses help to restrain it, (Harris et al., 1996; Palin-Luc et al., 2011; Muro et al., 1975; Pazdanowski, 2014; Flavenot et al., 1984; Lefebvre, 1989; Nemkov et al., 2013). In the presence of the RS case, many authors, such as Crossland, Sine, and Dang Van use multiaxial stress analysis criteria (including hydrostatic stress effect) as an effective critical stress for predicting rolling contact fatigue, (Sadeghi et al., 2009; Palin-Luc et al., 2011; Flavenot et al., 1984; Dudragne et al., 1981; Ekberg et al., 1995; Kim et al., 2014). In rolling
contact, the contact region stress distribution is multiaxial (also called non-proportional) as the shear stress and normal stress are out of phase. The Dang Van criterion is particularly interesting in the case of RCF because values are calculated using the shear and hydrostatic stresses at any “time”; especially as this allows for non-proportional behaviour. As a consequence, Dang Van criterion will be used in the present work, and further details will be provided as the work proceeds.
1.4.2 Dang Van criterion
The superposition of rolling contact loading on a residual stress field results in a permanently varying multiaxial stress state. Dang Van proposed a multiaxial fatigue limit based on a mesoscopic scale approach. With Papadopoulos, they proposed a multiaxial fatigue damage theory covering both the unlimited fatigue life (fatigue limit criterion) and the limited fatigue regime (multiaxial Wöhler curve, multi-level cyclic loading).
As cracks usually occur in transgranular slip bands, the local shear acting on these planes is an important parameter. Moreover, the normal stress acting on these planes accelerates damage formation. For this reason, hydrostatic stress is preferred because it is much easier to use, being an invariant scalar. Furthermore, it can be interpreted as the mean value of the normal stresses acting on all the planes that pass through the point considered in the structure. Based on these remarks, Dang Van (1993) chooses for a stress function f(σ) relation between the local shear stress τmax and the local hydrostatic stress σH. The simplest criterion that can be conceived is a
linear relationship between these quantities:
𝑓(𝜎) = + 𝛼𝜎 − 𝛽 (1.2)
where 𝛼 and 𝛽 are material parameters; 𝛼 is the limit angle of Dang Van limit line, which present the tensile hydrostatic stress effect on fatigue (rad), 𝛽 is the torsional fatigue limit value (MPa). The safety domain (no fatigue crack initiation) is delimited by two straight lines in Figure 1-17, which can be determined by experiments such as uniaxial tests of
tension-compression and torsion on classical fatigue test machines. The elastic shakedown has been assumed that in the high cycle fatigue regime, at least for loading paths equally the corresponding fatigue limit.
Figure 1-17 Fatigue limit domain and typical loading path, (Dang Van, 1999)
Figure 1-17 shows the internal hydrostatic stress (p) and maximal shear stress (τ) path of one studied point, the path is safe in the no-damage region. The path crosses the damage limit line. Therefore, the studied point of path is damaged by cracking.
1.5 Research objectives and outline
The main objective of this research is to develop a new approach to predict the maximum allowable loads of multilayer materials produced by induction hardening taking into account the significant tensile residual stresses below the surface. By combining residual stress and material gradients, this model is more complex than the one available in the literature. The non-proportional behaviour of the multiaxial stress during rolling contact problem will also be taken into consideration. This will allow us to better understand the role of RS in enhancing rolling contact fatigue performance. A finite element modeling method was developed, based on research methodology, to predict the maximum allowable load in contact with an induction-treated cylinder. This procedure will enable the study of hardened material behaviour by
examining the elastic limit and hardness of three different layers (case depth, over-tempering region and core) as well as three materials of different mechanical properties.
Four specific steps can help to inform the main objective:
(1) Use experimental measurements of residual stresses in an induction heat treated part for the purpose of superimposing them in the numerical model;
(2) Build a numerical model using the finite element method (FEM) to simulate two parallel cylinders in contact under pure rolling conditions. The model should be expandable to include sliding contact conditions;
(3) Quantify the influence of rolling contact fatigue generated residual stresses on maximum allowable loading (𝐹 ), nucleation crack position; pressure limit (p ), maximum residual shear stress limit, in both the compressive region ( _ _ ) and the tensile region ( _ _ );
CHAPTER 2 METHODOLOGY
2.1 Introduction
This chapter presents the heterogeneities typically found in an induction treated AISI 4340: micro hardness profile and the related fatigue properties of each correspondent material found in the part. The analysis theory of contact is then presented followed by the maximal pressure of non-conform cylinder bodies in contact and a convergence study on a FEA model. Finally, the geometry and property-modeling is detailed to introduce RS in the part.
Two strategies are then proposed to reach the defined objective. The first strategy investigates the effect of hardness gradient and RS on the maximum rolling contact load with a RS profile having a case depth of 0.8 mm and a 200 MPa in tensile hydrostatic residual stress peak. The second strategy studies various case depths and RS profiles to maximise the allowable load. A multiaxial fatigue criteria-based approach is proposed to predict the maximal load by RCF.
2.2 Material and Hardness
The material used, AMS 6414 (similar to AISI 4340), is a martensitic low alloy steel (with 0.4 %C). Typical applications for 4340 alloy steel include structural use, such as in aircraft landing gears, power transmission shafts and gears. 4340 alloy has good hardenability, allowing parts made with it to be fully hardened and later tempered to the desired hardness. A hardness of 48 HRC provides a good compromise between fatigue strength and toughness, but is not hard enough for contact fatigue applications. However, thanks to induction hardening, the surface of a 48 HRC tempered martensitic part can be transformed to a hard martensitic phase of around 60 HRC, providing excellent wear resistance to the manufactured part.
A surface region reaches austenitic temperature and upon quenching becomes hard martensite. The high heat flow generated by induction treatment generates an underlying “over-tempering”
region with a lower hardness than the initial one. The hardness of this region can be significantly lower than the bulk hardness and a value of 38 HRC was chosen as a representative hardness for this homogeneous layer in this study. A typical hardness profile is shown in Figure 2-1 for a case depth of 0.8 mm. Here, three different zones can be identified: case hardening (60±2 HRC) with a thickness of 0.8 mm, the over-tempering zone (as low as 38±2 HRC) over 0.7 mm, and the core region below (48±3 HRC). Table 2-1 presents the material and fatigue parameters of the different regions present in induction treated parts as characterized by Savaria (2014, 2016). This typical profile was used as the material gradient in the present model.
Figure 2-1 Hardness profile of induction treatment from the surface to the core
The hardness gradient generated in the part results in a corresponding gradient in the elastic, plastic and fatigue properties of the material. For example, the Young’s modulus of the material was found to vary with steel hardness, being lower for higher hardness (Reitinger et al., 2008). However, the variations were only by a few percentage points (about 5%) (Savaria, 2014; Moghaddama et al., 2014) making them somewhat insignificant in terms of strain heterogeneities. For the sake of simplicity, these heterogeneities were not taken into account in the present version of the model. On the other hand, the gradient in plastic and fatigue
properties was considered and simplified as a superposition of 3 layers of materials with the properties provided in Table 2-1.
Table 2-1 Hardness, thickness, and material fatigue parameters of different material conditions present in induction hardened parts from
Savaria (2013) and Savaria et al. (2016)
Layers Case depth Over-tempering
(OT) Core
Hardness (HRC) 60±2 38±2 48±3
Thickness (mm) From 0 to 0.8 From 0.8 to 1.5 >1.5 yield stress in simple test
(MPa) 801 546 630
𝜎 yield strength (MPa) 1570 1132 1370
Fatigue Dang Van parameters
𝛼 (for 10 cycles) 0.688051 0.808051 0.616051
𝛽 (MPa) (for 10 cycles) 801 440 529
2.3 Finite element modelling
2.3.1 FEA model validation by static contact stress in 3D description
An analytical solution helps to validate a finite element analysis (FEA) model by ANSYS software. This consists in the comparison of simulation results. Hertzian theory on the contact of elastic solids has been summed and is commonly used to solve contact problems. The contact area and stress distribution are determined by the contact geometry, the load, the material properties and the elastic body deformation. Contact geometry depends on the contact surface, which could be convex or a combination of flat, convex and concave. The shape of the contact area depends on the curvature of the bodies’ contact. In many practical contact body engineering applications, to control the axis of rolling, the gear flank or contact surface of the cylinder will be machined to be tightly elliptical in the axial direction to allow contact