Size Value and Asset Quality Premium in European Banking Stocks
Nawazish Mirza
**CEREG – Paris Dauphine
Hervé Alexandre
*CEREG – Paris Dauphine
** Corresponding Author Email: [email protected] Paris Dauphine
Place du Maréchal de Lattre de Tassigny Paris 75775 France * Email: [email protected] Paris Dauphine
Place du Maréchal de Lattre de Tassigny Paris 75775
France
Abstract
Banking firms exhibit unique business and financial dynamics that are priced in their stock returns. This paper compares traditional empirical asset pricing models on portfolio of banking firms from fourteen European countries and proposes a banking specific risk factor. We compared a single factor CAPM with three factors Fama and French model on exchange rate adjusted returns and found substantial support for firm specific factors of size and value. We propose that asset quality premium (proportion of non-performing loans to total advances and measured as BMG - bad minus good) constitutes an important asset pricing factor for banking stocks. The portfolios sorted on size, value and asset quality explained the maximum variation in returns depicting asset quality as a critical investment factor for banking stocks. These results have considerable implications for investment appraisals, cost of capital and risk management in financial stocks.
Keywords: Banking Stocks, Asset Quality, Size and Value Premium
JEL Classifications: G10, G12, G15
1.
Introduction
Asset pricing has emerged as a dominant theme in financial economics with primary focus on optimal risk return trade-off. The earlier propositions on the subject by Sharpe (1964), Lintner (1965) and Mossin (1966) revolves around a single factor capital asset pricing model (CAPM) with market risk premium as the only variable that is priced in stock returns. Despite of some early empirical evidences in favour of CAPM, a large number of academicians suggested additional factors that might affect stock returns. These factors include price earning (P/E) ratio [Basu (1977)], company size [Banz (1981)] and more importantly book to market and equity size [Fama and French (1992)] that triggered alternative explanations for asset pricing puzzle.
Fama and French (1992, 1993, 1995) demonstrated that market risk of CAPM alone is unable to explain the variations in stock returns and firm size (measured as market value of equity) and book to market ratio (value effect) are relevant determinants of expected returns. The three factor proposition emerged as a significant alternate asset pricing model and related statistical evidences posed some serious challenges to the validity of CAPM. This incited a series of researches to determine if three factor model is robust and holds some theoretical relevance or if such empirical results are synthetic owing to specific data, sample and statistical gimmicks. The exhaustive literature based on US and non US data provide mixed results for three factor model. Some evidences suggest that reports on death of beta are premature and CAPM is still a better predictor of returns, while others propose that size and value premium are deterministic variables for returns and CAPM should be discarded in favour of Fama and French three factor model.
An important sample selection criterion in most of the researches on three factor model is exclusion of financial firms. Fama and French (1992) based their analysis on non financial firms since financial firms inherently are highly leveraged and a similar level of
financial leverage in non financial firms would represent severe financial distress. Despite of the significant role of financial firms in economic structure, the studies on their stock returns are limited. Barber and Lyon (1997) were the first to examine the cross section of financial stock returns in NYSE vis-à-vis size and value premium and reported significant loadings for three factor model. They compared results with non financial firms and concluded that size and value factors are relevant factors for both financial and non financial firms. Viale et al (2009) analysed the risk factors priced in US banking equities. They found no evidence for significance of size and value factors and concluded that market risk premium and shocks to the slope of yield curve are the relevant risk factors.
Financial firms constitute a substantial portion of equity markets both in developed and emerging markets and thus are strong candidates for inclusion in investment portfolios. Moreover, the regulatory framework of Basel II emphasizes on use of market discipline to analyse the risk taking behaviour of financial firm warrants the need to understand the risk factors relevant to banking equities. Therefore, with unique business and firm characteristics, it would be interesting to observe if conventional asset pricing variables can predict expected returns or if there are more specific factors that could better explain cross section of banking stocks.
We deploy an international portfolio approach on listed banking stocks from fourteen European countries using data that span over 1999 to 2008 and propose an asset quality augmented (bad minus good) Fama and French model. The asset quality1 of a bank is a unique factor that could affect all aspects of a bank’s performance and a substantial decline in asset quality will not only erode the profitability but could ultimately lead to the failure of the bank. Therefore, banks with better asset quality enjoy better credit standings while banks with low
1
asset quality, owing to higher non performing loans, have high risk with comparatively higher probability of default.
The empirical evidence is reported on a single factor CAPM, Fama and French three factor model and a four factor asset quality model. The results demonstrate significant factor loadings for all three models. However, the explanatory power of four factor asset quality model was superior to Fama and French three factor model and a single factor CAPM for all sorted portfolios. Therefore; our main findings suggest that a Fama and French model including size and value factors augmented for asset quality best captures the cross section of returns in European banking stocks.
This paper has multiple contributions towards existing literature. Firstly, we extend the asset pricing literature to financial stocks using an exchange rate adjusted international portfolio and a synthetic value weighted index. Secondly, we propose a unique risk factor of banking stocks that is very critical for their intermediary efficiency and long term survival. Lastly, our results have practical implications for investors and fund managers. The asset pricing of banking stocks for investment and valuation should take into account size, value and asset quality premium. Similarly, for estimating cost of equity of banking firms asset quality should be an integral part. The event studies on banking sector should use a four factor model rather than conventional bank asset pricing variables of interest rates and market premia. Lastly, these results provide an insight into the risk factors of banking stocks that might be of interest for regulators to analyse the risk taking behaviour of such firms.
The rest of the paper is organised as follows. Section II will provide a brief literature review on asset pricing vis-à-vis banking stocks. Section III will discuss the data and methodology. Empirical results are presented in Section IV, while Section V will conclude.
2.
Literature Review
Banking spreads are function of yield on interest generating assets and mark up on interest bearing liabilities and, therefore, are sensitive to interest rate. The dependence of banks’ profitability and hence future cash flows on interest rates resulted in literature on financial stocks that proposes use of interest rate variable along with traditional market factor as vital determinant of returns. Stone (1974) was the first to propose interest rate sensitivity in addition to CAPM market factor to explain variation in stock returns of commercial banks. Some of the subsequent studies reported empirical results in favour of interest rate factor [Fama and Schwert (1977),Flannery and James (1984)] while others deduced weak or no relationship between interest rate and stock returns [Flannery et al. (1997)].
However, a caveat to interest rate factor is its variability over time. The factor is reported to have better explanatory power when interest rate volatility is high while in stable interest rate periods; the stock returns remained unaffected from interest rate factor [Yourougou (1990), Choi et al (1992)]. Another set of studies propose that innovations in interest rate variable would have higher explanatory power for returns as compared to expected interest rates. Bae (1990) studied the impact of expected interest rates and surprises to such expectations for stock returns of depository and non depository institutions. The empirical analysis included three interest rate indices of different maturities and results reported a higher sensitivity for surprises to yield curve with longer maturity. Neuberger (1993) analysed the impact of shocks to yield curve for US commercial banks’ returns from 1979 to 1990 and reported a shift in risk sensitivities. The relationship between unexpected changes in interest rates and stock returns was weekend towards the end of the sample period. Dinenis and Staikouras (1996) analysed the impact of expected and innovations in interest rates on UK banks’ stocks and found a negative relation between these innovation and returns. An interesting common point in these studies was observation of higher sensitivity of interest
rates towards the start of sample periods that gradually decreases over time. Moreover, none of these studies analysed the traditional asset pricing theories and their ability to explain the variation of returns in banking stocks.
As mentioned earlier, Barber and Lyon (1997) studied the pricing of market, size and value factor in US financial stocks. They compared the mean returns for financial and non financial firms sorted on book to market and size factors and found no significant difference. Similarly, they found significant coefficients on size and value factors for both financial and non financial firms. They concluded that despite of having substantially high financial leverage for financial firms, the market factor along with size and value premium are priced in banking returns and hence such returns could be explained under traditional asset pricing framework.
Viale et al (2009) tested the traditional asset pricing proposition on US banking stocks. They analysed a single factor CAPM, Fama and French three factor model and Intertemporal capital asset pricing model (ICAPM). All banking stocks were selected from CRSP for the period between 1986 and 2003 and were sorted into 25 value weighted portfolios at the intersection of five size and five book to market groups. The market factor was constructed as the difference between nominal return on value weighted CRSP stock market index and one month Treasury bill yield. The size and value factors were constructed in line with Fama and French propositions. The ICPAM specifications included innovations in market dividend yield, risk free rate, term (difference between yields on portfolios of long term and short term government bonds) and default factor (difference between yields on portfolios of long term corporate bonds and long term government bonds). The empirical results provided no evidence in favour of pricing of size and book to market factors in banking stock returns. However, they found significant coefficients on excess market returns and shocks to the yield curve under an unconditional ICAPM framework. Similarly, they deduced significant results
for default spread under a conditional ICAPM version. They concluded that only market factors along with innovation in yield curve and default spread are priced in financial returns while book to market and size are not related to variation in returns.
Despite of strong relevance of credit risk as a threat for banking system, the impact on banking stocks is not very clear. Although the interest rates (or its innovations) have been widely discussed as determinant of banking returns yet the impact of credit risk on financial asset pricing has surprisingly been ignored. The informational content of credit risk (disclosure regarding loan loss reserve or non performing loans) provides strong evidence on sensitivity of banking returns to such announcements.
Beaver et al. (1989) studied the relationship between financial reporting, supplementary disclosures and bank share prices for 91 US banks from 1979 to 1983. They found that supplementary variables of interest rate risk and default risk have significant explanatory power. They also deduced that loan loss provisions have incremental significance over traditional valuation variables. They concluded that higher loan loss provisions are associated with higher market values of bank stocks.
Griffin and Wallach (1991) analysed the impact on stock returns of 13 US banks when they decided to place their Brazilian loans on a non accrual basis and increased loan loss provisions to recognise a higher probability of default. Using event study methodology, they reported that stock market responded adversely to the reclassification of non performing advances and a positive reaction was observed vis-à-vis increase in loan loss reserves. These results depict rational expectations of investors since increase in loan loss provisions is a credible signal about banks intention to sustain their asset quality. They concluded that stock markets discriminate banks on the basis of default risk.
Elyasiani and Mansur (1998) used GARCH framework to model interest, market and exchange rate risk for 52 Japanese banking institutions for the period between 1986 and 1996. The source of these risk estimates was then related with bank specific accounting variables. These variables included risky debt, risk weighted assets, asset quality, market structure and off balance sheet activities. The results indicated that market and exchange rate risk were significant for all banks while interest rate risk was not relevant throughout sample. The accounting variables as explanatory variables for various risks were significant with negative coefficient on provision for impaired loans. They attributed the negative coefficient to the perception that an increase in these provisions is expected to reduce the credit risk.
Ahmed et al (1999) analysed 113 banks with CRSP data over the period 1986 to 1995 and examined the impact of bank loan loss provisions on capital management, earnings management and market signalling. The results validate the capital management hypothesis with diminishing negative relation between loan loss provisions and capital. However, the loan loss provisions had insignificant coefficient with earnings management demonstrating that these provisions have no role in earnings management. For signalling hypothesis, the market adjusted buy and hold returns were regressed on earnings before tax and provisions, loan loss provisions and changes in nonperforming loans and loan charge offs. The results showed a significant negative coefficient on loan loss provisions and change in nonperforming loans while a positive coefficient for earnings were reported. They concluded that a negative sign may refute the signalling hypothesis but significance level demonstrates its relevance in explaining bank stock returns.
Hatfield and Lancaster (2000) examined the market reaction to loan loss reserve additions for 121 announcements between 1980 and 1992 for 33 US bank holding companies. They used event study methodology and reported a negative reaction to loan loss additions before the announcement. The post announcement reaction was positive and was significantly
sustained for several days after the event. They attributed the negative reaction to the surprise factor, as an increase in loan loss provisions indicate erosion in asset quality. However, once the information is known, the investors would perceive the additions as strengthening the risk absorption capacity. They concluded that banking stocks exhibit strong reaction to announcements on default risk and asset quality.
Docking et al. (2000) analysed the reaction of stock prices to loan loss reserve announcements for 153 banks over a period of 1985 to 1990. They classified the banks into regional and money centred banks and found significant negative relationship between loan loss announcement and abnormal returns. They noted that the loan loss reserves had significant impact despite the fact that these provisions are accounting adjustments and do not represent concurrent cash flow implications. They concluded that bank stock returns are sensitive to loan loss reserves and accounting measure of bank soundness and regulatory pressure are likely to impact the market sentiment for loan loss reserves.
Cooper et al. (2003) investigated the predictability of cross section of bank returns by using prominent variables of financial sector. The sample constituted of 213 banking firms for the period between 1986 and 1999. They used bank specific variables of earnings per share, loans to total assets, loan loss provisions to total loans, non interest income to net income, unused loan commitments to total loans, interest rate swaps to total assets, standby letter of credit to total loans and book value of equity to total assets. Furthermore, they included Fama and French style book to market and size variables to analyse the impact of value and size factors. The results demonstrated that variables of non interest income, loan loss reserves, earnings and leverage were statistically significant while unlike Barber and Lyon (1997) they could not deduce a relationship of book to market and size factors with cross section of bank returns. They concluded that bank specific variables have superior predictability power than traditional asset pricing models for cross section of financial returns.
Agusman et al. (2008) analysed the relation between accounting and capital market risk measure using a panel data set of 46 banks from ten Asian countries for the period 1998 – 2003.They deployed standard market risk variables of total risk, systematic and unsystematic risk and regressed against firm specific variables including standard deviation of return on assets, equity to total assets, gross loans to total assets, loan loss reserve to gross loans and liquid assets to total assets. The results with random effect specification showed that standard deviation of returns and loan loss reserve to gross loans demonstrate a significant positive relation with total risk. Similarly, for non systematic risk, the significant coefficients were reported for loan loss reserve to gross loans and gross loans to total assets. They could not find any significant coefficient when systematic risk was used as independent variable. The pooled OLS exhibit similar results with positive relation of total risk and unsystematic risk with firm variables of standard deviation of return on asset, loan loss reserve to gross loans and gross loans to total assets. However, with pooled OLS, the systematic risk depicted a significant relation with loan loss reserve to gross loans. They concluded that despite of significant differences in banking practices across these Asian countries, the firm specific risks notably credit risk measured as loan loss reserve to gross loans are more relevant than systematic risk and therefore can be used to substitute market based risk measures.
3. Data
and
Methodology
3.1
Data and Sample
This study focuses on listed banking stocks from 14 European countries including Austria, Belgium, Denmark, Finland, France, Germany, Ireland, Italy, Luxembourg, Netherlands, Spain, Sweden, Switzerland and United Kingdom over the period 1999 – 2008. The primary sample constitutes of banking common stocks from all countries that has daily dividend adjusted price data available on Thomson DataStream. To be included in sample for year t, the selected stocks should have data available on book value of equity, numbers of
shares outstanding, non performing loans and gross advances for year t - 1. We compute firm size as market value of equity (price times number of shares outstanding), book to market ratio and an asset quality measure of non performing loans to gross advances (NPL/GA).
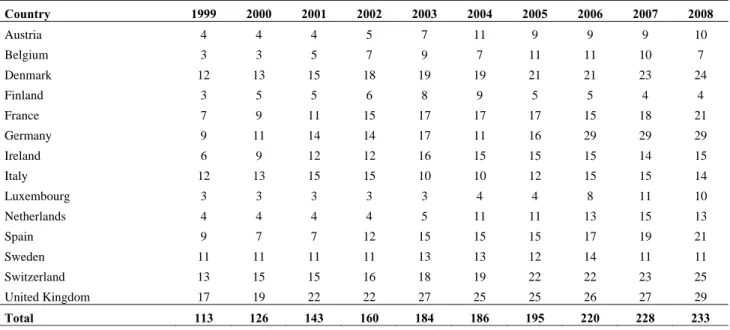
Furthermore, following Fama and French (1993), we address the survivorship bias by including only those stocks which are listed for atleast two years. Similarly, the stocks classified as Dead or Delisted are discarded from the sample. Lastly, we account for the non synchronous trading phenomenon in the final sample as in presence of sleeping stocks the estimated risk parameters are likely to be biased. Therefore, in final sample, we consider only those banking stocks which demonstrate active daily trading and exclude stocks that have at least 85% non-zero returns in one year. Based on this criterion, the number of selected banking stocks from each country for various years is reported in Table 1.
[Insert Table 1 about here]
The sample consists of 113 baking firms in 1999 that increased to 233 in 2008. We observed that the variation in sample is because of the thin trading criteria as most of the banks had no or substantially inactive trading during the early years. However, over time with increase in overall market activity, the volumes for banking firms increased as well and our sample is almost doubled in 2008. Since all of the stocks in the sample exhibit active returns our sample is free from any bias that could arise due to non synchronous trading. On average, the sample contains more banks from Denmark, Germany, France, Switzerland and United Kingdom while contribution of Austria, Belgium and Luxembourg remained low.
The selected stocks from each country will be combined to form international portfolios. An important consideration in formation of such portfolios is common currency as we cannot directly compare risk and returns emanating from stocks denominated in different currencies [Fletcher (2000)]. Most of the countries included in the sample have prices and other data in Euros; however, for Denmark, Sweden, Switzerland and United Kingdom, the
daily prices are denominated in local currencies. To mitigate the impact of exchange rate, we convert the prices and fundamental data of these four countries into common currency (Euro) at spot rate. Once the prices are homogenized to Euro, the individual daily logarithmic returns would be computed. These would take the form
, where Ri(t) represents return for stock i on day t while Pi(t) and Pi(t-1)
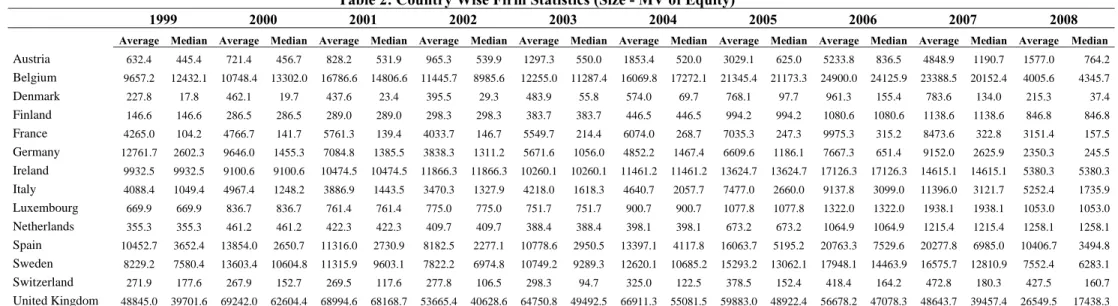
represent prices (in euro) for stock i on day t and t – 1 respectively. These individual returns are then used to compute value weighted portfolio returns sorted for size, book to market and asset quality. Table 2 present the yearly statistics of bank size in our sample for all countries.
[Insert Table 2 about here]
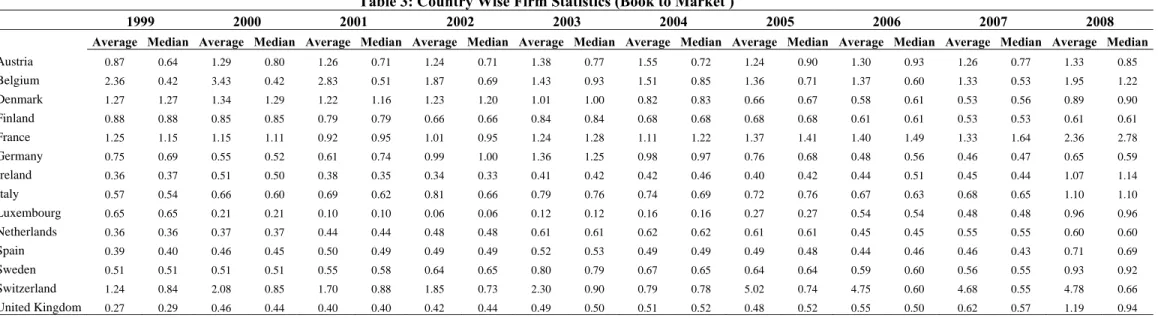
The average size statistics for all countries are following an increasing trend from 1999 to 2008. The banks from United Kingdom exhibit larger average size while Denmark, Netherlands and Switzerland have more banks that are smaller in size. Table 3 shows country wise averages and median of book to market ratio.
[Insert Table 3 about here]
The average book to market ratio is on a higher side for Swiss banks while the ratio remained low for United Kingdom. This represents more value stocks among Swiss banks and higher number of growth stocks in United Kingdom. Considering the utmost relevance of equity as risk absorption cushion in financial sector, Swiss banks with average small size are justified to have an average value rating with respect to book to market ratio. Similarly, United Kingdom with relatively larger banks has the tendency to contribute more growth stocks.
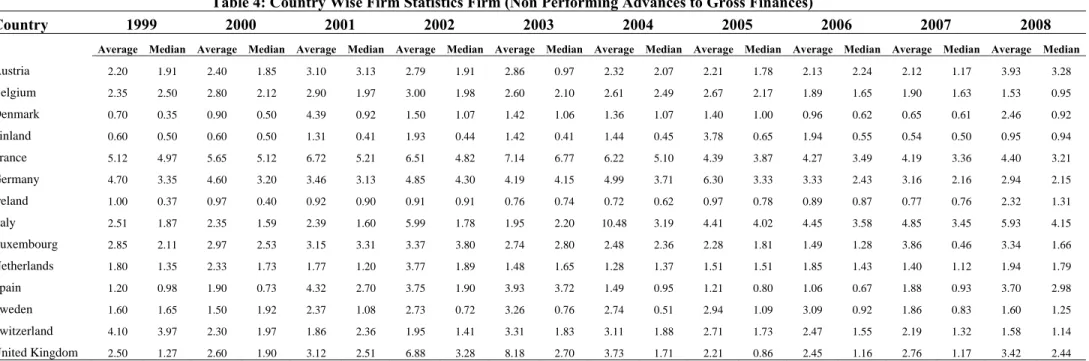
The statistics for non performing loans to gross advances are included in Table 4. The obvious fact from these numbers is a significant increase in ratio for almost all countries in 2008 as compared to 2007. This is clearly attributable to the financial crises in the banking
system as a significant increase in classified loans is among the main causes to trigger the financial panic in 2008. The average NPL/GA for France and Germany during 1999 to 2008 remained higher than other countries depicting bad asset quality for French and German banks, while Danish banks showed better asset quality with low NPL/GA ratio.
[Insert Table 4 about here]
3.2 Portfolio
Construction
In order to capture the impact of traditional size and value premium along with the augmented factor of asset quality the portfolios are constructed on a three way sort. We combined banking stocks from all countries selected as per sample criterion. Then using median of market value of equity for year t, we classified all stocks into two size portfolios as big (B) and small (S) for year t+1. The next step is creating book to market portfolios in two size groups based on book to market value of all stocks with top 30% as high (H), middle 40% as medium (M) and lower 30% as low (L). This results in a total of six market value and book to market portfolios with three book to market portfolios in each size group.
Furthermore, we classified stocks in each of these six portfolios according to their asset quality in two stock groups. There are two main ratios that are widely accepted as possible indicators of asset quality and credit risk. These include non performing loans to gross advances (NPL/GA) and loan loss reserve to gross loans [Agusman et al (2008)]. However, to estimate asset quality, NPL/GA is preferred over loan loss reserve to gross loans because loan loss reserve is directly dependent on a bank profitability and banks with higher pre provision earnings could create higher provisions and vice versa. On the contrary, NPL/GA directly assesses the bank’s capacity in its core business as this ratio is dependent on prudent and clean lending system and credit risk controls. A higher ratio of NPL/GA indicates higher proportion of non-performing loans vis-à-vis total loans and ultimately requires more provisioning. Therefore, asset quality could affect a bank’s performance by impacting both
revenues and expenses. Initially, bad loans reduce the interest revenues on loan portfolios and later a provision is required to expense out the impact of such loans. To include asset quality factor in our proposition, the stocks having a NPL/GA2 value higher than median are considered as bad quality banks (Bd), while those with a lower value are classified as stocks
having good asset quality (Gd). In this manner we obtain a total of twelve value weighted
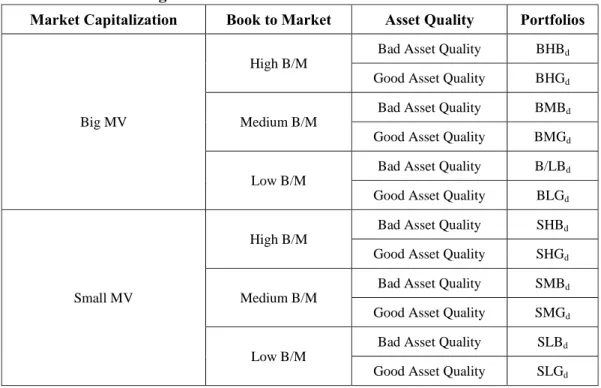
portfolios that contains stocks which are sorted for size, book to market and asset quality. These portfolios are rebalanced every year in June for the sample period based on size, book to market and asset quality. The portfolio construction procedure is illustrated in figure 1.
[Insert Figure 1 about here]
The twelve portfolios are titled as per their size, book to market value and asset quality. The portfolio BHBd will represent stocks that are big in size with high book to market ratio and
bad asset quality. Similarly SLGd will represent stocks that are small in size with low book to
market and good asset quality.
3.3
Variables and Model Estimation
In this study we will examine the traditional asset pricing propositions for our international banking stock portfolios. These include a single factor CAPM, a general three factor Fama and French model and a four factor model augmented for asset quality. The testable versions of three models that will be analysed for each of the twelve portfolios are mathematically represented as follows.
2
NPL/GA is the value of non-performing loans divided by the total value of the loan portfolio (including non performing loans before the deduction of specific loan-loss provisions).
where represents excess stock returns for each value weighted portfolio,
represents market risk premium, SMB [small minus big] represents size premium, HML [high minus low] represents value premium, BdMGd [bad minus good] is the proxy for asset quality premium, while , , and are factor loadings for market, size, value and asset quality premiums respectively. The construction of these variables is explained below.
3.3.1 Excess Portfolio Returns
The excess returns on each of twelve portfolios is the difference between the value weighted portfolio intraday returns and risk free rate. Since Euro is our reference currency, we will use daily effective rate of Euro Overnight Index Average (EONIA) as risk free proxy from 1999 to 2008. EONIA is a reference rate used as benchmark for European money and capital markets and quoted by European central bank.
3.3.2 Market Premium
The market premium is the excess return of market index over risk free EONIA overnight index. As we are using an international portfolio approach we construct a value weighted international index using stock indices of all fourteen European countries and respective market capitalization. An alternate could be to use some MSCI Europe benchmark; however, many banking stocks are not part of such indices. Moreover, it might not be a true representative of the risk return environment in which these banking stocks are traded. Therefore, construction of a value weighted international index from all local indices using their market capitalization is logical. The logarithmic returns for individual country index is calculated and then combined to formulate returns on an international index. Mathematically, the intraday market returns can be represented as
where represents market returns at day t for our international index, indicates the weight of local market index3 vis-à-vis market capitalization and is the daily return on local market index for day t.
3.3.3 Size Premium
The size premium captures the impact of firm size on their respective returns. The intuition behind size premium is simple. Small firms often depict lower financial flexibility and are highly sensitive to business risk conditions as compared to large firms. This result in augmentation of risk for small firms and investors are likely to demand a premium to invest in firms that are relatively smaller in size. In banking stocks, due to inherent business dynamics, the size impact could be even more critical. The equity offers risk absorption capacity against various banking risks and that is primary reason why regulators are sensitive about capital requirements in banking firms. The SMB factor is the difference in average returns of six value weighted portfolios of banking firms with small market capitalization and six portfolios of stocks with big capitalization and hence will be neutral of value and asset quality premiums. A positive SMB would reflect higher returns for small firms over big firms and vice versa. Mathematically, size premium is calculated as
SMB
3.3.4 Value Premium
The HML variable accounts for value premium in stock returns. The factor is relevant as firms with high book to market ratio demonstrated higher returns vis-à-vis firms with low
3
The fourteen local market indices that are used to compute returns for international index includes ATX (Austria), BAS (Belgium), OMXC (Denmark), OMXH 25 (Finland), CAC 40 (France), DAX 30 (Germany), ISEQ (Ireland), MIB (Italy), LuxX (Luxembourg), AEX (Netherlands), IBEX 35 (Spain), OMXS 30 (Sweden), SMI (Switzerland) and FTSE all share (United Kingdom).
book to market ratio. The stocks with high book to market ratio are called value stocks while those with low book to market ratios were termed growth stocks. Fama and French (1992) proposed that value premium is significantly priced in stock returns along with market risk and size premium. The value premium attributes higher returns for value stocks over growth stocks. The value stocks having high book to market ratio are suspected to be firms with distressed characteristics and it would be rational to demand a premium for investment in such stocks. The HML factor is neutral with respect to size and asset quality. This is estimated as the difference between the average returns on four value weighted portfolios with high book to market ratio and four portfolios with low book to market ratio. A positive HML would reflect higher returns for value stocks compared to that of growth stocks and vice versa. The value premium takes the form
HML =
3.3.4 Asset Quality Premium
We propose a bank specific risk factor that would add explanatory power to cross section of returns. As mentioned earlier, asset quality is basic determinant of a bank performance and a vital aspect in credit ratings of a financial institution. The management of asset quality includes the prudence and procedures required by the banks to extend credit. This also includes effective monitoring systems and limits to control credit risk. A sustained asset quality is required for long term survival of a financial institution and banks with low asset quality are likely to face credit and liquidity crunch. Therefore, investors are likely to demand a premium for investing in stocks that have bad asset quality. We measure asset quality by ratio of NPL/GA. A higher ratio will reflect higher proportion of bad loans in total loans and such banks would be considered as ones having a bad asset quality and vice versa. The asset quality premium BdMGd is defined as average returns on six value weighted
portfolios having bad asset quality and six portfolios that depict good asset quality. A positive factor would demonstrate premium returns for firm with bad asset quality as compared to banks having good asset quality. Asset quality factor is sorted on NPL/GA ratio and neutral of size and value factors. The asset quality premium is represented as
BdMGd =
The daily descriptive statistics for twelve mimicking portfolios of size, value and asset quality along with returns on our synthetic index and risk free rate are reported in table 5. For all portfolios, the volatility in returns is increasing over time with maximum standard deviation in 2008 which was a bad year for banking sector. The erosion in fundamentals of banking sector was reflected in their stock returns with average negative returns for the crisis year for all of the twelve portfolios.
[Insert Table 5 about here]
4.
Empirical Results
The regression results for single factor CAPM, three factor Fama and French and asset quality augmented four factors model on size, value and asset quality mimicking portfolios are reported in Table 6, 7 and 8. The single factor CAPM is significant for all twelve portfolios with market risk premium explaining the variation in returns. The maximum explanatory power is for big banks with low book to market and bad asset quality (BLBd)
with an R2 of 78.9%. The minimum explanatory power is demonstrated for small banks with high book to market and good asset quality (SHGd) with an R2of 3.9%. The market risk
premium is positive for all portfolios while intercept is insignificant in all instances indicating that CAPM is able to capture some of the variations for all of our sorted portfolios.
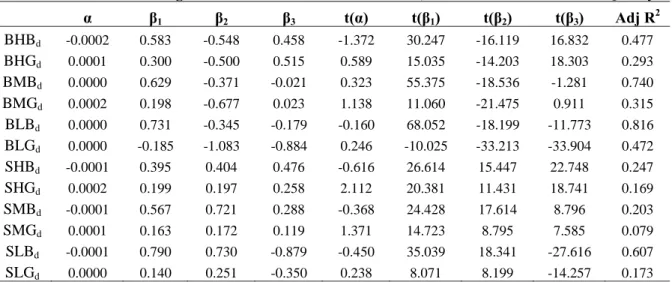
The incremental explanatory power, for all twelve portfolios, has increased for Fama and French three factor model indicating that additional variation is explained by incorporating size and value premium. The adjusted R2 for BLBd portfolio increased to
approximately 82% while that of SHGd increased to 16.9%. The coefficients of market
premium, size and value factors are significant for all portfolios except big banks with medium book to market and bad asset quality (BMBd) where we could not find evidence for
value premium. The signs of coefficients are consistent with size and value fallacy with positive SMB coefficient for small stocks (SHBd, SHGd , SMBd, SMGd, SLBd, SLGd) and negative for big stocks (BHBd, BHGd, BMBd, BMGd, BLBd, BLGd). Similarly, we report negative HML coefficients for low book to market stocks (SLBd, SLGd, BLBd, BLGd) and a positive value factor for high book to market stocks (BHBd, BHGd, SHBd, SHGd). These results clearly indicate that size and value premia are priced in banking stocks in addition to the market risk premium.
[Insert Table 7 about here]
The results for four factor model augmented by asset quality are even more encouraging with maximum adjusted R2 of 85% for BLBd portfolio and a minimum of 13.5%
for SMGd. For all twelve portfolios, we observe a substantial increase in explanatory power
with increase in adjusted coefficient of variation. All intercepts were insignificant reflecting a valid specification for expected returns. The coefficients on all four risk premia were significant and we observe a significant value coefficient for BMBd which was insignificant in
three factor model. The signs of the coefficients are also consistent with presence of asset quality premium with positive BdMGd factor for banks with bad asset quality (BHBd, BMBd, BLBd, SHBd, SMBd, SLBd) and negative with good asset quality (BHGd BMGd BLGd SHGd SMGd SLGd).
It is notable that for all three time series models the R2 increases from small banks to large banks. This was expected because the large banks are more actively traded than small banks and market wide factors are more likely to influence the active stocks. The inclusion of asset quality premium increase the explanatory power of all portfolios, however, for small size banks it is interesting to note that the increase is phenomenal and we observe a significant increase in R2 vis-à-vis big banks. This implies that although asset quality is vital for all banks, an increase in infected portfolio has devastating impact for small banks. This is logical as banks with smaller equity base would find it difficult to absorb the loan losses emanating from a deteriorating asset quality. Lastly, as mentioned earlier small less active stocks are more likely to be influenced by firm specific factors and asset quality is the most critical of the bank specific risk factors. . These results clearly propose that in case of banking stocks, the variation in returns is jointly explained by market, size, value and a banking unique factor of asset quality.
5. Conclusion
This paper attempts to explain the behaviour of exchange rate adjusted returns of banking stocks from fourteen European countries under traditional asset pricing framework of CAPM and Fama and French three factors model. Given the unique business and financial risk of banking stocks we propose to augment the traditional size and value factors model by including an asset quality premium. The selected banking stocks were sorted into twelve portfolios at the interaction of size, value and asset quality factors. Our empirical results provide evidence that augmented four factor model explain maximum variation in stock returns of banking stocks. Moreover, small banks with their limited scale are more sensitive to deterioration in asset quality with limited cushion to absorb loan losses.
These results have policy implications for investors in specific and regulators in general. The investment in financial stocks should take into account the asset quality of the
credit portfolio of these institutions. Banks with higher infection are likely to face pressure on their spreads with reduced interest revenues. Simultaneously, the loan loss provisions will increase the non interest expense affecting the overall profitability of the bank and ultimately the impact will be absorbed in equity thus reducing the risk absorption capacity. Since, this treatment of credit infection is unique to banking firms, the investment in financial stocks warrants the pricing of asset quality.
Moreover, with deregulation in financial sector, the regulators under Basle II framework focus on market discipline to evaluate and control risk taking behaviour of banking firms. To implement such market based measures, it is critical to understand the risk factors that are priced in banking equities and among all such factors we propose the fundamental relevance of asset quality premium.
References
Agusman, A., Monroe, G.S., Gasbarro, D., Zumwalt, J.K., 2008. “Accounting and Capital Market Measures of Risk: Evidence from Asian Banks during 1998-2003,” Journal of Banking & Finance, 32, pp. 480-488.
Ahmed, A. S., Takeda, C., Thomas, S., 1999. “Bank Loan Loss Provisions: A Reexamination of Capital Management, Earnings Management and Signaling Effects,” Journal of Accounting and Economics, 28, pp. 1-25.
Bae, S. C., 1990. “Interest Rate Changes and Common Stock Returns of Financial Institutions: Revisited,” Journal of Financial Research, 13, pp. 71-79.
Banz, R. W., 1981. "The Relationship between Return and Market Value of Common Stocks", Journal of Financial Economics, 9(1), pp. 3 – 18.
Barber, B. and Lyon, J., 1997. "Detecting long-horizon abnormal stock returns: the empirical power and specification of test statistics", Journal of Financial Economics, 43(3), pp. 341-72.
Basu, S., 1977. “Investment Performance of Common Stocks in Relation to their Price-Earnings Ratios: A Test of Efficient market Hypothesis”, Journal of Finance, 32(3), pp. 663-682.
Beaver, W., Eger, C., Ryan., S., Wolfson, M., 1989. “Financial Reporting, Supplemental Disclosures, and Bank Share Prices,” Journal of Accounting Research, 27, pp. 157-178.
Choi, J. J., Elyasiani, E and Kopecky, K. J., 1992. “The Sensitivity of Bank Stock Returns to Market, Interest and Exchange Rate Risks”, Journal of Banking and Finance, 16, pp. 983-1004.
Cooper, M. J., Jackson III W. E. and Patterson G.A., 2003. “Evidence of Predictability in the cross-section of Bank Stock Returns,” Journal of Banking and Finance, 27, pp. 817-850.
Dinenis, E., and Staikouras, S. K., 1998. “Interest Rate Changes and Common Stock Returns of Financial Institutions: Evidence from the United Kingdom,” European Journal of Finance, 4, pp. 113-127.
Docking, D.S., Hirschey, M., Jones, E., 2000. “Reaction of Bank Stock Prices to Loan Loss Reserve Announcements,” Review of Quantitative Finance and Accounting, 15, pp. 277-297.
Elyasiani, E, and Mansur, I., 1998. “Sensitivity of the Bank Stock Returns Distribution to Changes in the Level and Volatility of Interest Rate: A GARCH-M model,” Journal of Banking & Finance, 22, pp. 535-563.
Fama, E. and French, K., 1992. “The Cross-Section of Expected Stock Returns”, Journal of Finance, 47(2), pp. 427–465.
Fama, E. and French, K., 1993. “Common Risk Factors in the Returns on Stocks and Bonds”, Journal of Financial Economics, 33(1), pp. 3–56.
Fama, E. and French, K., 1995. “Size and Book-to-Market Factors in Earnings and Returns”, Journal of Finance, 50(1), pp. 131–155.
Fama, E. and Schwert, G., 1977. "Asset returns and inflation," Journal of Financial Economics, 5(2), pp. 115-146.
Flannery, M. J., and James, C., 1984. “The Effect of Interest Rate Changes on the Common Stock Returns of Financial Institutions,” Journal of Finance, 39(4), pp. 1141-1153.
Flannery, M. J., Hameed, A. S. and Harjes, R. H., 1997, “Asset Pricing, Time-varying Risk Premia and Interest Rate Risk,” Journal of Banking and Finance, 21, pp. 315-35.
Fletcher, J., 2000. “On the Conditional Relationship between Beta and Return in International Stock Markets,” International Review of Financial Analysis, 9, pp. 235-245.
Griffin, P.A., Wallach, S.J.R., 1991. “Latin American Lending by Major US banks: The Effects of Disclosures about Nonaccrual Loans and Loan Loss Provisions,” The Accounting Review, 66, pp. 830-846.
Hatfield, G., Lancaster, C., 2000. “The Signaling Effects of Bank Loan Loss Reserve Additions,” Journal of Financial and Strategic Decisions, 13, pp. 57-73.
Lintner, J., 1965. “The Valuation of Risk Assets and the Selection of Risky Investments in Stock Portfolios and Capital Budgets”, Review of Economics and Statistics, 47, pp. 13 – 37.
Mossin, J., 1966. “Equilibrium in a Capital Asset Market”, Econometrica, 34, pp. 768 – 783.
Neuberger, J. A., 1993. “Interest Rate Risk at US Commercial Banks,” Federal Reserve Bank San Francisco, Weekly Letters 1993.
Stone, B. K., 1974. Systematic Interest Rate Risk in a Two Index Model of Returns, Journal of Financial and Quantitative Analysis, 9, pp. 709-721.
Viale, A., Kolari, J. and Fraser, D., 2009. “Common Risk Factors in Bank Stocks”, Journal of Banking & Finance, 33(3), pp. 464 – 472.
Yourougou, P., 1990. “Interest Rate Risk and the Pricing of Depository Financial Intermediary Common Stock,” Journal of Banking and Finance, 14, pp. 803-20.
Figure 1: Portfolio Construction Procedure
Market Capitalization Book to Market Asset Quality Portfolios
Big MV
High B/M
Bad Asset Quality BHBd
Good Asset Quality BHGd
Medium B/M
Bad Asset Quality BMBd
Good Asset Quality BMGd
Low B/M
Bad Asset Quality B/LBd
Good Asset Quality BLGd
Small MV
High B/M
Bad Asset Quality SHBd
Good Asset Quality SHGd
Medium B/M
Bad Asset Quality SMBd
Good Asset Quality SMGd
Low B/M
Bad Asset Quality SLBd
Table 1: Country Wise Statistics (No of Firms) 1999 – 2008 Country 1999 2000 2001 2002 2003 2004 2005 2006 2007 2008 Austria 4 4 4 5 7 11 9 9 9 10 Belgium 3 3 5 7 9 7 11 11 10 7 Denmark 12 13 15 18 19 19 21 21 23 24 Finland 3 5 5 6 8 9 5 5 4 4 France 7 9 11 15 17 17 17 15 18 21 Germany 9 11 14 14 17 11 16 29 29 29 Ireland 6 9 12 12 16 15 15 15 14 15 Italy 12 13 15 15 10 10 12 15 15 14 Luxembourg 3 3 3 3 3 4 4 8 11 10 Netherlands 4 4 4 4 5 11 11 13 15 13 Spain 9 7 7 12 15 15 15 17 19 21 Sweden 11 11 11 11 13 13 12 14 11 11 Switzerland 13 15 15 16 18 19 22 22 23 25 United Kingdom 17 19 22 22 27 25 25 26 27 29 Total 113 126 143 160 184 186 195 220 228 233
Table 2: Country Wise Firm Statistics (Size - MV of Equity)
1999 2000 2001 2002 2003 2004 2005 2006 2007 2008
Average Median Average Median Average Median Average Median Average Median Average Median Average Median Average Median Average Median Average Median
Austria 632.4 445.4 721.4 456.7 828.2 531.9 965.3 539.9 1297.3 550.0 1853.4 520.0 3029.1 625.0 5233.8 836.5 4848.9 1190.7 1577.0 764.2 Belgium 9657.2 12432.1 10748.4 13302.0 16786.6 14806.6 11445.7 8985.6 12255.0 11287.4 16069.8 17272.1 21345.4 21173.3 24900.0 24125.9 23388.5 20152.4 4005.6 4345.7 Denmark 227.8 17.8 462.1 19.7 437.6 23.4 395.5 29.3 483.9 55.8 574.0 69.7 768.1 97.7 961.3 155.4 783.6 134.0 215.3 37.4 Finland 146.6 146.6 286.5 286.5 289.0 289.0 298.3 298.3 383.7 383.7 446.5 446.5 994.2 994.2 1080.6 1080.6 1138.6 1138.6 846.8 846.8 France 4265.0 104.2 4766.7 141.7 5761.3 139.4 4033.7 146.7 5549.7 214.4 6074.0 268.7 7035.3 247.3 9975.3 315.2 8473.6 322.8 3151.4 157.5 Germany 12761.7 2602.3 9646.0 1455.3 7084.8 1385.5 3838.3 1311.2 5671.6 1056.0 4852.2 1467.4 6609.6 1186.1 7667.3 651.4 9152.0 2625.9 2350.3 245.5 Ireland 9932.5 9932.5 9100.6 9100.6 10474.5 10474.5 11866.3 11866.3 10260.1 10260.1 11461.2 11461.2 13624.7 13624.7 17126.3 17126.3 14615.1 14615.1 5380.3 5380.3 Italy 4088.4 1049.4 4967.4 1248.2 3886.9 1443.5 3470.3 1327.9 4218.0 1618.3 4640.7 2057.7 7477.0 2660.0 9137.8 3099.0 11396.0 3121.7 5252.4 1735.9 Luxembourg 669.9 669.9 836.7 836.7 761.4 761.4 775.0 775.0 751.7 751.7 900.7 900.7 1077.8 1077.8 1322.0 1322.0 1938.1 1938.1 1053.0 1053.0 Netherlands 355.3 355.3 461.2 461.2 422.3 422.3 409.7 409.7 388.4 388.4 398.1 398.1 673.2 673.2 1064.9 1064.9 1215.4 1215.4 1258.1 1258.1 Spain 10452.7 3652.4 13854.0 2650.7 11316.0 2730.9 8182.5 2277.1 10778.6 2950.5 13397.1 4117.8 16063.7 5195.2 20763.3 7529.6 20277.8 6985.0 10406.7 3494.8 Sweden 8229.2 7580.4 13603.4 10604.8 11315.9 9603.1 7822.2 6974.8 10749.2 9289.3 12620.1 10685.2 15293.2 13062.1 17948.1 14463.9 16575.7 12810.9 7552.4 6283.1 Switzerland 271.9 177.6 267.9 152.7 269.5 117.6 277.8 106.5 298.3 94.7 325.0 122.5 378.5 152.4 418.4 164.2 472.8 180.3 427.5 160.7 United Kingdom 48845.0 39701.6 69242.0 62604.4 68994.6 68168.7 53665.4 40628.6 64750.8 49492.5 66911.3 55081.5 59883.0 48922.4 56678.2 47078.3 48643.7 39457.4 26549.5 17438.3
Table 3: Country Wise Firm Statistics (Book to Market )
1999 2000 2001 2002 2003 2004 2005 2006 2007 2008
Average Median Average Median Average Median Average Median Average Median Average Median Average Median Average Median Average Median Average Median
Austria 0.87 0.64 1.29 0.80 1.26 0.71 1.24 0.71 1.38 0.77 1.55 0.72 1.24 0.90 1.30 0.93 1.26 0.77 1.33 0.85 Belgium 2.36 0.42 3.43 0.42 2.83 0.51 1.87 0.69 1.43 0.93 1.51 0.85 1.36 0.71 1.37 0.60 1.33 0.53 1.95 1.22 Denmark 1.27 1.27 1.34 1.29 1.22 1.16 1.23 1.20 1.01 1.00 0.82 0.83 0.66 0.67 0.58 0.61 0.53 0.56 0.89 0.90 Finland 0.88 0.88 0.85 0.85 0.79 0.79 0.66 0.66 0.84 0.84 0.68 0.68 0.68 0.68 0.61 0.61 0.53 0.53 0.61 0.61 France 1.25 1.15 1.15 1.11 0.92 0.95 1.01 0.95 1.24 1.28 1.11 1.22 1.37 1.41 1.40 1.49 1.33 1.64 2.36 2.78 Germany 0.75 0.69 0.55 0.52 0.61 0.74 0.99 1.00 1.36 1.25 0.98 0.97 0.76 0.68 0.48 0.56 0.46 0.47 0.65 0.59 Ireland 0.36 0.37 0.51 0.50 0.38 0.35 0.34 0.33 0.41 0.42 0.42 0.46 0.40 0.42 0.44 0.51 0.45 0.44 1.07 1.14 Italy 0.57 0.54 0.66 0.60 0.69 0.62 0.81 0.66 0.79 0.76 0.74 0.69 0.72 0.76 0.67 0.63 0.68 0.65 1.10 1.10 Luxembourg 0.65 0.65 0.21 0.21 0.10 0.10 0.06 0.06 0.12 0.12 0.16 0.16 0.27 0.27 0.54 0.54 0.48 0.48 0.96 0.96 Netherlands 0.36 0.36 0.37 0.37 0.44 0.44 0.48 0.48 0.61 0.61 0.62 0.62 0.61 0.61 0.45 0.45 0.55 0.55 0.60 0.60 Spain 0.39 0.40 0.46 0.45 0.50 0.49 0.49 0.49 0.52 0.53 0.49 0.49 0.49 0.48 0.44 0.46 0.46 0.43 0.71 0.69 Sweden 0.51 0.51 0.51 0.51 0.55 0.58 0.64 0.65 0.80 0.79 0.67 0.65 0.64 0.64 0.59 0.60 0.56 0.55 0.93 0.92 Switzerland 1.24 0.84 2.08 0.85 1.70 0.88 1.85 0.73 2.30 0.90 0.79 0.78 5.02 0.74 4.75 0.60 4.68 0.55 4.78 0.66 United Kingdom 0.27 0.29 0.46 0.44 0.40 0.40 0.42 0.44 0.49 0.50 0.51 0.52 0.48 0.52 0.55 0.50 0.62 0.57 1.19 0.94
Table 4: Country Wise Firm Statistics Firm (Non Performing Advances to Gross Finances)
Country 1999 2000 2001 2002 2003 2004 2005 2006 2007 2008 Average Median Average Median Average Median Average Median Average Median Average Median Average Median Average Median Average Median Average Median
Austria 2.20 1.91 2.40 1.85 3.10 3.13 2.79 1.91 2.86 0.97 2.32 2.07 2.21 1.78 2.13 2.24 2.12 1.17 3.93 3.28 Belgium 2.35 2.50 2.80 2.12 2.90 1.97 3.00 1.98 2.60 2.10 2.61 2.49 2.67 2.17 1.89 1.65 1.90 1.63 1.53 0.95 Denmark 0.70 0.35 0.90 0.50 4.39 0.92 1.50 1.07 1.42 1.06 1.36 1.07 1.40 1.00 0.96 0.62 0.65 0.61 2.46 0.92 Finland 0.60 0.50 0.60 0.50 1.31 0.41 1.93 0.44 1.42 0.41 1.44 0.45 3.78 0.65 1.94 0.55 0.54 0.50 0.95 0.94 France 5.12 4.97 5.65 5.12 6.72 5.21 6.51 4.82 7.14 6.77 6.22 5.10 4.39 3.87 4.27 3.49 4.19 3.36 4.40 3.21 Germany 4.70 3.35 4.60 3.20 3.46 3.13 4.85 4.30 4.19 4.15 4.99 3.71 6.30 3.33 3.33 2.43 3.16 2.16 2.94 2.15 Ireland 1.00 0.37 0.97 0.40 0.92 0.90 0.91 0.91 0.76 0.74 0.72 0.62 0.97 0.78 0.89 0.87 0.77 0.76 2.32 1.31 Italy 2.51 1.87 2.35 1.59 2.39 1.60 5.99 1.78 1.95 2.20 10.48 3.19 4.41 4.02 4.45 3.58 4.85 3.45 5.93 4.15 Luxembourg 2.85 2.11 2.97 2.53 3.15 3.31 3.37 3.80 2.74 2.80 2.48 2.36 2.28 1.81 1.49 1.28 3.86 0.46 3.34 1.66 Netherlands 1.80 1.35 2.33 1.73 1.77 1.20 3.77 1.89 1.48 1.65 1.28 1.37 1.51 1.51 1.85 1.43 1.40 1.12 1.94 1.79 Spain 1.20 0.98 1.90 0.73 4.32 2.70 3.75 1.90 3.93 3.72 1.49 0.95 1.21 0.80 1.06 0.67 1.88 0.93 3.70 2.98 Sweden 1.60 1.65 1.50 1.92 2.37 1.08 2.73 0.72 3.26 0.76 2.74 0.51 2.94 1.09 3.09 0.92 1.86 0.83 1.60 1.25 Switzerland 4.10 3.97 2.30 1.97 1.86 2.36 1.95 1.41 3.31 1.83 3.11 1.88 2.71 1.73 2.47 1.55 2.19 1.32 1.58 1.14 United Kingdom 2.50 1.27 2.60 1.90 3.12 2.51 6.88 3.28 8.18 2.70 3.73 1.71 2.21 0.86 2.45 1.16 2.76 1.17 3.42 2.44
Table 5: Descriptive Statistics of Returns (1999 - 2008)
Year BHBd BHGd BMBd BMGd BLBd BLGd SHBd SHGd SMBd SMGd SLBd SLGd Index Risk Free
Mean 1999 0.029% 0.032% 0.052% 0.035% 0.044% -0.003% 0.036% 0.005% 0.016% 0.008% 0.068% 0.046% 0.076% 0.011% 2000 0.000% 0.083% 0.035% -0.012% 0.039% 0.055% 0.056% 0.037% 0.020% 0.001% 0.027% 0.011% -0.030% 0.016% 2001 -0.063% 0.011% -0.042% 0.040% -0.028% -0.048% 0.008% 0.049% -0.042% 0.016% -0.011% -0.082% -0.054% 0.017% 2002 -0.022% 0.032% -0.034% 0.010% -0.070% -0.065% -0.034% 0.041% 0.003% 0.022% -0.191% -0.040% -0.125% 0.013% 2003 0.085% 0.094% 0.089% 0.141% 0.059% 0.101% 0.042% 0.142% 0.074% 0.130% 0.062% 0.016% 0.060% 0.009% 2004 0.046% 0.152% 0.049% 0.075% 0.050% 0.110% 0.058% 0.071% 0.049% 0.067% 0.033% 0.048% 0.053% 0.008% 2005 0.083% -0.047% 0.092% 0.108% 0.068% 0.164% 0.036% 0.042% 0.080% 0.104% 0.003% 0.099% 0.069% 0.008% 2006 0.057% 0.041% 0.086% 0.058% 0.096% 0.147% 0.025% 0.053% 0.024% 0.087% 0.009% 0.064% 0.066% 0.011% 2007 -0.055% -0.025% -0.081% -0.023% -0.047% -0.055% -0.069% -0.016% -0.024% -0.053% -0.120% -0.011% -0.012% 0.015% 2008 -0.337% -0.165% -0.198% -0.117% -0.200% -0.123% -0.270% -0.194% -0.292% -0.213% -0.146% -0.085% -0.155% 0.016% Median 1999 0.001% 0.002% 0.033% 0.000% 0.002% -0.007% 0.026% -0.002% 0.036% 0.023% 0.128% -0.008% 0.115% 0.010% 2000 -0.001% 0.049% 0.043% -0.004% 0.119% 0.014% 0.008% 0.035% -0.003% 0.040% 0.022% 0.023% 0.012% 0.017% 2001 -0.034% 0.031% 0.021% 0.071% 0.062% 0.051% 0.012% 0.048% 0.001% 0.003% 0.013% -0.019% -0.011% 0.017% 2002 0.001% 0.042% 0.015% 0.023% -0.044% 0.000% -0.062% 0.023% 0.007% 0.022% -0.070% -0.057% -0.136% 0.013% 2003 0.016% 0.049% 0.108% 0.058% 0.042% 0.053% 0.041% 0.087% 0.096% 0.088% 0.001% 0.003% 0.045% 0.008% 2004 0.043% 0.063% 0.062% 0.071% 0.073% 0.080% 0.054% 0.051% 0.059% 0.032% 0.020% 0.020% 0.071% 0.008% 2005 0.099% -0.013% 0.063% 0.151% 0.061% 0.066% 0.026% 0.040% 0.000% 0.098% 0.030% 0.045% 0.086% 0.008% 2006 0.123% 0.064% 0.176% 0.115% 0.127% 0.180% 0.015% 0.040% 0.029% 0.112% -0.010% 0.066% 0.181% 0.011% 2007 -0.008% 0.000% -0.036% -0.003% 0.017% 0.025% -0.055% -0.007% 0.000% -0.013% -0.134% 0.000% 0.085% 0.015% 2008 -0.406% -0.054% -0.280% -0.094% -0.223% -0.055% -0.177% -0.137% -0.338% -0.114% -0.114% -0.037% -0.110% 0.016% Standard Deviation 1999 0.579% 1.214% 0.792% 0.735% 0.991% 1.028% 0.259% 0.227% 0.471% 0.257% 1.218% 1.421% 0.889% 0.001% 2000 0.673% 0.716% 0.549% 0.945% 0.792% 1.082% 0.689% 0.283% 0.619% 0.306% 1.438% 0.941% 1.006% 0.002% 2001 1.100% 0.772% 0.816% 0.859% 1.092% 1.162% 1.345% 0.292% 1.033% 0.423% 2.204% 0.777% 1.196% 0.002% 2002 1.586% 0.819% 0.932% 0.629% 1.407% 1.305% 0.743% 0.207% 0.876% 0.660% 1.726% 0.595% 1.489% 0.001% 2003 0.891% 0.671% 0.888% 0.842% 0.748% 1.015% 0.494% 0.436% 1.346% 0.361% 1.867% 0.500% 1.051% 0.001% 2004 0.457% 1.033% 0.481% 0.700% 0.458% 0.638% 0.465% 0.336% 0.660% 0.342% 0.484% 0.526% 0.612% 0.001% 2005 0.431% 0.982% 0.473% 0.531% 0.485% 1.081% 0.257% 0.407% 0.746% 0.330% 0.000% 0.708% 0.514% 0.001% 2006 0.603% 0.851% 0.813% 1.060% 0.726% 1.115% 0.419% 0.485% 0.819% 0.406% 0.638% 0.751% 0.780% 0.001% 2007 0.829% 1.137% 1.077% 0.872% 1.018% 0.855% 0.432% 0.458% 0.702% 0.593% 1.371% 0.531% 0.976% 0.001% 2008 2.516% 1.335% 1.686% 1.329% 1.766% 0.914% 0.973% 0.833% 2.163% 0.694% 2.107% 0.520% 1.520% 0.001%
Table 6: Single Factor (CAPM) Regression on Portfolios Sorted for Size, Book to Market and Asset Quality α β1 t(α) t(β1) R2 BHBd -0.0001 0.588 -0.696 34.965 0.325 BHGd 0.0002 0.278 0.959 15.991 0.091 BMBd 0.0001 0.723 1.018 77.584 0.703 BMGd 0.0003 0.352 1.839 23.425 0.178 BLBd 0.0001 0.862 0.596 97.374 0.789 BLGd 0.0003 0.314 1.351 16.942 0.102 SHBd -0.0002 0.169 -1.215 13.282 0.065 SHGd 0.0001 0.082 1.452 10.127 0.039 SMBd -0.0002 0.317 -1.064 16.732 0.099 SMGd 0.0001 0.090 0.958 10.348 0.040 SLBd -0.0002 0.857 -0.855 39.394 0.379 SLGd 0.0000 0.176 -0.030 12.361 0.057
Table 7: Three Factor Regression on Portfolios Sorted for Size, Book to Market and Asset Quality
α β1 β2 β3 t(α) t(β1) t(β2) t(β3) Adj R2 BHBd -0.0002 0.583 -0.548 0.458 -1.372 30.247 -16.119 16.832 0.477 BHGd 0.0001 0.300 -0.500 0.515 0.589 15.035 -14.203 18.303 0.293 BMBd 0.0000 0.629 -0.371 -0.021 0.323 55.375 -18.536 -1.281 0.740 BMGd 0.0002 0.198 -0.677 0.023 1.138 11.060 -21.475 0.911 0.315 BLBd 0.0000 0.731 -0.345 -0.179 -0.160 68.052 -18.199 -11.773 0.816 BLGd 0.0000 -0.185 -1.083 -0.884 0.246 -10.025 -33.213 -33.904 0.472 SHBd -0.0001 0.395 0.404 0.476 -0.616 26.614 15.447 22.748 0.247 SHGd 0.0002 0.199 0.197 0.258 2.112 20.381 11.431 18.741 0.169 SMBd -0.0001 0.567 0.721 0.288 -0.368 24.428 17.614 8.796 0.203 SMGd 0.0001 0.163 0.172 0.119 1.371 14.723 8.795 7.585 0.079 SLBd -0.0001 0.790 0.730 -0.879 -0.450 35.039 18.341 -27.616 0.607 SLGd 0.0000 0.140 0.251 -0.350 0.238 8.071 8.199 -14.257 0.173
Table 8: Four Factor Regression on Portfolios Sorted for Size, Book to Market and Asset Quality α β1 β2 β3 β4 t(α) t(β1) t(β2) t(β3) t(β4) Adj R2 BHBd 0.0000 0.088 -0.931 0.378 1.031 -0.275 4.287 -31.742 17.152 36.887 0.660 BHGd 0.0000 0.575 -0.286 0.559 -0.574 -0.031 23.034 -8.028 20.859 -16.886 0.365 BMBd 0.0001 0.397 -0.551 -0.058 0.483 1.400 29.974 -29.133 -4.068 26.823 0.797 BMGd 0.0001 0.266 -0.624 0.034 -0.142 0.970 11.312 -18.583 1.345 -4.449 0.320 BLBd 0.0001 0.530 -0.500 -0.211 0.418 0.747 41.396 -27.333 -15.318 23.972 0.850 BLGd 0.0000 0.014 -0.929 -0.852 -0.415 -0.244 0.582 -27.493 -33.561 -12.884 0.505 SHBd 0.0000 0.322 0.348 0.465 0.152 -0.399 16.542 12.512 22.220 5.717 0.256 SHGd 0.0001 0.292 0.269 0.273 -0.193 1.728 23.177 14.945 20.211 -11.276 0.208 SMBd 0.0000 0.242 0.470 0.236 0.677 0.273 8.338 11.328 7.569 17.140 0.285 SMGd 0.0001 0.281 0.264 0.138 -0.246 0.922 19.813 12.991 9.029 -12.733 0.135 SLBd 0.0001 0.291 0.343 -0.960 1.041 0.629 11.340 9.367 -34.857 29.840 0.709 SLGd -0.0001 0.442 0.485 -0.301 -0.629 -0.588 21.010 16.139 -13.328 -21.960 0.305