Are Star Funds Really Shining?
Cross-Trading and Performance Shifting in
Mutual Fund Families
Alexander Eisele, Tamara Nefedova, Gianpaolo Parise
⇤April 17, 2016
Abstract
We employ transaction data to examine trades between funds affiliated to the same institution. We show that such cross-trades exhibit an average mispricing of 0.18% compared to open market trades. This deviation is greater during times of high financial uncertainty, when the exchanged stocks are illiquid and highly volatile, and when the asset manager has weak governance and large internal markets. We use an exogenous increase in regulatory scrutiny to establish causal-ity. Our results are consistent with theoretical models of internal capital markets in which the headquarters actively favors its ‘stars’ at the expense of its least valuable units.
⇤Eisele is at the Swiss Finance Institute and the University of Lugano, Nefedova is at the Universit´e
Paris-Dauphine, and Parise is at the Bank for International Settlements. A part of this paper was written while Nefedova was at NYU Stern School of Business and Parise was a visitor at Harvard Business School. We are thankful for suggestions and useful comments to Giovanni Barone-Adesi, Utpal Bhattacharya, John Camp-bell, Hans Degryse, Ben Cohen, Truong Duong, Inh Tran Dieu, R¨udiger Fahlenbrach, Francesco Franzoni, Laurent Fr´esard, Rajna Gibson, Robin Greenwood, Harald Hau, Terrence Hendershott, Augustin Landier, Eric Nowak, Kim Peijnenburg, Alberto Plazzi, Sofia Ramos, Christian Upper, David Schumacher, Suresh Sundaresan, Youchang Wu and participants of seminars at Harvard Business School, the Bank for Interna-tional Settlements, the Universit´e Paris-Dauphine, the EFA 2015 meeting in Vienna, the AFA 2014 meeting in Philadelphia, the Swiss Winter Conference on Financial Intermediation, the AFFI 2013 and 2015 meetings, the EFMA 2013 meeting in Reading, the Lugano Corporate Finance 2012 workshop, the Gerzensee doctoral seminar, the Geneva conference on Liquidity and Arbitrage Trading 2012. We are also grateful to several practitioners for valuable information on industry practices. We acknowledge financial support from the Swiss National Science Foundation and the Swiss Finance Institute. Contact at: [email protected]
The majority of financial trades takes place in open and highly regulated markets. As an alternative venue, large asset managers sometimes o↵set the trades of affiliated funds in an
internal market, without relying on external facilities or supervision.1 Rule 17a-7 of the U.S.
Investment Company Act permits such “cross-trades” under conditions of fair valuation of the assets and equal treatment of both trading parties. In principle, these transactions are assumed to benefit the final investor as they limit transaction costs and commissions. Recent anecdotal evidence, however, warns that this might not always be the case. For instance, Pimco is believed to have absorbed flow-induced asset selling through in-house funds when Bill Gross left the firm, while Western Asset Management allegedly transferred $6.2 million
to top funds by systematically pricing cross-transactions at the highest bid price available.2
In this article, we explore how cross-trades are priced and what the rationale for relying on such o↵-exchange transactions is. The task of investigating cross-trades presents an empirical challenge: most of institutional investors are obliged to disclose their holdings at a quarterly frequency only, which makes it impossible to distinguish cross-trades from trades executed in opposite directions but with external counterparties. To the best of our knowledge, this paper represents the first attempt to correctly identify such cross-trades using transaction-level data.
We conduct four sets of empirical tests in order to gain a greater insight on cross-trades. First, we explore how cross-trades are priced compared to open market trades. The rationale of allowing cross-trades to benefit investors suggests that the spread between the execution price of the trade and the market price of the stock at the moment of the transaction (hereafter referred to as the execution shortfall ) is lower for cross-trades since transaction costs are
1Around 40% of all U.S. stock trades are today executed outside of public exchanges. See, e.g.,
Comerton-Forde and Putni¸nˇs (2015), Degryse, De Jong, and Van Kervel (2015), and Buti, Rindi, and Werner (2015).
2See “Pimco May Have Averted Fire Sale After Gross’s Exit,” Bloomberg - June 11, 2015 and Security and
Exchange Commission administrative proceeding No. 3-15688 of January 27, 2014. More generally, a recent Financial Times article reported a number of comments by industry participants on dubious cross-trading practices including the following: “I’m aware that (illegal cross-trading) happens, generally in equity funds but not always. I suspect it’s quite widespread” and “It has happened many times in the past, often in times of market pressure (...). In 2008 it was one way to ensure that prime money market funds would be protected”, see “No Surprise at Backroom Dealing Charge” Financial Times - December 16, 2012.
minimized. Counter to this intuition, we find that cross-trades exhibit an execution shortfall that is 18 basis points higher than that of trades executed in the open market after controlling for the size of the trade and stock, time, and fund-family fixed e↵ects. This mispricing reallocates performance between the two parties involved in the trade (e.g., one fund buys at a discount from one of its siblings).
Second, we explore the characteristics and the timing of trades. We find that cross-trades executed in times characterized by high uncertainty in the markets and in illiquid and highly volatile stocks are more severely mispriced. Additionally, we find evidence which suggests that a significant fraction of cross-trades is backdated. Lower regulatory scrutiny on cross-trading activity compared to open market trades could in principle allow institutions to arbitrarily set ex post the execution price of the cross-trade at the price of the day at which the greatest performance would have been reallocated among trading counterparties. Consistent with this hypothesis, we show that cross-trades are significantly more likely than open market trades to be executed exactly at the highest or lowest price of the day.
Third, we investigate how the execution shortfall correlates with fund family character-istics. Our null hypothesis is that family characteristics are irrelevant in explaining how cross-trades are priced. If, however, cross-trades were used to shift performance in an op-portunistic way, we should find a higher execution shortfall within families for which agency problems are more relevant – namely, fund-families in which governance is weak and family incentives diverge from investors’ interests (Massa (2003), Nanda, Wang, and Zheng (2004), Chuprinin, Massa, and Schumacher (2015)). Exploring the cross-section of cross-trades, we find that the execution shortfall is significantly higher for cross-trades executed in families in which governance is weak, there are a high number of siblings and some funds are significantly
more expensive than others.3
Finally, we explore how cross-trading activity a↵ects the di↵erence in performance
be-3A high number of affiliated funds creates incentives for tournament behavior (Brown, Harlow, and Starks
(1996), Kempf and Ruenzi (2008)) and allows a fund family to transfer performance via cross-trades in a large internal market, while families with high heterogeneity in funds’ importance are those with the strongest incentives to reallocate performance (see Gaspar, Massa, and Matos (2006)).
tween “star” and “junk” funds (i.e., sibling funds of relatively high/low importance from a fund family perspective). Building on previous theoretical work on internal capital markets we can formulate two opposing hypotheses. In one scenario, mutual fund complexes may work as “socialist conglomerates” in which strong divisions end up subsidizing weak ones (Stein and Scharfstein (2000)). If this is true, powerful managers of poorly performing funds may force star funds to engage in inefficient cross-subsidization via badly priced cross-trades. The resulting outcome would be performance smoothing across di↵erent funds within the same fund family.
In the other scenario, the corporate headquarters of a multi-division company has control rights which enables it to engage in “winner-picking” – to actively shift resources to few successful projects (Stein (1997)). Similarly, fund families may use cross-trades to allocate extra performance to a number of popular or expensive funds. A large body of research on mutual funds suggests that outperformers, while attracting disproportionate inflows to
themselves,4 also have positive spillover e↵ects on the other siblings in the family (Nanda,
Wang, and Zheng (2004), Brown and Wu (2015)). This would make it potentially optimal from a family perspective to penalize less important funds in order to inflate the returns of their star funds. In line with the latter scenario, we show that the performance benefit to star funds is directly related to the extent of cross-trading activity and is accrued at the expense of junk funds.
In this paper, we make two main contributions to the existing literature. First, to the best of our knowledge this is the first paper providing direct evidence on the pricing and characteristics of actual cross-trades. The use of cross-trades is pervasive in the mutual fund industry, and recently regulators have decided to allow exemptions for cross-trading in
other industries as well.5 Therefore, a study on cross-trading activity not only improves our
understanding of incentives at the fund-family level, but also serves to provide wider policy
4There is abundant evidence that outperformers attract greater inflows, e.g., Chevalier and Ellison (1997),
Sirri and Tufano (1998), Agarwal, Gay, and Ling (2014).
5See, e.g., the cross-trading exemptions under section 408(b)(19) added to ERISA on August 17, 2006 by
implications. Our paper is the first to show that cross-trades are significantly mispriced and potentially backdated. Tying trade level data to fund performance, we find that cross-trading appears to boost the risk-adjusted performance of star funds by around 1.7% per year on average (causing an equivalent loss for the least important funds). This result, in turn, casts doubt on the fraction of performance delivered by mutual funds that is truly due to investment skill.6
Second, we show that the introduction of tighter supervision in 2004 resulted in a signifi-cant decrease in both cross-trading activity and average execution shortfall. A lower deviation from benchmark prices limits, but does not necessarily exclude, that some performance re-distribution is still today taking place (a number of cross-trades in our sample appears to be backdated even after 2004). Nonetheless, careful regulatory scrutiny seems to be highly e↵ective in limiting both the extent of mispricing and the incentive to cross-trade within the mutual fund industry. Yet, other related o↵-exchange trading practices, such as trading
in “dark pools” and “internalizers”, have become increasingly popular in recent years.7 Our
results provide additional evidence on the incentive of asset managers to rely on alterna-tive trading venues and warn on the risks posed by unsupervised and less regulated trading activity.
This paper proceeds as follows: Section I briefly reviews the related literature and high-lights the di↵erences with our paper. Section II provides information on the data and de-scribes how cross-trades are identified. Section III explores how cross-trades are priced, o↵ers evidence from the cross-section of cross-trades, and tests the backdating hypothesis. Section IV documents the impact of cross-trading activity on fund performance. Section V provides further results and robustness checks. Section VI concludes.
6In general a large body of literature has been devoted to the study of mutual fund performance see,
e.g., Kacperczyk, Sialm, and Zheng (2005), Kacperczyk, Sialm, and Zheng (2008), Massa and Patgiri (2009), Kempf, Ruenzi, and Thiele (2009), Huang, Sialm, and Zhang (2011), Ferreira, Keswani, Miguel, and Ramos (2012), Chen, Hong, Jiang, and Kubik (2013), and Brown and Wu (2015). Our results suggest that cross-trading activity significantly contributes to explaining the cross-section of fund returns.
7Recent estimates indicate that the total trading volume outside traditional trading venues more than
doubled in the last six years, see “Dark markets may be more harmful than high-frequency trading” Reuters – April 7, 2014.
I.
Related Literature
Previous literature hypothesizes the presence of cross-subsidization in the money management industry. Gaspar, Massa, and Matos (2006) find that when sibling funds trade in the opposite direction, the performance of high-value funds (expensive or successful funds) is boosted and the performance of low value funds decreases. The authors posit that this pattern is consistent with performance shifting via cross-trading. Conversely, Schmidt and Goncalves-Pinto (2013) argue that fund families might systematically shift performance via cross-trades from popular funds (funds attracting positive investor flows) to distressed funds by absorbing flow-induced fire-sales. In both cases, the authors focus on opposite trades computed from quarterly
snapshots of mandatory fund filings.8 In this regard, Gaspar, Massa, and Matos (2006) state
the following: “we should make clear from the start that we can only provide evidence that is
limited by the level of information disclosure to which mutual fund activities are subject.”9
Additionally, a large literature explores incentives at the fund family level aside from the cross-trading setting. Evans (2010) finds that funds outperform while “incubated” but that such outperformance disappears after the funds are open to investors, while Chuprinin, Massa, and Schumacher (2015) find that in-house funds outperform outsourced funds by 0.85% annually consistent with the hypothesis of preferential treatment. Furthermore, Bhat-tacharya, Lee, and Pool (2013) show that affiliated funds of funds (i.e., funds that can only invest in other funds in the family) overweight their holdings in funds that are forced to
sell10 and Nanda, Wang, and Zheng (2004) show that fund families have a high incentive to
start several new funds, increasing their chance of producing “star funds” (i.e., funds that
8E.g., if fund A buys 1,000 of a stock in January and fund B belonging to the same fund family sells 800 of
the same stock in March, the two funds are assumed by related studies to cross-trade 800 shares, significantly overestimating the extent of cross-trading activity.
9Other papers looking at cross-trading activity are Chaudhuri, Ivkovich, and Trzcinka (2012) and
Casavec-chia and Tiwari (2015), however also those papers do not have information on pricing, timing, exact volume of the transactions and stock characteristics.
10While this result may seem apparently in contrast with our finding, the settings of the two papers are very
di↵erent. We consider equity funds and not funds of funds, we focus on asset trades, while Bhattacharya, Lee, and Pool (2013) explore investments in the shares of distressed funds. We focus on all mutual fund families, while Bhattacharya, Lee, and Pool (2013) consider only the subset of mutual fund families that includes affiliated funds of funds.
outperform by chance).
While the evidence provided in previous studies is suggestive of the existence of oppor-tunistic performance shifting via cross-trades, it does not necessary rule out three alternative explanations. First, di↵erential skill or resources might explain why star funds are, on aver-age, more likely to trade in the right direction (Guedj and Papastaikoudi (2008)). Second, reverse causality might be an issue as di↵erences in performance may lead affiliated funds to trade in opposite directions. Third, other within-quarter unobserved actions (i.e., actions that cannot be directly inferred by quarterly filings), such as security lending, timing of in-terim trades, IPO allocations, and window-dressing behavior may contribute to explaining the gap in performance between star and junk funds (Kacperczyk, Sialm, and Zheng (2008)). Since it is impossible to correctly identify cross-transactions from quarterly snapshots of fund holdings, the related literature is not able to provide any evidence on the characteristics, pricing, and popularity of cross-trades. Anand, Irvine, Puckett, and Venkataraman (2012) show that transaction costs have a significant e↵ect on both fund returns and the persistence of relative fund performance. In this paper, we provide direct evidence that cross-trades are executed at a significantly di↵erent transaction cost compared to open market trades and we explore which cross-trades appear to be significantly mispriced.
Finally, tying our trade-level data to fund-level returns we provide evidence from ac-tual trades for the favoritism hypothesis proposed in Gaspar, Massa, and Matos (2006) and Chuprinin, Massa, and Schumacher (2015) (instead of indirect evidence from quarterly hold-ings and returns). Our results cast doubt on the hypothesis that star funds provide insurance to distressed funds on average (see, e.g., Schmidt and Goncalves-Pinto (2013)) and on the as-sumption that the main reason why funds cross-trade illiquid positions is to lower transaction costs (Goncalves-Pinto and Sotes-Paladino (2015)).
II.
Data, Identification of Cross-Trades, and
Summary Statistics
In our analysis, we focus on mutual fund families as a laboratory. While cross-trades are also common in other industries, the mutual fund setting allows us to obtain data from a large number of sources. This section describes the di↵erent datasets we use for our analysis.
A. Trade-Level Data
We obtain trade-level data from Abel Noser Solutions/ANcerno, a consulting firm that works with institutional investors monitoring their trading costs. Batches of data sent by its clients
include all executed trades for the whole period covered by the batch.11 Previous research
has shown that ANcerno institutional clients constitute approximately 8% of the total CRSP daily dollar volume (Anand, Irvine, Puckett, and Venkataraman (2012)) and that there is no survivorship or backfill bias in the data (see, e.g, Puckett and Yan (2011)). Despite ANcerno claims that all trades are disclosed, we cannot rule out that clients opportunistically choose which trades to submit or that they intentionally misreport execution prices. However, strategic reporting would bias the results against finding evidence for opportunistic pricing of the cross-trades. Therefore, our results are unlikely to be a↵ected by opportunistic reporting or, in any case, under-represent the real extent of mispricing.
ANcerno provides us with several variables useful for our investigation: stock identifier
(cusip), trade date, execution price, execution time,12 number of shares executed, side of the
trade (i.e., buy or sell), price of the stock at the time of the execution, commissions paid, and volume-weighted average price of the day (VWAP). ANcerno provides information both at the order (called ticket in Anand, Irvine, Puckett, and Venkataraman (2012)) and at the trade level. In particular, each order can be broken down into a number of trades executed
11Examples of other empirical studies using ANcerno include Chemmanur, He, and Hu (2009), Anand,
Irvine, Puckett, and Venkataraman (2012).
at di↵erent times of the day (or in some extreme cases across di↵erent days). We find the number of trades to be more than double the number of orders in our sample which is in line with Anand, Irvine, Puckett, and Venkataraman (2012). As the relevant benchmark for cross-trades is the price at which the trade is executed (while the price at the placement of the order is irrelevant), we conduct most of our analysis at the trade level.
This trading information is sent to ANcerno by its di↵erent clients13 and the identity
of the clients is always anonymized. Importantly, while the client is anonymized, the asset manager is not. For a limited period of time in 2010–early 2011 ANcerno provided its aca-demic subscribers with the identification table “MasterManagerXref” including unique codes (managercodes) with associated names of the asset manager to whom they were affiliated. It is important to mention that the set of provided identification files is subscription-specific. The sample used in this study is constructed using the fullest set of identification files pro-vided by ANcerno, to which earlier and later subscribers do not have access. The full file includes 1,088 asset managers. The additional identification file “ManagerXref” has the nec-essary variables to link managing companies to the trades (see Figure 3 in the Appendix). The same identification files allow us to match ANcerno data with the Thomson Reuters database unambiguously. In particular, we match fund families from ANcerno to 13F/S12 by name. For instance, the match table provided by ANcerno includes a manager name (e.g.,
“XYZ Capital”)14 and a managercode (e.g., 10). This allows us to match the managercode
number to a number of trades in ANcerno executed by funds affiliated to XYZ Capital. Our matched database spans the time interval from 1999 to 2010. ANcerno ceased pro-viding the identification of asset managers in 2011. Hence, we cannot conduct our analysis in the post-2010 period. Unfortunately, while ANcerno provided us with unique asset manager (family) identifiers, it does not make available unique fund identifiers. Therefore we are able to link with certainty each cross-trade to the asset manager to which the fund is affiliated
13A client can either be a single fund or a fund manager managing multiple funds or, alternatively, a money
manager which is managing a portfolio on behalf of the client.
but not to the fund itself. Our contact at ANcerno explicitly stated that it is not possible to identify with certainty the specific funds using their data. Some fund/fund manager names are occasionally reported by ANcerno but they appear to be highly unreliable or incompre-hensible. We are therefore able to establish that two trades from asset manager XYZ Capital are internally crossed with each other but we can only provide suggestive evidence on the exact identity of the two funds that are cross-trading. However, as our analysis is mostly conducted at the trade level, the exact identity of the funds is irrelevant as long as we are able to ensure that two trades are o↵set within the same fund family.
B. Identifying Cross-trades
A cross-trade is a transaction in which a buy and a sell order for the same stock coming from the same fund family is conducted without going through the open market. We identify cross-trades in our database as transactions occurring i) within the same fund family, ii) in the same stock, iii) at the same time of the same day, iv) at the same price, and v) having the same volume of the trade but in opposite trading directions. For instance, a buy trade of 1,000 Apple shares executed on January 2nd, 2010, at 10:05 a.m. for $101 is classified as a cross-trade only if we have in our sample a corresponding sell trade of 1,000 Apple shares coming from the same fund family and executed on January 2nd, 2010, at 10:05 a.m. for $101. While it is, in theory, possible that two funds belonging to the same fund family would make exactly the same trade in opposite directions at the same time by chance, it is highly unlikely. Mutual funds do not trade at very high frequencies and usually affiliated funds rely on the same research which leads them to rarely trade in opposite directions (Elton, Gruber, and Green (2007)).
To check the reliability of our matching procedure, we compare the commission costs of open market trades with those of the trades we classify as cross-trades. In particular, commissions for cross-trades should be zero or extremely small (the broker does not need to find a counterparty for the trade, although sometimes a commission is due for bookkeeping
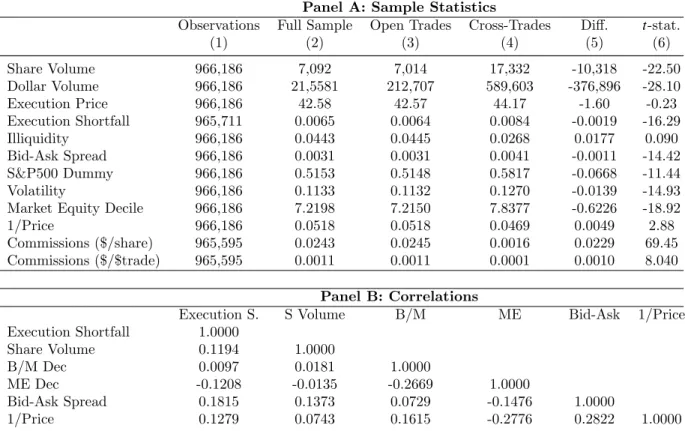
services). We find that the average commission ($/share) for cross-trades is 0.0016 (the median commission is 0), while it is around 0.0245 for open market trades (see Table I,
Panel A).15 If we compare dollar commissions per dollar trade, the average value is 11 basis
points for open market trades and 1 basis point for cross-trades. The di↵erence is statistically significant at the 1% level. In particular, commissions are 0 for more than 90% of the trades we classify as cross-trades, suggesting that our algorithm identifies cross-trades with very high degree of precision.16
This identification procedure overcomes the main limitation of the proxies computed using quarterly or semi-annual snapshots employed by Gaspar, Massa, and Matos (2006), Schmidt and Goncalves-Pinto (2013), and Chuprinin, Massa, and Schumacher (2015). Through our approach, we ensure that opposite trades recorded in the same quarter but occurring in di↵erent days/times and having di↵erent volumes are not considered as cross-trades. In the latter part of the paper, we provide some suggestive evidence regarding the impact of cross-trading on fund performance. When we run regressions at the fund level, our main
explanatory variable isCT %f ,t: the monthly total dollar volume of cross-trades executed by
family f in month t as a proportion of the total dollar volume of trades (open-market trades
plus cross-trades) executed by family f in month t.
C. Execution Shortfall
For the price at execution, we rely on the data provided by ANcerno. Rule 17a-7 of the U.S. Investment Company Act establishes that cross-transactions should occur at the “current market price” of the security. Therefore we focus on the market price at the moment of the execution as the main benchmark as this seems to be the closest to what Rule 17a-7 prescribes (according to our contact this is essentially the mid quote at the moment of the
15The average commission reported in Anand, Irvine, Puckett, and Venkataraman (2012) is slightly higher
(0.028). We however find basically the same number if we limit our sample to the same time interval (1999-2008).
16Results are analogous when considering as cross-trades only transactions where no commissions have
been paid. Occasionally, commissions are not charged also for normal trades. Therefore, the reporting of zero commissions is neither a necessary nor sufficient condition for a trade to be classified as a cross-trade.
execution).17 In a limited number of cases ANcerno arbitrarily sets the execution time of the trade at the end/beginning of the day if the time is missing in the information provided by the institutional investor (see Anand, Irvine, Puckett, and Venkataraman (2012)). If the execution time reported is incorrect, this could potentially add significant noise to our
results.18 Assuming that misreporting is random there is however no reason why cross-trades
should be systematically set at the highest price. Conversely, if misreporting is strategic this should limit the incidence of mispricing cases and bias the results against our main finding. As a check to ensure that such misreporting does not significantly a↵ect our results, we replicate our analysis after dropping trades executed exactly at the opening or closing price of the day and find similar results. Additionally, we reproduce our analysis using benchmarks that do not depend on the exact time at which the trade is executed.
Cross-trades should minimize the impact of trading costs and commissions on the ex-ecution price, limiting deviations from the price quoted on the market (which is our main benchmark). Therefore, we define the execution shortfall as the absolute value of the devi-ation from the benchmark price scaled by the benchmark price itself. Considerdevi-ation of the absolute value of the deviation from the benchmark is necessary in our setting. In fact, for each cross-trade our sample includes two twin trades with opposite execution shortfalls that would cancel each other out if signed values were considered. Formally,
Execution Short f allj,i,t =|Pj,i,tP Pi,t|
i,t , (1)
where Pj,i,t is the execution price of trade j, in stock i, at execution time t; while Pi,t is
the price of stock i in the market at time t. The distribution of Execution Short f allj,i,t is
plotted in the Appendix in Figure A.4. Results using alternative benchmarks are presented
17The time of the execution is provided at the minute level. However, trades can be executed at di↵erent
seconds of the same minute. This would create by construction a spread between the execution price of a trade and its benchmark. Since this should a↵ect in the same way open market trades and cross-trades (the exact execution time within the minute should be random for both), it does not compromise the validity of our results.
18It is worth noting that our ANcerno contact assured us that this problem only a↵ects an extremely
in Section V.19
D. Fund-level Data
The main focus of our analysis is on individual trades. However, we are also able to provide some evidence at the fund level by linking our sample to CRSP mutual fund data via the asset manager identity. Specifically, we produce measures of a mutual fund’s size, fees, and flows.
Following Gaspar, Massa, and Matos (2006) we compute fees as1/7( f rontload+rearload)+expense
ratio. We also compute fund flows following the literature (see, e.g., Coval and Sta↵ord (2007)):
Flowi,t=T NAi,t (1 + retT NA i,t)T NAi,t 1
i,t 1 , (2)
whereT NAi,t is the total value of net assets under management and reti,t is the monthly
return of fund i in month t. At the fund family level, we compute the family size, the
dispersion in intra-family returns, expense ratios, and fees. Family Size is defined as the log
of the sum of the individual funds’ assets at the beginning of the month. We compute the
intra-familyReturn Dispersion as the standard deviation of the returns of all affiliated funds
in the previous month. Similarly, the Expense Ratio Dispersion is the standard deviation of
the expense ratios, while the Fees Gap is the di↵erence between the highest and lowest fee
charged by funds affiliated to the asset manager in a given month.
Additionally, we compute the variable Siblings as the log of the number of equity funds
belonging to the same family f in month t (Pollet and Wilson (2008)). We use the set
of Thompson Reuters Investment Objective Codes to identify the investment style for each
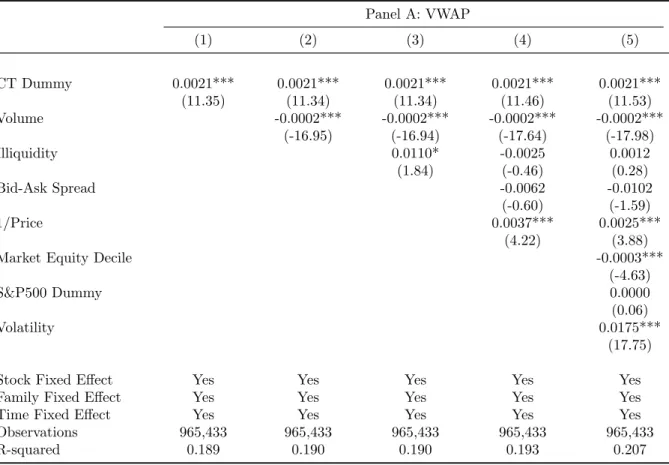
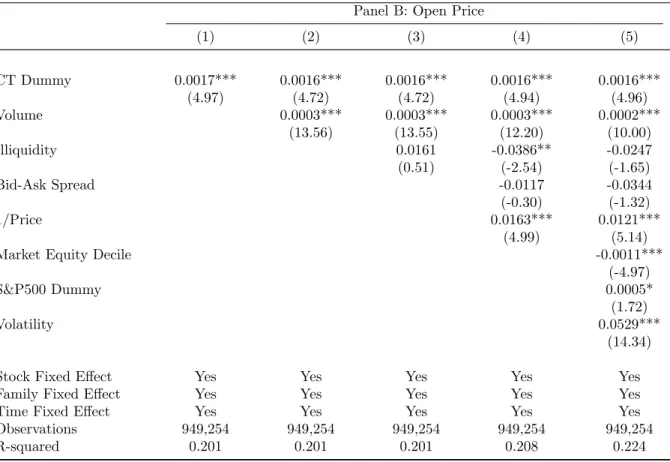
19To verify the robustness of our results and rule out the possibility that they are driven by misreporting
of the execution time, we replicate our analysis using the volume-weighted average price of the day (VWAP) and the open price of the day as alternative benchmarks (this does not require us to use the execution time variable at all). Some studies argue that the price at execution should be compared with theVWAP, which is also the most popular benchmark among practitioners (see Berkowitz, Logue, and Noser (1988), Hu (2009), and Anand, Irvine, Puckett, and Venkataraman (2012)). However, other studies warn about potential shortcomings in the use of VWAP as a benchmark (see, e.g., Madhavan (2002) and Hasbrouck (2007)). For instance, large trades are more likely to be executed exactly at theVWAP. Therefore, following Busse, Chordia, Jiang, and Tang (2015) we replicate our analysis also using the open price of the day as a benchmark (see Section V). In all cases results are qualitatively similar.
fund. Following Ferris and Yan (2009), we also build a proxy of governance based on precedent infringements. In particular, we argue that fund families investigated by the SEC for illegal practices that are potentially harmful to investors (other than cross-trading related practices) are more likely to have weak governance. Consistent with this argument, Dimmock and
Gerken (2012) show that past legal violations have significant power to predict future fraud.20
Therefore, we examine SEC administrative proceedings and the Wall Street Journal Mutual Funds Scandal Scorecard to categorize each fund family as having either weak or strong governance.21
E. Summary Statistics
Sample statistics on the matched fund sample are reported in the Appendix (see Table A.I). Columns 2 through 4 show statistics from the CRSP mutual fund-Thomson Reuters match. The intersection between the two samples leaves us with 2,351 funds, organized into 452 fund families. The average mutual fund size is $1,258 million, while the average mutual fund family size is $39,531 million. The average fund family includes 17 equity funds.
Matching our sample of mutual funds to the ANcerno database decreases our sample size significantly. The final number of asset managers in our sample is 203 fund families managing 1,393 separate mutual funds. In particular, our matched sample contains 45% of the mutual fund families and 59% of the funds in the CRSP-TR dataset. Our sample is biased toward large institutions since the smallest families are less likely to rely on ANcerno’s services (this bias has also been recognized by previous studies (see Puckett and Yan (2011)). Our final sample contains observations from 8 of the 10 largest mutual fund families in the United
States.22 Given that the top 10 families hold around 70% of the assets managed by the entire
mutual fund industry, the bias toward larger institutions does not limit the implications of
20In particular, avoiding the 5% of firms with the highest ex ante predicted fraud risk would allow an
investor to avoid 29% of fraud cases and over 40% of the total dollar losses from fraud.
21We focus on investigations instead of final court rulings because more than 90% of the investigations end
up in out-of-court settlements.
22Given the non-disclosure agreement we signed with ANcerno we are forbidden to reveal the names of the
our results. Additionally, the funds in our final database perform slightly better than funds
in the CRSP database.23 This di↵erence may be explained by the fact that funds belonging
to large fund families perform better on average (Chen, Hong, Huan, and Kubik (2004)). In order to limit the sample size for our empirical analysis on trade-level data, we extract three random samples, each consisting of 1% of the original ANcerno sample, and retain only
those observations for which we have all control variables.24 We then carry out our analysis
on all 3 samples separately and report results from sample 2 as they are the weakest25 and,
therefore, are likely to provide a more conservative estimate of the mispricing of cross-trades. Our sample consists of 966,186 trades out of which we classify 7,368 as cross-trades and the remaining 958,818 as open market trades. Panel A of Table I reports the number of observations (Column 1), the average values for all of the main variables in the full sample (Column 2), the average values keeping open market trades only (Column 3), the average values keeping cross-trades only (Column 4), the average di↵erence between open market
trades and cross-trades (Column 5), andt-statistics for the null hypothesis of equality between
the means of open market trades and cross-trades (Column 6). The summary statistics show that cross-trades are significantly bigger than normal trades both in share and dollar volume. Additionally, cross-trades generally involve stocks that present higher bid-ask spreads, are more volatile, and are bigger. In fact, they both exhibit higher average market capitalization and are more likely to be included in the S&P500 Index. The fact that most of the cross-trades occur in large market capitalization stocks is probably due to the high degree of overlap in large cap stocks across the portfolios of affiliated funds within a given family.
On average, cross-trades exhibit significantly higher execution shortfall than open market trades (0.84% versus 0.64%). Our numbers are higher than those reported in Anand, Irvine, Puckett, and Venkataraman (2012). This is due to three main di↵erences in how we compute
23Average flow of 0.28% in the matched sample versus 0.09% in CRSP; average monthly raw return of
0.42% versus 0.37%; and average monthly alpha of 0.03% versus 0.00% (see Table A.I in the Appendix.)
24This procedure is not uncommon in the asset pricing literature (see, e.g., Ben-David and Hirshleifer
(2012)).
our shortfall measure which arise naturally from di↵erences in the research design. First, we
always compute the absolute value of Execution Short f all, whereas Anand, Irvine, Puckett,
and Venkataraman (2012) do not.26 Second, we use the market price at execution instead
of the price at placement as a benchmark (Rule 17a-7 of the U.S. Investment Company Act states that cross-trades should be executed at the prevalent price at the moment of the trade). Third, we look at trades rather than at orders (a single order can be broken down in several trades executed at di↵erent times, the relevant benchmark for our analysis will di↵er depending on when each single trade is executed).
In Panel B we report pairwise correlations among our main variables to make sure that stock and trade characteristics have an impact on execution shortfall that is consistent with the related theory. As with previous research, we find that the execution shortfall is positively correlated with proxies of stock illiquidity and negatively correlated with proxies of market capitalization.
III.
The Pricing of Cross-Trades
A. Cross-Trades and Execution Shortfall
Our empirical strategy uses cross-sectional variation to explore how cross-trades are priced relative to trades executed in the open market. Rule 17a-7 allows cross-trades subject to conditions of the fair valuation of assets (“independent current market price” – usually the last sale market price) and fair treatment of both parties. The Securities and Exchange Commission specifies that the adviser has a duty to, among other things, “carefully consider” its responsibilities to investors to ensure the best execution and loyalty to each fund. In particular, a cross-trade should never occur when one party could obtain a better price by going through the open market. Our null hypothesis is, therefore, that cross-trades exhibit
26We focus on the deviation from the benchmark irrespectively of the direction of the trade since each
cross-trade is a zero-sum game in which there is a winner and a loser party, therefore for our research design it would not make sense to compute the signed deviation.
a significantly smaller execution shortfall than ordinary trades. A higher deviation from the benchmark price would, instead, suggest that one trading counterparty gets unfairly penalized in the cross-trade. In our analysis, we compare the execution shortfall of cross-trades with the execution shortfall of open market trades controlling for trade, stock, time, and family di↵erences.
We run trade-level ordinary least square regressions of execution shortfall onCT Dummy,
a dummy variable that takes a value of one when a trade is a cross-trade and zero otherwise. We cluster errors at the time level to account for cross-sectional heterogeneity. Formally,
Execution Short f alli, f ,t=b(CT Dummyi, f ,t) +G0Xi,t+gi+gf+gt+ei, f ,t, (3) wherei indexes the stock, t the time, and f the fund family. Xi,t is a vector of time-varying stock-level controls,gt,gi, andgf are time,27 stock, and family fixed e↵ects, respectively. The
identification of an e↵ect forCT Dummyi, f ,t on execution shortfall comes from the comparison
of cross-trades with otherwise similar trades that are not crossed.
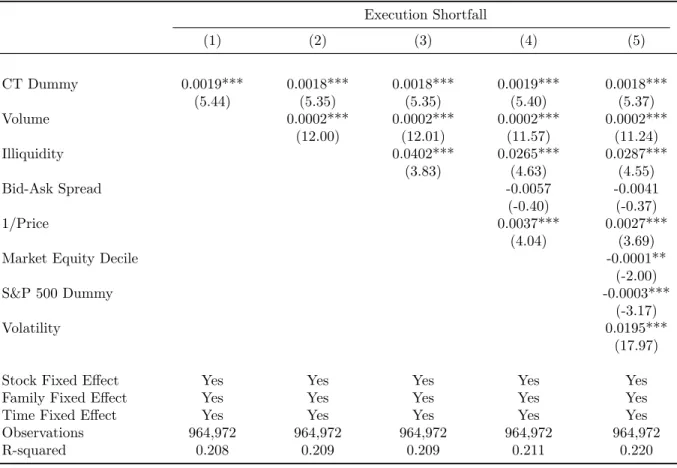
Column 1 of Table II shows that the execution shortfall is 19 basis points higher for
cross-trades relative to open market trades, a di↵erence that is significant at the 1% level (t-statistic of 5.44). A potential explanation for this di↵erence is that cross-trades are on average larger in volume. To be certain that our result is not driven by trading volume, we
include the volume of the trade28 as a control variable in specification (2). Table II, Column
2 shows that a higher trading volume indeed a↵ects the magnitude of the execution shortfall,
as the coefficient of our CT dummy decreases from 19 to 18 basis points, however it still
remains significant at the 1% level.29
27We uset (instead of t) as the subscript of the time dummies to emphasize that our time fixed e↵ects are
at the month level, while trades can be executed at any timet of the day. We use month-level fixed e↵ects to limit the number of dummies in our model. To include day fixed e↵ects and cluster errors at the day level actually yields economically and statistically stronger results.
28We use the share volume of the trade instead of the dollar volume to avoid mechanical correlation with
the dependent variable as the price of the stock would be included both in the dependent and independent variable. However, results using the dollar volume are similar.
29In a previous version of the paper, we reported lower estimates. The di↵erence is due to the inclusion of
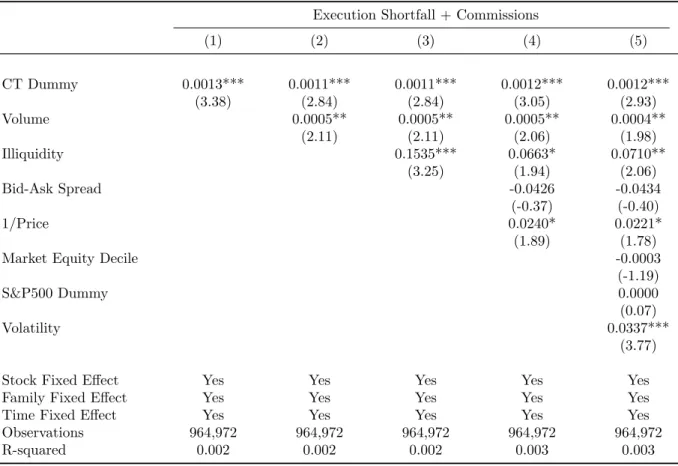
We also consider the possibility that time-varying stock characteristics may also have an e↵ect on the size of the execution shortfall. For instance, highly volatile and illiquid stocks usually display a higher execution shortfall than their less volatile and more liquid counterparts. For this reason, we include time-varying controls for di↵erent proxies of stock illiquidity: the Amihud Ratio (Illiquidity), the ratio of one over the open price of the day (1/Price), and the bid-ask spread (Bid-Ask Spread). We also include proxies for stock cap-italization because bigger stocks display in general lower execution shortfall. In particular, we control for both inclusion in the S&P500 index (S&P500 Dummy) and the stock market capitalization decile (Market Equity Decile). Finally, we control for the standard deviation in stock daily returns (Volatility). The impact of the inclusion of all controls on the magnitude and significance of the main coefficient of interest is marginal at best. Furthermore, the signs of all of the coefficients for the control variables are consistent with the findings of related
research.30 Results obtained from the full specification model including all control variables,
indicate that the execution shortfall for cross-trades is, on average, 18 basis points higher
than that of open market trades.31 This result is significant at the 1% level (t-statistic of
5.37).
Our result is economically significant. Given that the average percentage bid-ask spread in our sample is 4 basis points, the marginal e↵ect of cross-trades on the execution shortfall is 4.5 times greater than a fund would pay had it operated through market channels. Conservative back-of-the-envelope calculations suggest that cross-trading shifts, on average, performance
by $1.8 million per day in the mutual fund industry alone.32 However, the exact impact of
mispricing on fund performance depends on additional factors, such as, the extent of cross-trading activity and the size of the fund itself. Section IV provides estimates of the impact of
30With the only exemption of Bid-Ask Spread which turns insignificant when the other proxies of stock
illiquidity are included due to the high correlation among them.
31We obtain similar results using di↵erent fixed e↵ects, see Appendix.
32This number is obtained by multiplying $169 billion (average daily trading dollar volume on the NYSE)
times 0.30 (roughly the total US equity held by mutual funds according to Investment Company 2015 factbook ) times 0.02 (average cross-trading activity out of total dollar trading volume of mutual funds in our sample) times 0.0018 (marginal e↵ect ofCT Dummy on execution shortfall). This number is likely to be a lower bound as considering only the NYSE significantly under-represents the total amount of trading activity.
mispriced cross-trades on fund performance. In conclusion, these findings provide evidence that supports the results from Kacperczyk, Sialm, and Zheng (2008) and Anand, Irvine, Puckett, and Venkataraman (2012), in suggesting that unobserved actions occurring within a quarter (therefore not captured by obligatory fund filings) and heterogeneity in transaction costs might have significant implications on performance.
B. Reverse Causality and Endogeneity
B.1. The Natural Experiment
One concern with our previous results is the direction of causality. A reverse causality argument suggests that instead of cross-trades explaining execution shortfall, it was high expected execution shortfall that drove the decision of fund managers to enter into cross-trades. Additionally, omitted variables may a↵ect both execution shortfall and the choice of a fund manager to cross-trade. We address these concerns by using an exogenous increase of regulatory scrutiny.
On September 3, 2003 the New York State Attorney General Eliot Spitzer announced the issuance of a complaint claiming that several mutual fund firms had arrangements allowing trades that violated terms of their funds’ prospectuses, their fiduciary duties, and general securities laws (the investigation led to what is commonly referred to as the “late trading scandal”). Subsequent investigations showed that at least twenty mutual fund management companies, including some of the industry’s largest firms, had struck deals permitting im-proper trading (Zitzewitz (2006), McCabe (2009)). Importantly, most of the violations in-volved late-trading, while none of the funds under scrutiny were charged with improper cross-trading.33
As a consequence of the scandal, in 2004 new rules were introduced and adopted by the SEC requiring fund families to implement more stringent compliance policies. In particular,
33The late trading scandal has been used as a source of exogenous variation in other papers (see, e.g.,
Anton and Polk (2014)). However, in this paper we are not interested in the late trading scandal per se, but mainly into the regulatory framework that was implemented as a response to the scandal.
Rule 38a-1 under the Investment Company Act of 1940 forced investment companies to “have strong systems of controls in place to prevent violations of the federal securities laws and to protect the interests of shareholders and clients.” Amplifying such controls, Rule 206(4)-7 required each adviser registered with the Commission to designate a chief compliance officer empowered with the full responsibility and authority to develop and enforce appropriate policies and procedures for the firm. Additionally, compliance officers were required to report directly to the board of directors to increase their independence. We contacted a number of compliance officers at leading fund management companies to obtain more information about the actual implications of the new regulations. They pointed out that the supervision of cross-trading activity and the monitoring of the execution price of the cross-trades became one of their key responsibilities beginning in 2004.
We argue that both the increased attention to improper trading practices in the industry induced by the late trading scandal and the tightening of regulation forced fund families to, at the very least, reduce opportunistic cross-trading activity. This exogenous shock allows us, first, to improve our estimation of the impact of opportunistic cross-trading on performance. Second, it permits us to estimate what proportion of cross-trades was executed primarily for opportunistic reasons.
The new rules became e↵ective on February 5, 2004 while the date companies were re-quired to demonstrate compliance was October 5, 2004. We use the latter as the treatment
date in our analysis.34 Since many relevant aspects of the trading environment changed
around this time as well (e.g., the liquidity of the market increased, and many new sophis-ticated investors entered the market) we need to compare cross-trades to a control group of trades that are at least as likely as cross-trades to be a↵ected by increasing liquidity in the markets post-2004 but are unlikely (or significantly less likely) to be directly a↵ected by the introduction of Rule 38a-1 and Rule 206(4)-7. Therefore, we compare the e↵ect of the new regulation on the pricing of cross-trades (treatment group) with that on open market
34Using as the treatment date February 5, 2004 provides us with quantitatively weaker but qualitatively
trades (control group). Our analysis resembles a di↵erence-in-di↵erence test in which only trades receive the treatment in October 2004. The e↵ect of internal governance on cross-trading activity has so far never been explored and we believe it represents an interesting result in and of itself.
B.2. The E↵ect of Increased Supervision on Cross-Trades
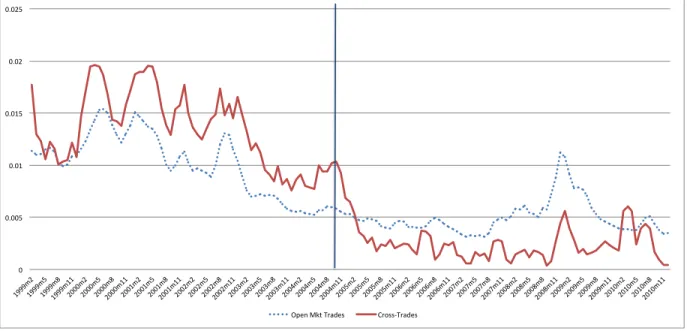
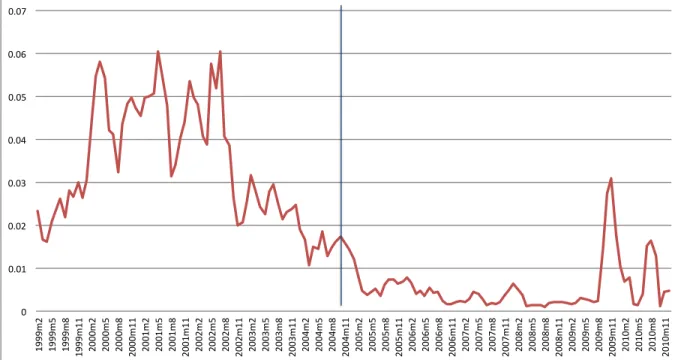
Figure 1 shows clearly that the execution shortfall of cross-trades and that of open market trades display a parallel trend before the regulatory shock. However, the new regulation strongly a↵ects the execution shortfall of cross-trades, while leaving the execution shortfall of open market trades unaltered. In particular, the execution shortfall of cross-trades is higher than that of open market trades before the compliance date (see vertical line) and lower afterwards. Figure 2 shows the fraction of cross-trades out of all institutional trades. In particular, the percentage of cross-trades starts to decrease at the onset of the late trading scandal and drops permanently after the funds had to comply with the new regulation. Overall, cross-trading activity went from peaks of 6% of the dollar volume traded to less than 1% on average after the new rules were introduced.
Table III shows the e↵ect of tighter regulation on Execution Short f all in a multivariate
framework. Our specification includesCT Dummy; Post Regulation, i.e., a dummy variable
capturing the e↵ect of general changes in trading conditions after 2004; and the interaction
between Post Regulation and CT Dummy (Post Regulation is not included independently in
specifications (2) through (5) since it would be collinear with the time dummies). The control group consists of open market trades that should be less (or not at all) a↵ected by the change in regulation triggered by the late trading scandal. The coefficient of the interacted variables (CT Dummy x Post Regulation) captures the marginal e↵ect of the new regulation on Execution Short f all for cross-trades (i.e., the e↵ect of the treatment). Post Regulation and the time dummies capture the e↵ect of a general increase in market liquidity in the last part of the sample.
Our results indicate that tight regulation had a major e↵ect on the pricing of
cross-trades: Execution Short f all dropped by 59 bps almost immediately after the compliance
date, falling below that of open market trades (the result is significant at the 1% level). This finding suggests that poor governance before the late trading scandal played a significant
role in determining a higher Execution Short f all for cross-trades. Overall, results in this
section establish a causal relation between cross-trading and mispricing. Importantly, while the execution shortfall of cross-trades does not exceed that of open market trades after 2004, the remaining deviation from benchmark prices may still be enough to arbitrarily shift performance, even though probably to a lesser extent. To find execution shortfalls systematically higher than that of open market trades in the presence of tight supervision would be unlikely. In the following, we provide evidence consistent with the hypothesis that opportunistic pricing became weaker and is now shrouded but persists even after the regulatory change.
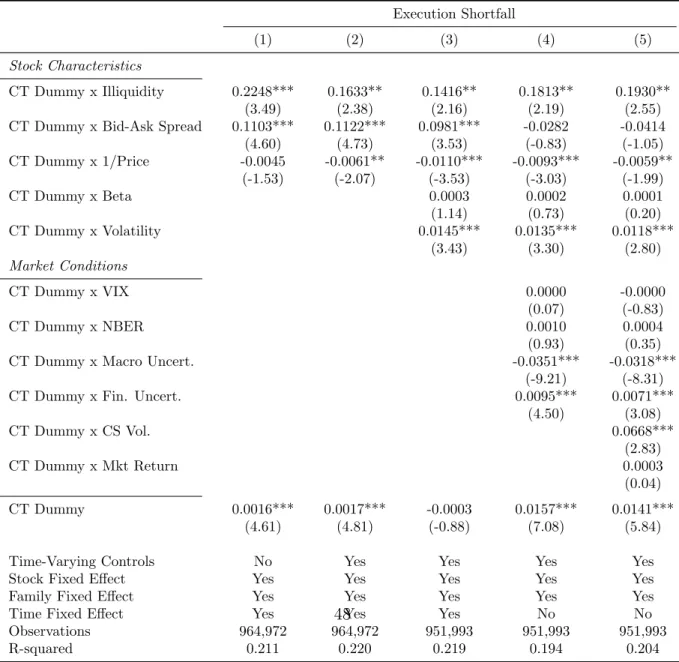
C. Stock Characteristics, Market Conditions, and Backdating
This section examines which cross-trades are more likely to be mispriced. In our specification,
we interactCT Dummy with a battery of stock-level characteristics and market-level
condi-tions. The stock-level variables are Illiquidity, 1/Price, Bid-Ask Spread, Beta, and Volatility.
Beta is the beta of the stock estimated using the Capital Asset Pricing Model (CAPM), all other variables are described above (see Section III.A). The market-level variables are the volatility index (V IX), the NBER recession indicator (NBER), proxies of macroeconomic and
financial uncertainty35 (Macro Uncert. and Fin. Uncert.), the cross-sectional return
disper-sion in the day preceding the trade (CS Vol.), and the return of the market in the previous month (Mkt Return). We control in our analysis for stock characteristics non-interacted and time, stock, and family fixed e↵ects.
35We use proxies of macroeconomic and financial uncertainty from Jurado, Ludvigson, and Ng (2015). The
authors derive model-free measures of uncertainty aggregating the h-step-ahead forecast error obtained using several financial and economic series.
Results reported in Table IV indicate that the mispricing of cross-trades is more
signif-icant for highly illiquid36 and volatile stocks. This is not surprising since these stocks o↵er
more discretion on how to price transactions given that they incorporate higher asymmetric
information and have lower trading volume.37 One could argue that, by construction, highly
illiquid and volatile securities should exhibit higher deviation from benchmark prices. Yet, including time-varying stock characteristics non-interacted in all specifications accounts for
this possibility.38 Goncalves-Pinto and Sotes-Paladino (2015) posit that the main reason why
funds cross-trade is the reduced transaction cost when trading illiquid securities, we however show that institutions pay a significantly higher cost when they cross-trade illiquid securities compared to when they trade the same illiquid securities in the open market.
In columns (4) and (5), we exclude time fixed e↵ects from our model in order to test
whether market-wide conditions a↵ect how cross-trades are priced.39 We find that
cross-trades are more mispriced in times of uncertainty. Interestingly, most of the mispricing of cross-trades appears to be unrelated to time-series volatility and positively related to measures of asymmetric information in the markets (i.e., Jurado, Ludvigson, and Ng (2015)’s proxy of financial uncertainty, measures of cross-sectional return dispersion, and illiquidity). This is overall consistent with the hypothesis that institutions protect their top funds in periods of
high uncertainty o↵ering additional compensation to hold illiquid/difficult to price assets.40
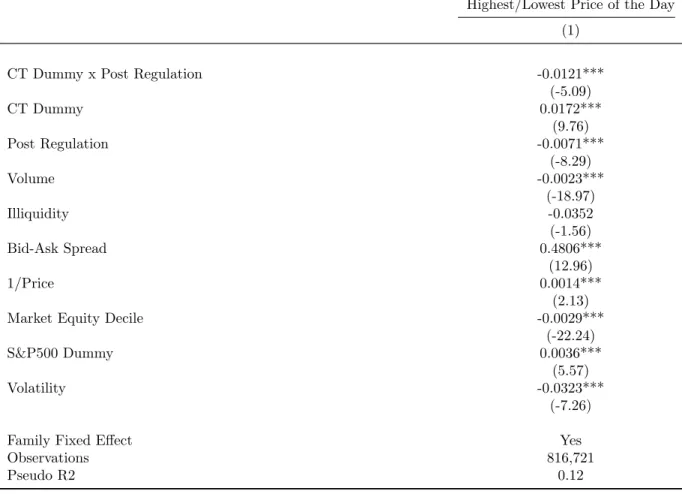
Furthermore, we test the hypothesis that a number of cross-trades was actually back-dated. When the main purpose of cross-trades is to reallocate performance between
counter-361/Price presents the “wrong” sign due to the high correlation with the other proxies of illiquidity included
in our model. The sign of the coefficient reverses if the other proxies of illiquidity are excluded.
37Yet, this potentially conflicts with the requirement for the price of the cross-traded assets to be readily
available and easily determinable (see 17a-7 (a) of the U.S. Investment Company Act) as prices of illiquid securities are often stale.
38Non-interacted stock and trade level variables are always included in Table IV even though the coefficients
are not explicitly reported to save space.
39Also non-interacted market-wide variables and time-varying stock controls are included but the
coeffi-cients are not reported to save space.
40Interestingly, the coefficient ofCT Dummy x Macro Uncertainty is negative, suggesting that, in this case,
cross-trades benefit the investors diminishing the cost of macroeconomic uncertainty. In unreported results, we find that the coefficient ofCT Dummy x Macro Uncertainty was positive before the 2004 regulation was introduced and turned negative afterwards. This result supports the hypothesis that careful regulatory scrutiny may change dramatically how cross-trades are used.
parties, the best strategy from a family perspective would be to arbitrarily set cross-trades ex post to the price of the day that would have shifted the highest performance (i.e., the highest or lowest price of the day). From our contacts with compliance officers, we understood that a common practice in the industry is to check cross-trades ex-post to assess whether the execution price was inside a reasonable interval. An execution price lower or higher than any price actually realized during the trading day would immediately flag a trade as suspicious. However, some deviation from benchmark prices is usually deemed acceptable. We test the backdating hypothesis estimating a logit model in which the dependent variable assumes a value of one if the execution price is either the highest or the lowest of the day and we regress it on our cross-trade dummy and controls. Whether the price was actually the highest or the lowest is indi↵erent for our purpose since the party that is expected to gain from the
transaction can benefit in both cases (selling at the highest or buying at the lowest).41
Results reported in Table V suggest that some cross-trades are actually backdated.42 Our
estimated coefficient indicates that cross-trades are 1.7% more likely to be executed exactly
at the highest/lowest price of the day (marginal probabilities are reported). It is however certainly possible that traders choose to cross-trade when prices in the market are extreme. Therefore, as in the previous section, we use the 2004 regulatory change as an exogenous
shock to improve our identification. We interactCT Dummy with Post Regulation to assess
whether cross-trades became less likely to be executed at the highest or lowest price after the new regulation was passed. Our findings are consistent with a causal interpretation of the results: after 2004 cross-trades became 1.2% less likely to be executed at extreme prices. The inclusion of open market trades rules out the possibility that market wide changes in
41Importantly, we cannot include stock, family, and time fixed e↵ects contemporaneously in this
specifica-tion because the estimaspecifica-tion of a non-linear model becomes infeasible with a very large number of dummies. To limit our sample size we consideronly families that cross-trade at least once and to simplify the compu-tation we includeonly family fixed e↵ects. In the Appendix, we report analogous results estimating a linear probability model keeping in our sample all observations and including time, family, and stock fixed e↵ects (see Table A.III).
42The issue of misreporting of execution times in ANcerno is arguably more relevant for this part of the
analysis since ANcerno arbitrarily sets missing time entries at the open/end of the trading day. To rule out the possibility that this could influence our result, we replicate our analysis dropping all trades executed exactly at the opening or closing price of the day. Results are analogous.
the trading environment after 2004 are driving our results (as they should also be a↵ected). Interestingly, this result survives if we run it only on the post regulation sample, suggesting that cross-trades are still more likely than open market trades to be executed at extreme prices, even though less so than before 2004 (see Table A.VII in the Appendix). Therefore, we argue that opportunistic performance shifting via cross-trades is still likely to happen. Additional evidence on this aspect is provided in the next section.
D. The Cross-Section of Cross-Trades
This section investigates how fund family characteristics a↵ect the pricing of cross-trades. In general, family characteristics should not be correlated with the pricing of cross-trades. However, if cross-trades were used to shift performance, we may find that proxies for weak governance and high incentive to reallocate performance are correlated with the execution shortfall. Importantly, to increase the power of our tests in this section only cross-trades are kept. Since the number of cross-trades in the full ANcerno sample is relatively limited (we have 738,476 cross-trades), we do not need to draw a random sample to conduct our analysis but we can simply exclude all open-market trades. An alternative approach would
be to interact ourCT Dummy with family characteristics and run our regressions on a random
extraction from ANcerno including both cross-trades and open market trades (as we did in the previous sections). However, this would further limit the number of fund families included in our analysis. Therefore, we decided to keep all trades and test whether the cross-trades executed in some families are priced di↵erently from the cross-cross-trades executed in other families.
Our results reported in Table VI indicate that cross-trades executed within weak gov-ernance institutions display a 27 basis points higher execution shortfall than cross-trades executed in strong governance institutions. Additionally, a standard deviation increase in
the number of siblings increases the Execution Short f all by 15 basis points. Massa (2003)
internal market, in which potentially multiple funds can engage in cross-transactions, besides attracting flows also incentives the opportunistic pricing of cross-trades.43
Furthermore, we show that an increase of one standard deviation inFees Gap boosts the
execution shortfall by 10 basis points. Results for a one standard deviation increase of the expense ratio are similar (we do not include both variables at the same time in our regressions as they are highly correlated). We include in our specifications both stock and time fixed e↵ects but not family dummies since we are interested in estimating the e↵ect of family-level variant and invariant characteristics on the execution shortfall. The positive e↵ect of fees dispersion on the pricing of cross-trades strongly points in the direction of performance reallocation from junk to star funds. In fact, the incentive for conducting “winner-picking” strategies is arguably stronger when some funds are significantly more valuable than others (Stein and Scharfstein (2000), Nanda, Wang, and Zheng (2004)), while the incentive for subsidizing underperformers is probably stronger when all funds have similar importance from
a family perspective.44 Additional support for the “winner-picking” hypothesis is provided
in the next section. Overall, our results indicate than cross-trades from weak governance institutions, with large internal markets, and high dispersion in fees among sibling funds appear mispriced with respect to the the average cross-trade in our sample.
Running our regressions only on the post regulation part of the sample (Table VI, Column
43We include in our regressions also the total asset size of the asset manager (Family Size) to distinguish
the e↵ect of large internal markets, in which many funds can cross-trade, from the e↵ect of the size of the asset manager (as family size is a known predictor of fund returns, see Chen, Hong, Huan, and Kubik (2004).) However, the high correlation ofFamily Size and Siblings potentially creates problems due to multicollinearity concerns when we include both in our specification at the same time. Therefore, we also present results obtained including only one variable at the time. We also include cross-sectional return dispersion in the previous month to exclude that our result just captures heterogeneity in fund performance unrelated to cross-trading activity.
44Theoretical models of internal capital markets support the view that high heterogeneity in the importance
of divisions within multi-division companies leads to the reallocation of resources either to subsidize weaker units or to support the stronger ones (Stein (1997), Stein and Scharfstein (2000)). Similarly, Gaspar, Massa, and Matos (2006) and Chaudhuri, Ivkovich, and Trzcinka (2012) argue that an asymmetry of “products” creates higher incentive to reallocate performance to successful funds and powerful clients. On the contrary, in homogenous families in which all funds have the same importance the incentive to shift performance is lower. In particular, fund complexes have a strong incentive to move performance from the cheapest funds to the funds charging the highest fees since outperformers attract disproportionate flows (Chevalier and Ellison (1997), Sirri and Tufano (1998), Agarwal, Gay, and Ling (2014)).
(8)), we find that asset managers with weak governance, a large number of affiliated funds and high heterogeneity in fees still price cross-trades at a higher deviation from benchmark
prices after 2004 (the negative coefficient of Family Size is just due to the high correlation
with Siblings). Our results therefore suggest that opportunistic pricing might still occur
(even though the execution shortall of cross-trades is significantly lower). Interestingly, in
unreported regressions we find that the e↵ect ofFees Gap on Execution Short f all is driven by
the second part of the sample. We conjecture that the dramatic growth of cheap passive funds and index trackers in the last 10 years increased the average dispersion and gap in fees, while o↵ering a large supply of liquidity providers to star funds. Some evidence in this direction is provided in the following section. A systematic investigation on the e↵ect of opportunistic performance reallocation on the performance of passive funds and index trackers is however left for future research.
IV.
Star Funds, Cross-trading, and Performance
Shifting
We believe that the evidence from trades provided in the previous section constitutes the most important and novel contribution of our paper. However, exploiting our identification of cross-trades we are able to shed some additional light on the ongoing debate on the incentives at the fund family level. A necessary caveat is in order, the structure of our data allows us to identify with high certainty the fraction of cross-trading activity at the asset manager level but not the exact identity of the trading counterparties. While this was not an issue in the previous section (as our analysis was conducted at the trade level), when we explore the e↵ect on family-level cross-trading on fund performance we are going to inevitably add significant noise to our analysis.
A. Methodology
In this section, we investigate whether fund families use mispriced cross-trades to boost the performance of star funds (see, e.g., Gaspar, Massa, and Matos (2006)) or subsidize the junk funds (see, e.g., Schmidt and Goncalves-Pinto (2013)). Our hypotheses derive from the literature that explores the incentives of multi-division companies to allocate scarce resources to the most successful units (picking winners) versus the least successful ones (in a socialistic framework that subsidizes the worst performers).
These two alternative hypotheses have opposite empirical predictions. According to the winner-picking hypothesis, cross-trading should increase the gap in performance between star and junk funds. Conversely, the subsidization hypothesis predicts that cross-trading reduces the spread in their performance. Importantly, cross-trading could decrease trading costs and, hence, improve funds’ performance even in the case of non-opportunistic transactions. How-ever, it should not be systematically correlated with the di↵erence in performance between star and junk funds.
Since we show that cross-trades are on average mispriced, performance must be trans-ferred between trading counterparties and this should be reflected into fund returns (unless the party who benefits from the cross-trade is random and deviations from benchmark prices average each other out). Our empirical strategy therefore consists, first, in defining groups of funds inside a family that we hypothesize are likely to benefit or su↵er from cross-trading and, second, in testing whether the di↵erence in returns correlates with cross-trading activity within the family.
Our approach relies on the methodology introduced in Gaspar, Massa, and Matos (2006).
Specifically, in our main tests we rank funds according to their monthly45 flows (see, e.g.,
Bhattacharya, Lee, and Pool (2013)). The reason for ranking funds according to their flows
is intuitive.46 Funds with outflows are liquidity demanders and funds with inflows are the
natural liquidity suppliers. On the one hand, under a subsidization strategy star funds can
45We focus on monthly observations because we cannot compute f lows at the daily level. 46Ranking funds on net fees gives however qualitatively similar results.
buy securities at inflated prices from the liquidity-demanding funds thereby increasing the performance of the junk funds at their expenses. On the other hand, under a winner-picking strategy, star funds can buy securities at deflated prices from the liquidity-demanding funds
(that are likely to be shut down anyway), increasing their own performance.47
Having ranked the funds, we then sort them into terciles for each family.48 Funds in
the intermediate tercile are discarded. From the two extreme terciles we construct pairwise combinations matching funds from the top tercile with funds in the bottom tercile, and we compute the spread in their style-adjusted performance (four-factor alpha). In order to control for style e↵ects we impose as an additional restriction that the two funds operate in the same investment style.
For instance, consider a family having six funds with the same investment style and
assume that in montht the funds all have di↵erent flows. This implies a ranking from 1 to 6
and two funds in each tercile. For our analysis we discard the funds ranked third and fourth and we build the return spread from the remaining funds. Specifically, the observations in our final sample would be the di↵erence of performance between fund 5 and fund 1, fund 5 and fund 2, fund 6 and fund 1, fund 6 and fund 2.
To understand how cross-trading shifts performance across siblings, we regress the spread in performance between funds in the top tercile and bottom tercile on the percentage of cross-trading activity, controlling for family characteristics and observable di↵erences between the two funds. Formally:
rStari,t rJunkj,t =b(CT%f ,t) +G0Xi, j,t+gt+gi, j+ei, j,t, (4)
47An alternative approach would be to sort funds on gross fees (i.e., asset under managementx percentage
fees), since the remuneration of mutual funds almost entirely consists of fees on asset under management (Haslem (2010)). However, it is very difficult to subsidize large funds using cross-trades since the amount of performance transferred would need to be large. Since we find most of the mispricing to be in illiquid stocks, we recognize that it would be highly unlikely to boost the performance of large funds using such transactions. Hence, we focus on the “hot” funds, i.e., funds that attract the most new money within the family. To favor such funds makes economically sense as flows respond disproportionally to positive performance and have positive spillovers to the rest of the family (Sirri and Tufano (1998), Nanda, Wang, and Zheng (2004), Basak, Pavlova, and Shapiro (2007)).