HAL Id: hal-00296211
https://hal.archives-ouvertes.fr/hal-00296211
Submitted on 3 May 2007
HAL is a multi-disciplinary open access
archive for the deposit and dissemination of
sci-entific research documents, whether they are
pub-lished or not. The documents may come from
teaching and research institutions in France or
abroad, or from public or private research centers.
L’archive ouverte pluridisciplinaire HAL, est
destinée au dépôt et à la diffusion de documents
scientifiques de niveau recherche, publiés ou non,
émanant des établissements d’enseignement et de
recherche français ou étrangers, des laboratoires
publics ou privés.
concentrations, chemistry and number size distribution
of urban fine aerosols in Milan, Barcelona and London
S. Rodríguez, R. van Dingenen, J.-P. Putaud, A. Dell’Acqua, J. Pey, X.
Querol, A. Alastuey, S. Chenery, K.-F. Ho, R. Harrison, et al.
To cite this version:
S. Rodríguez, R. van Dingenen, J.-P. Putaud, A. Dell’Acqua, J. Pey, et al.. A study on the relationship
between mass concentrations, chemistry and number size distribution of urban fine aerosols in Milan,
Barcelona and London. Atmospheric Chemistry and Physics, European Geosciences Union, 2007, 7
(9), pp.2217-2232. �hal-00296211�
Atmos. Chem. Phys., 7, 2217–2232, 2007 www.atmos-chem-phys.net/7/2217/2007/ © Author(s) 2007. This work is licensed under a Creative Commons License.
Atmospheric
Chemistry
and Physics
A study on the relationship between mass concentrations, chemistry
and number size distribution of urban fine aerosols in Milan,
Barcelona and London
S. Rodr´ıguez1,2,3,*, R. Van Dingenen1, J.-P. Putaud1, A. Dell’Acqua1, J. Pey3, X. Querol3, A. Alastuey3, S. Chenery2, K.-F. Ho5, R. Harrison4, R. Tardivo6, B. Scarnato7, and V. Gemelli7
1European Commission – DG Joint Research Centre, Institute for Environment and Sustainability, T.P. 290, Ispra (VA) 21020,
Italy
2British Geological Survey, Keyworth, Nottingham, NG12 5GG, UK
3Institute of Earth Science “Jaume Almera”, CSIC, Sol´e i Sabar´ıs, S/N, 08028, Barcelona, Spain
4University of Birmingham, Division of Environmental Health and Risk Management, Edgbaston, Birmingham B15 2TT, UK 5Hong Kong Polytechnic University, Department of Civil and Structural Engineering, TU418, Hung Hom, Kowloon, Hong
Kong
6Politecnico di Milano, Piazza Leonardo da Vinci, 32-20133 Milan, Italy 7ARPA-Lombardia, Viale Francesco Restelli, 3/1, 20124 Milan, Italy
*currently at: University of Huelva (Spain) at the Iza˜na Atmospheric Observatory, INM-CSIC, La Marina 20, 6a planta,
38071, Santa Cruz de Tenerife, Canary Islands, Spain
Received: 3 November 2006 – Published in Atmos. Chem. Phys. Discuss.: 16 January 2007 Revised: 16 April 2007 – Accepted: 16 April 2007 – Published: 3 May 2007
Abstract. A physicochemical characterization, including aerosol number size distribution, chemical composition and mass concentrations, of the urban fine aerosol captured in MILAN, BARCELONA and LONDON is presented in this article. The objective is to obtain a comprehensive picture of the microphysical processes involved in aerosol dynamics during the: 1) regular evolution of the urban aerosol (daily, weekly and seasonal basis) and in the day-to-day variations (from clean-air to pollution-events), and 2) the link between “aerosol chemistry and mass concentrations” with the “num-ber size distribution”.
The mass concentrations of the fine PM2.5 aerosol
ex-hibit a high correlation with the number concentration of >100 nm particles N>100 (nm) (“accumulation mode par-ticles”) which only account for <20% of the total num-ber concentration N of fine aerosols; but do not correlate with the number of <100 nm particles (“ultrafine particles”), which accounts for >80% of fine particles number con-centration. Organic matter and black-carbon are the only aerosol components showing a significant correlation with the ultrafine particles, attributed to vehicles exhausts emis-sions; whereas ammonium-nitrate, ammonium-sulphate and also organic matter and black-carbon correlate with N>100 (nm) and attributed to condensation mechanisms, other par-Correspondence to: S. Rodr´ıguez
(srodriguez@inm.es)
ticle growth processes and some primary emissions. Time series of the aerosol DpN diameter (dN/dlogD mode), mass PM2.5 concentrations and number N>100 (nm)
concentra-tions exhibit correlated day-to-day variaconcentra-tions, which point to a significant involvement of condensation of semi-volatile compounds during urban pollution events. This agrees with the observation that ammonium-nitrate is the component ex-hibiting the highest increases from mid-to-high pollution episodes, when the highest DpN increases are observed. The results indicates that “fine PM2.5 particles urban
pol-lution events” tend to occur when condensation processes have made particles grow large enough to produce signifi-cant number concentrations of N>100 (nm) (“accumulation mode particles”). In contrast, because the low contribution of ultrafine particles to the fine aerosol mass concentrations, high “ultrafine particles N<100(nm) events” frequently oc-curs under low PM2.5 conditions. The results of this study
demonstrate that vehicles exhausts emissions are strongly in-volved in this ultrafine particles aerosol pollution.
1 Introduction
Atmospheric aerosol (or particulate matter-PM) is now one of the air pollutants of most concern owing to its ability to influence climate, its adverse effects on human health and
the difficulties in controlling their emissions (e.g. Wichmann et al., 2000; Sun et al., 2005; IPCC, 2001). Studies on ur-ban fine atmospheric aerosol are a growing interest as: 1) the aerosol characterisation is difficult because it is made up of a complex mixture of solid and liquid substances (some of them semi-volatile) with a large range in particle size and 2) the still poorly characterised links between “urban and re-gional air quality” and “climate change”.
This concern on the aerosol pollution effects has prompted several studies focused on the physical and chemical charac-terisation of aerosols throughout Europe (e.g. Ruuskanen et al., 2001; Wehner and Wiedensohler, 2003; Laakso et al., 2003; Hussein et al., 2004; Kulmala et al., 2004; Van Din-genen et al., 2004; Putaud et al., 2004; Querol et al., 2004; G¨otschi et al., 2005; Rodr´ıguez et al., 2006). The studies cen-tred on the urban aerosol physical properties have provided very valuable information on the aerosol sources and evo-lution in terms of “number size distribution” (e.g. Wehner and Wiedensohler, 2003; Hussein et al., 2004). Moreover, the studies focused on the aerosol chemical characterisation, mass-closure and source apportionment, have shown that, in Europe, fine PM2.5 particles are mainly constituted (in
terms of mass concentrations) by primary (organic matter and black-carbon) and secondary (organic matter, sulphate, nitrate and ammonium) matter linked to combustion emis-sions, and also by mineral dust and sea salt (e.g. Putaud et al., 2004; Querol et al., 2004; G¨otschi et al., 2005; Rodr´ıguez et al., 2006). Although the number of such studies on the aerosol chemistry and physic is significant, these parameters and factors have been mostly studied separately, i.e. in un-connected contexts. Because of this, although the sources and composition of fine particles are being better understood (except the biogenic contribution to organic matter; e.g. Jan-son et al., 2001), there are still significant uncertainties. The involvement of the different microphysical processes that in-fluence aerosol dynamics (i.e. nucleation, coagulation, con-densation, evaporation, etc. . . ), in “urban and regional fine aerosol pollution events”, has not been deeply characterized. In order to contribute to reducing the uncertainties, a study on fine aerosols chemical composition, mass concentrations and number size distribution in three cities of Western Europe MILAN, BARCELONA & LONDON has been conducted. The objectives are: 1) to provide a comprehensive picture on the involvement of the above cited microphysical processes in the regular daily, weekly and seasonal evolution of the urban aerosol, and 2) to study the microphysical processes leading to high mass concentration episodes by linking the aerosol chemistry with the changes in the number size dis-tribution. For this purpose, the data set from each study city was analysed in detail. Despite the size of the database and because data reduction methods have been avoided to min-imise information loss, the set of analysis performed pro-vided a large volume of results. The current report aims to synthesize the key findings, in order to provide a general overview of fine urban aerosols. Finally, the implications of
the study findings for the authors’ “view” of urban aerosol pollution are discussed.
2 Study regions
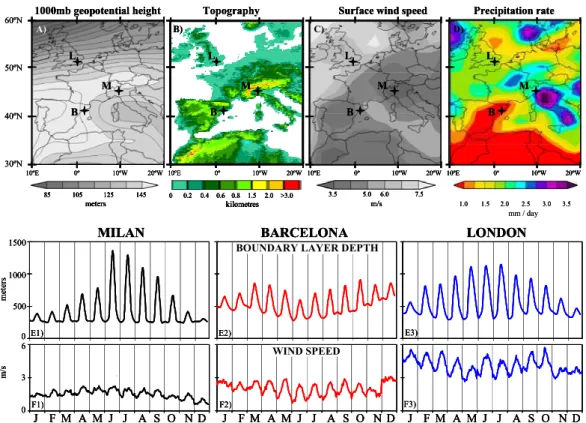
The factors affecting the transport and dispersion of pollu-tants in Western Europe, as well as the aerosol composition, varies significantly from south to north (Mill´an et al., 2002; Rodr´ıguez et al., 2006). The three cities selected for this study are representative of some of these differences (Fig. 1). LONDON is located within a meteorological context favouring the frequent renovation of air masses. This is due to the relatively flat terrain, the predominant mean westerly winds and frequent passages of cold fronts and depressions resulting in rain (Fig. 1). These are the predominant con-ditions north of the Alps and Pyrenees. In contrast, the ar-eas surrounding the Western Mediterranean basin are char-acterised by an abrupt topography, which coupled with the characteristic synoptic scale patterns, results in low mean wind speeds and regional circulations that hinder the air mass renovations and favour the accumulation of aerosols in the surroundings of emission regions (Fig. 1).
BARCELONA is within a region where meteorological conditions support the occurrence of high background lev-els of PM due to: 1) the predominant meteorology of weak gradient conditions and regional recirculations favouring re-gional pollution events; 2) the low precipitation rates in the region (the lowest of Europe) increasing the residence time of aerosols; 3) an enhancement of the mineral dust resuspen-sion processes in cities (by road traffic) due to scarce road cleaning and low precipitation rates, and in rural areas due to the arid soils.
MILAN is within the bottom of the Po valley, where in-tense urban pollution events are favoured by the very low wind speed and the frequent occurrence of inversion layers near the ground in winter.
These differentiated conditions in the three cities are clearly evidenced in the local meteorological variables, such as in-situ wind speed (Fig. 1f) and the boundary layer depth (BLD; Fig. 1e). For example, observe how in summer the BLD maximises in Milan and London because of the ther-mal convective activity; whereas in Barcelona it exhibits a minimum owing to the subsidence over the coast, in turn, because of the vertical recirculation of air masses along the coastal ranges (resulting in a decrease in the “thickness of the in-land sea breeze layer”).
Saharan dust transport is another factor that differentiates the Mediterranean aerosol composition, as this occurs with a much higher frequency in southern than in central-northern Europe.
S. Rodr´ıguez et al.: Mass, chemistry and number size distribution of urban aerosols 2219 mm / day 30ºN 40ºN 50ºN 60ºN 0º 10ºW 20ºW 10ºE C) Topography 1000mb geopotential height A) Precipitation rate kilometres 0 0.2 0.4 0.6 0.8 1.5 2.0 >3.0 85 105 125 145 meters 7.5 6.0 3.5 5.0 m/s 1.0 1.5 2.0 2.5 3.0 3.5
Surface wind speed
0º 10ºW 20ºW
10ºE 10ºE 0º 10ºW 20ºW 10ºE 0º 10ºW 20ºW
D) B) B M L B M L B M L B M L 0 1000 0 1500 500 m /s LONDON MILAN 3 6 0 m et er s
BOUNDARY LAYER DEPTH BARCELONA WIND SPEED M J A J A S O N D F M J M J A J A S O N D F M J M J A J A S O N D F M J F1) E1) F3) E3) F2) E2) mm / day 30ºN 40ºN 50ºN 60ºN 0º 10ºW 20ºW 10ºE C) Topography 1000mb geopotential height A) Precipitation rate kilometres 0 0.2 0.4 0.6 0.8 1.5 2.0 >3.0 85 105 125 145 meters 7.5 6.0 3.5 5.0 m/s 1.0 1.5 2.0 2.5 3.0 3.5
Surface wind speed
0º 10ºW 20ºW
10ºE 10ºE 0º 10ºW 20ºW 10ºE 0º 10ºW 20ºW
D) B) B M L B M L B M L B M L 30ºN 40ºN 50ºN 60ºN 0º 10ºW 20ºW 10ºE 0º 10ºW 20ºW 10ºE C) Topography 1000mb geopotential height A) Precipitation rate kilometres 0 0.2 0.4 0.6 0.8 1.5 2.0 >3.0 85 105 125 145 meters 7.5 6.0 3.5 5.0 m/s kilometres 0 0.2 0.4 0.6 0.8 1.5 2.0 >3.0 kilometres 0 0.2 0.4 0.6 0.8 1.5 2.0 >3.0 85 105 125 145 meters 85 105 125 145 meters 7.5 6.0 3.5 5.0 m/s 7.5 6.0 3.5 5.0 m/s 1.0 1.5 2.0 2.5 3.0 3.5
Surface wind speed
0º 10ºW 20ºW
10ºE 0º 10ºW 20ºW
10ºE 10ºE10ºE 0º0º 10ºW10ºW 20ºW20ºW 10ºE10ºE 0º0º 10ºW10ºW 20ºW20ºW
D) B) B M L B M L B M L B M L B M L B M L B M L B M L 0 1000 0 1500 500 m /s LONDON MILAN 3 6 0 m et er s
BOUNDARY LAYER DEPTH BARCELONA WIND SPEED M J A J A S O N D F M J M J A J A S O N D F M J M J A J A S O N D F M J F1) E1) F3) E3) F2) E2) 0 1000 0 1500 500 m /s LONDON MILAN 3 6 0 m et er s
BOUNDARY LAYER DEPTH BOUNDARY LAYER DEPTH
BARCELONA WIND SPEED WIND SPEED M J A J A S O N D F M J F M A M J J A S O N D J M J A J A S O N D F M J F M A M J J A S O N D J M J A J A S O N D F M J F M A M J J A S O N D J F1) E1) F3) E3) F2) E2)
Figure 1
μ μ μ μFig. 1. Maps of topography and 2000–2005 climatology of several meteorological fields over Europe (A–D) and daily mean evolution per
month during 2004 of the Boundary Layer Depth and in-situ wind speed (E–F) at London (L), Barcelona (B) and Milan (M).
3 Methodology
This study was performed in “central urban back-ground sites” of MILAN (Via-Messina; 45◦29′03.29′′N, 9◦10′21.63′′E, 130.75 m above the sea level, m a.s.l.), BARCELONA (Institute “Jaume Almera” – CSIC; 41◦23′5′′N, 2◦7′9′′E, 63.40 m a.s.l.) and LONDON (Bloomsbury; 51◦31′20.50′′N, 0◦7′32.84′′E, 32.91 m a.s.l.). The measurement site in: 1) MILAN is located into a large area where the access is restricted (in the fire brigade station); 2) BARCELONA is located over the roof of a 2 floors building in the university campus, and 3) LONDON is located in a small park in Russell Square.
3.1 Aerosol chemical characterization
Sampling of PM2.5(24-h sampling) was performed on quartz
filters once every 4 days using DIGITEL™ high volume samplers. After filter conditioning, mass concentrations were determined by gravimetry. The concentrations of non-sea-salt-SO=
4, NO
−
3, NH
+
4, sea salt (Na+Cl+sea-salt-SO
=
4),
min-eral dust (Al2O3+SiO2+Ca+CO=3+Ti+Fe+Sr), organic
mat-ter (OM=1.6*OC), black carbon (BC) and some trace el-ements, were determined by ion chromatography, thermal-optical-reflectance, ICP-AES, ICP-MS and some indirect de-terminations as described by Querol et al.(2001) and Cao et
al. (2004). A total of 96, 94 and 65 PM2.5 samples from
MILAN, BARCELONA & LONDON were analysed in this 1-year study, respectively.
3.2 Aerosol physical characterization
Aerosol number size distribution measurements were performed by using a Differential Mobility Analyzer (model 3071 of TSI™) connected to Condensation Particles Counter (model 3022 of TSI™). The particles size distribu-tion measurements were performed in the Differential Mo-bility Particle Sizer mode between 10 and 800 nm by using custom software at MILAN and BARCELONA, whereas at LONDON these were performed in the Scanning Mobility Particle Sizer mode between 10 and 415 nm by using the TSI™ software.
Gravimetric equivalent hourly mass concentrations of PM2.5were determined by multiplying the hourly
concentra-tions of the aerosol volume (in MILAN), OPC-GRIMM™ PM2.5 (in BARCELONA) and TEOM™ PM2.5 (in
LON-DON) by factors (slope of the linear relationships) ob-tained by cross correlating the aerosol volume (MILAN), the “GRIMM™” PM2.5(in BARCELONA) and the “TEOM™”
PM2.5 (in LONDON) versus the PM2.5 concentrations
de-termined by the filter sampling. Factors (slopes) equals to 1.44 (r2=0.82; gravimetric versus DMA-volume) at MILAN,
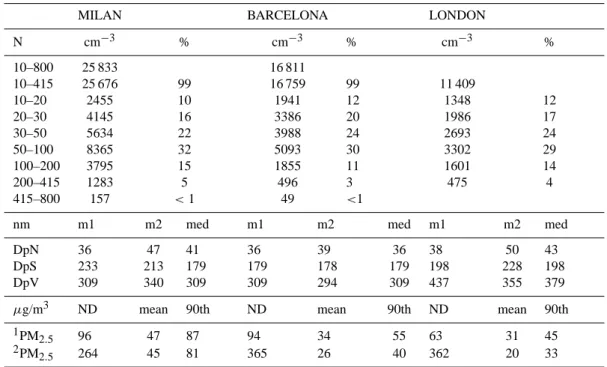
Table 1. Aerosol number (N) and mass (PM2.5) concentrations statistic at MILAN (November 2003–December 2004), BARCELONA
(November 2003–December 2004) and LONDON (April 2004–April 2005 for PM2.5and January–December 2003). DpN, DpS, DpV: mode
of the number, surface and volume size distribution. m1: mode of the mean size distribution, m2 and med.: mean and median of all hourly values of the size distribution modes. ND: number of daily mean data used for the calculations.1PM2.5: values calculated from sampling on
filter,2PM2.5: values computed from continuous measurements after correcting for gravimetric equivalence.
MILAN BARCELONA LONDON
N cm−3 % cm−3 % cm−3 % 10–800 25 833 16 811 10–415 25 676 99 16 759 99 11 409 10–20 2455 10 1941 12 1348 12 20–30 4145 16 3386 20 1986 17 30–50 5634 22 3988 24 2693 24 50–100 8365 32 5093 30 3302 29 100–200 3795 15 1855 11 1601 14 200–415 1283 5 496 3 475 4 415–800 157 <1 49 <1
nm m1 m2 med m1 m2 med m1 m2 med
DpN 36 47 41 36 39 36 38 50 43
DpS 233 213 179 179 178 179 198 228 198
DpV 309 340 309 309 294 309 437 355 379
µg/m3 ND mean 90th ND mean 90th ND mean 90th
1PM
2.5 96 47 87 94 34 55 63 31 45
2PM
2.5 264 45 81 365 26 40 362 20 33
1.45 (r2=0.75; gravimetric versus OPC) at BARCELONA and 1.62 (r2=0.74; gravimetric versus TEOM™) at LON-DON were obtained. These factors (slopes) are not directly comparable, as different techniques were used for the contin-uous aerosol measurements (x-axis values) at each site.
At MILAN and BARCELONA, these measurements were performed from November 2003 to December 2004. At LONDON, the number size distribution was measured from January to December 2003, whereas the chemical character-ization was performed from April 2004 to April 2005.
4 Results and discussion
The results are presented in several specific sections fo-cussing the main questions that prompted this study. Some of the figures that will be shown in the following sections provide a high density of information due to the avoidance of data reduction resulting in information loss. The discus-sion will focus only on the most relevant points and mainly on aerosol features common at the three sites.
4.1 Mean physical properties
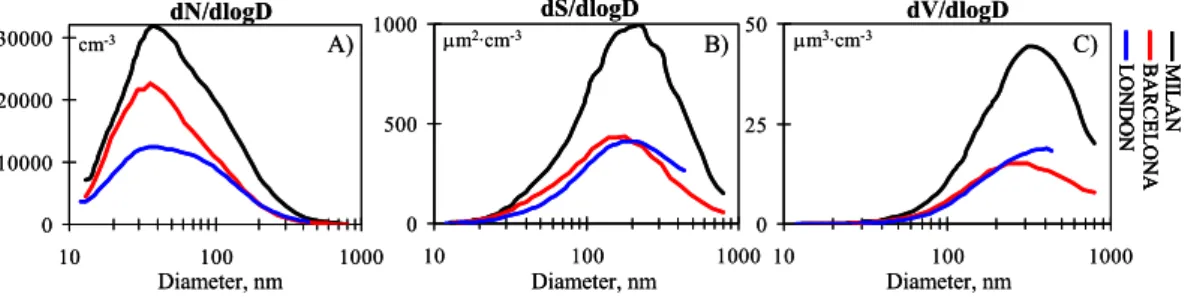
Table 1 and Fig. 2 show the mean PM2.5 and number
con-centrations, as well as the mean size distributions at the
three study sites. Annual mean concentrations of PM2.5,
N>10 (nm) and N10–100 at the three sites are within the range of typical values across Western Europe (Ruuska-nen et al., 2001; Van Dinge(Ruuska-nen et al., 2004), PM2.5: 20–
45 µg/m3, N>10 (nm): 10–25×103cm−3 and N10–100:
10–20×103cm−3. N10–415 accounts for ∼99% of N>10
(nm), whereas the ultrafine fraction N10–100 accounts for 80–85% of N>10 (nm) at the 3 sites. The MILAN & BARCELONA to LONDON ratios for PM2.5, N>10 (nm)
and N10–100 are equal to 2.3, 2.2, 2.3 and 1.3, 1.5, 1.5, re-spectively. The mode of the number (DpN: ∼37 nm); sur-face (DpS: 180–230 nm) and volume (DpV: 300–440 nm) size distributions exhibits the well known displacement to-ward coarser fractions.
4.2 Mean chemical composition
Table 2 shows the mean chemical composition of PM2.5.
The “most to less” important PM2.5contributors are: 1) OM
(28–31% of PM2.5), 2) NO−3 at MILAN (21%) &
LON-DON (11%) and nss-SO=
4 at BARCELONA (14%), 3)
nss-SO=
4 at MILAN (10%) & LONDON (9%) and NO
−
3 at
BARCELONA (10%), 4) NH+4 (10% at MILAN and 6–7% at BARCELONA & LONDON), and 5) BC (6–7%). Min-eral dust concentrations are much higher at BARCELONA (4.6 µg/m3)than at the other sites (1.7 µg/m3at MILAN &
S. Rodr´ıguez et al.: Mass, chemistry and number size distribution of urban aerosols 2221 dS/dlogD dV/dlogD C) dN/dlogD B) A) μm3·cm-3 cm-3 μm2·cm-3 Diameter, nm Diameter, nm Diameter, nm L O N D O N B A RCE L O N A M IL A N 0 10000 20000 30000 10 100 1000 0 500 1000 10 100 1000 0 25 50 10 100 1000 dS/dlogD dV/dlogD C) dN/dlogD B) A) μm3·cm-3 cm-3 μm2·cm-3 Diameter, nm Diameter, nm Diameter, nm L O N D O N B A RCE L O N A M IL A N L O N D O N L O N D O N B A RCE L O N A B A RCE L O N A M IL A N M IL A N 0 10000 20000 30000 10 100 1000 0 500 1000 10 100 1000 0 25 50 10 100 1000
Figure 2
Fig. 2. Mean size distribution of aerosol number, surface and volume concentrations during the 1-year study period.
Table 2. Statistic of PM2.5composition based on 96, 94 and 65 samples collected in MILAN, BARCELONA and LONDON from December 2003 to December 2004, December 2003 to December 2004, and April 2004 to April 2005, respectively. Trace elements: sum of Zn, V, Cr, Co, Ni, Cu, As, Cd and Pb.
MILAN BARCELONA LONDON
mean 90th mean 90th mean 90th
µg/m3 % µg/m3 µg/m3 % µg/m3 µg/m3 % µg/m3 PM2.5 47.0 86.8 34.3 54.5 31.0 45.5 OM 14.8 31 32.3 9.7 28 14.8 9.0 29 14.3 BC 1.8 4 2.9 1.9 6 2.8 1.6 5 2.5 NO−3 10.1 21 23.4 3.5 10 8.0 3.5 11 9.3 nss-SO=4 4.6 10 8.4 4.6 14 9.1 2.8 9 5.5 NH+4 4.8 10 10.0 2.2 6 4.7 2.1 7 5.9 OM+BC 16.5 35 34.7 11.6 34 18.1 10.6 34 15.7 SIC 19.4 41 39 10.4 30 20 8.4 27 21.0 Mineral 1.7 4 3 3.7 11 8 0.6 2 0.9 Sea-salt 0.2 0.4 0.4 0.7 2.2 1 0.7 2.1 1.7 Trace 0.1 0.2 0.2 0.1 0.4 0 0.04 0.1 0.1 P chemistry 38 27 20 %Determined 81 77 66
0.6 µg/m3 at LONDON), whereas nss-SO=
4 concentrations
are much lower in LONDON (2.8 µg/m3)than in the other sites (4.6 µg/m3).
The difference of the concentrations of PM2.5,
NO−3, OM and NH+4 “Milan minus Barcelona” (1) and “Milan minus London” (1) fit very well to the equation: “15 µg1PM2.5/m3=7.0 µg1NO−3/m3
+5.5 µg1OM/m3+2.5 µg1NH+4/m3” (for each of these differences: “Milan–Barcelona” and “Milan– London”). This indicates that the PM2.5
con-centrations at Milan are 15 µg/m3 higher than in Barcelona or London because of a mean contribution of 7.0 µgNO−3/m3+5.5µgOM/m3+2.5µgNH+4/m3.
4.3 Aerosol daily evolution
The processes involved in the daily evolution of aerosols have been studied by performing the following analyses: 1) the daily evolution of the hourly mean values of the “road
traffic intensity”, “primary trace gases concentrations (CO, NOxand SO2)” and “several aerosols parameters (including
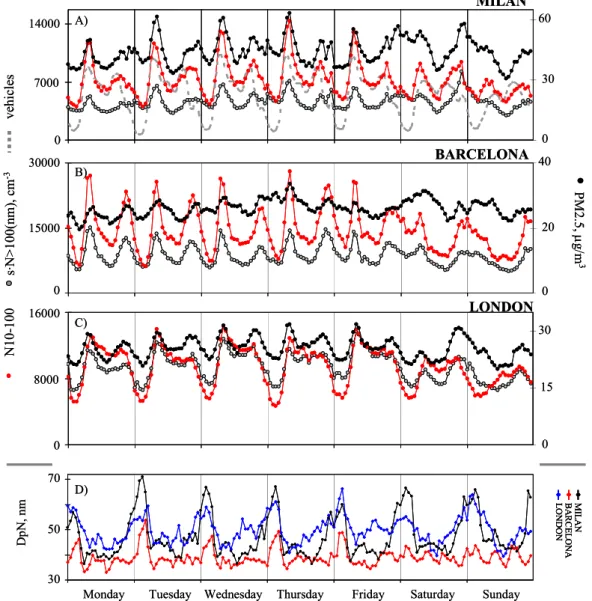
the size distribution mode, mass concentrations and number concentration in several size ranges)” during every day of the week (Fig. 3, note: gases are not include in this graph); 2) calculation of the ratio increase in the aerosol concen-trations from the “nocturnal background (02:00–05:00)” to the “morning rush hours (06:00–08:00)” and to the whole “daylight period (06:00–18:00)” for the mass concentrations and for the number concentrations in several size ranges (Fig. 4); 3) calculation of the correlation coefficient between the weekly evolution of the concentrations of aerosol mass, aerosol number (in several size ranges) and trace gases linked to combustions emissions (Fig. 5). The following discussion is based on the results plotted in Figs. 3–5.
All metrics of the aerosol concentration exhibit a maxi-mum during the morning rush hours of the working days due to vehicles exhaust emissions (Figs. 3a–c). These road traf-fic emissions result in a higher night-to-morning increase in
70 30 50 D p N , n m Sunday Monday Tuesday Wednesday Thursday Friday Saturday
BA RCE L O N A L O N D O N M IL A N 0 0 30 7000 0 15 D) P M 2 .5, μ g/ m 3 ve hi cl es s·N > 100( nm ), c m -3 N 10-100 60 0 30 14000 16000 8000 40 0 20 0 30000 15000 LONDON BARCELONA MILAN C) B) A) 70 30 50 D p N , n m Sunday Monday Tuesday Wednesday Thursday Friday Saturday
BA RCE L O N A L O N D O N M IL A N BA RCE L O N A L O N D O N M IL A N 0 0 30 7000 0 15 D) P M 2 .5, μ g/ m 3 ve hi cl es s·N > 100( nm ), c m -3 N 10-100 60 0 30 14000 16000 8000 40 0 20 0 30000 15000 LONDON BARCELONA MILAN C) B) A)
Figure 3
Fig. 3. Hourly mean values of the road traffic intensity (only at MILAN), the particles size distribution mode (DpN) and number N10–100,
N>100 (nm) and mass PM2.5concentrations. The number concentration N>100 (nm) is multiplied by a scale factor, s=2 at MILAN, =3 at
BARCELONA and =2 at LONDON. These averages are based on 1-year data.
the concentrations of ultrafine (<100 nm) than the >100 nm particles (Fig. 4). Observe in Fig. 4A1 how the “morning-rush hours” to “nocturnal-background” concentrations ra-tio is 1.5–3.0 for particles <50 nm and ≤1.5 for particles >200 nm. The same trend is observed for the increase from the “nocturnal-background” to the whole “daylight period” (Fig. 4B1). The DpN particle diameter (dN/dlogD mode) ex-hibits values within the ranges 30–45 nm during daylight and 50–70 nm at night (Fig. 3c). This daily evolution is the result of: 1) an abrupt DpN decrease in the morning because the sharp increase in vehicles exhausts emissions, 2) low DpN values during daylight owing to the contribution of photo-chemical nucleation particles, evaporation of semi-volatile compounds from the particle’s surface and the vehicle emis-sions (with a lower intensity than in the morning) and 3) a
strong nocturnal DpN increase due to the lack of significant emissions, particle growth because the effects of particles coagulation and condensation of semi-volatile species onto pre-existing particles. The daylight-to-night change in the ambient conditions influences this DpN daily evolution, by favouring evaporation during daylight (due to the increase in temperature and to the decrease of the gas-phase precursors concentrations owing to the dilution induced by the higher boundary layer depth; Fig. 1e) and condensation at night (due to ambient conditions opposites to the diurnal ones). Par-ticle growth by coagulation in short time scales (∼hours) is considered to be the most important process prompting the low residence time of particles (<50 nm) that were ob-served, and contribute to the above cited (Fig. 4) high “morn-ing rush hours” and “daylight” to “nocturnal-background”
S. Rodr´ıguez et al.: Mass, chemistry and number size distribution of urban aerosols 2223 concentrations ratios. After the evening rush hours, the
num-ber concentrations N10–20 and N10–100 experience a much more important decrease than N>100 (nm) owing to: 1) the growth of particles with an initial size <100 nm contributing to N>100 (nm), and 2) coagulation is not as important con-tributing factor for particles >100 nm. Moreover, deposition prompted by Brownian diffusion may also contributed sig-nificantly to decrease the number concentration of <50 nm particles, as shown by Gidhagen et al. (2005) during a mod-elling study in Stockholm.
The results from the current study are in agreement with other studies on aerosols “vehicles emissions” and “obser-vations in urban ambient air”. Studies on “emissions” have shown that, although the particles size distribution due to the vehicles exhauss emissions may experience variations (de-pending on the type of engine, fuel, lubricant and technology of the emissions control applied), they all tend to exhibit a main mode within the range 10–30 nm and other “carbona-ceous mode” within the range 50–200 nm (Kittelson, 1998; Harris and Maricq 2001; Casati et al., 2007). Being the main mode (10–30 nm) attributed to the nucleation of sul-phuric acid and some organic compounds during the emis-sion, dilution and cooling of the exhaust. These exhaust emissions are considered to be one of the major factors be-cause the “morning rush hours-to-night” concentrations ra-tio reach maximum values within the particle diameter range <50 nm, and exhibits a decreasing trend when increasing the particle diameter (Fig. 4A1). Other studies on “urban aerosol observations in ambient air” performed in Central and Northern European cities, such as Leipzig (Wehner et al., 2002; Wehner and Widensohler, 2003), Copenhagen (Ketzel et al., 2004) and Helsinki (Hussein et al., 2004), have also described the “working days-to-weekends” changes in the aerosol daily evolution and shifts in the size distribution de-tected, at Milan, Barcelona and London, in the current study. This analysis of the urban aerosol in the 3 study cites shows that:
1) the ultrafine particles N10–100 concentrations are much more sensitive to the “fresh vehicle exhaust emissions” than PM2.5. This is also valid for the total number concentration
N>10 (nm) due to the ultrafine fraction N10–100 accounting for a very high portion of N>10 (nm) (80–85%). Observe in Figs. 5B1–5D1 and 5B3–5D3 how N10–100 and N>10 (nm) exhibits a much higher correlation coefficient with the fresh N10–20 particles than with PM2.5and N>100 (nm).
2) the daily evolution of PM2.5 is mainly modulated
by the variations in the number concentrations of N>100 (nm). These variations in PM2.5 and N>100 (nm) are
smoother than those of the ultrafine particles because par-ticles >100 nm are mostly linked to the urban background aerosol. Observe in the Figs. 5A1 and 5A3 how the weekly evolution of PM2.5 is much better correlated with that of
N>100 (nm) than with that of dominant ultrafine N10–100 particles (Fig. 5), and in Fig. 3 how the above description for the particles >100 nm applies for PM2.5as well. This is
at-μ μ μ μ 1.0 2.5 1.5 2.0 1.0 2.5 1.5 2.0 N 10-2 0 N 200 -3 00 N 20-30 N30-50 PM 2. 5 N 4 15-80 0 N 100 -200 N 3 00-41 5 N 50-1 0 0 N 10 -100 N >1 00( n m ) B2) A2) B1) A1) daylight / night-background morning-rush / nocturnal-background conc en tr at ion s ra ti o L O N D O N M IL A N B A RCE L O N A N >10(nm ) 1.0 2.5 1.5 2.0 1.0 2.5 1.5 2.0 N 10-2 0 N 200 -3 00 N 20-30 N30-50 PM 2. 5 N 4 15-80 0 N 100 -200 N 3 00-41 5 N 50-1 0 0 N 10 -100 N >1 00( n m ) B2) A2) B1) A1) daylight / night-background morning-rush / nocturnal-background conc en tr at ion s ra ti o L O N D O N M IL A N BA R C E L O N A L O N D O N L O N D O N M IL A N M IL A N B A RCE L O N A B A RCE L O N A N >10(nm )
Figure 4
Fig. 4. “Morning rush hours (06:00–08:00) to nocturnal-background (02:00–05:00)” and “daylight (06:00–18:00) to night-background (02:00–05:00)” ratios of the aerosol PM2.5 mass and
number concentration in several size ranges during working days of the 1-year study period.
tributed to the fact that particles >100 nm contribute to the aerosol mass and volume to a greater extent than ultrafine particles (even though the later accounts for 80–85% of the total number of fine particles; Fig. 1).
3) the daily evolution of CO and NOx (mainly
con-trolled by vehicle exhaust emissions) correlates better with that of N>10 (nm) and N10–100 than with that of PM2.5
(Figs. 5A2–5D2), as vehicles exhausts mostly emit ultrafine particles.
4) only at LONDON there is a significant correlation be-tween the daily evolutions of SO2and particles number
con-centrations (Figs. 5A2–5D2). This is probably due to the in-fluence of other “non-vehicle exhaust emissions” sources on the SO2daily evolution in MLAN and BARCELONA (e.g.
power and industrial plants present in those cities). 4.4 PM2.5events
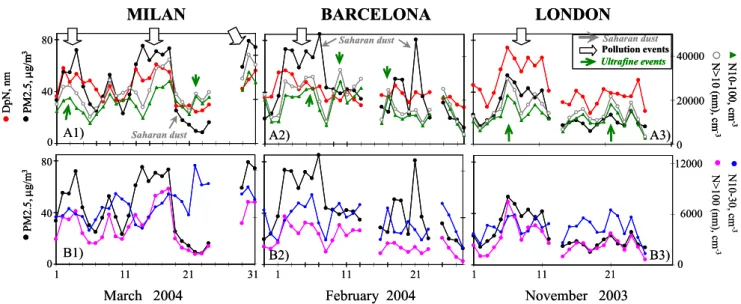
Figure 6 shows the “daily mean concentrations of PM2.5
and its most important contributors”, and the “hourly mean values of the aerosol size distribution mode (DpN), aerosol mass PM2.5 concentrations and aerosol number
concentra-tion in several size ranges” recorded during the whole study period. The objective of this section is to identify the mi-crophysical processes involved in the day-to-day changes of the aerosol features. For this purpose, the following analy-sis was applied to the data plotted in Fig. 6: 1) the occur-rence of “urban PM pollution episodes”, “Saharan dust out-breaks” and “clean air events” were identified on the basis of the meteorology coupled with analysing the time series of several aerosol parameters (as described in Rodr´ıguez et al., 2005; see some examples in Fig. 7); 2) the mean chemical composition and daily evolution of aerosols during events of
N 20-30 N 30-50 N 50-100 N 100-200 N 200-300 N 415-800 N 10-20 0.6 0.9 0.3 0.2 1.0 0.6 0.5 1.0 0.75 0.5 1.0 0.75 N10-20 vs. N>10 (nm) vs. C3) N10-100 vs. 0.9 0.3 0.0 0.6 0.9 0.3 0.0 0.6 0.9 0.3 0.0 0.6 0.9 0.3 0.0 0.6 N > 100( n m ) C O NO NO 2 0.9 0.3 0.6 0.9 0.3 0.6 0.9 0.3 0.6 0.9 0.3 0.6 S O 2 P M 2 .5 N 10-100 PM2.5 vs. C1) C2) A3) A1) A2) D3) D1) D2) B3) B1) B2)
co
rr
el
at
io
n c
o
ef
fi
ci
en
t
L O N D O N M IL A N BA R C E L O N A N 300-415 N > 10( n m ) N 20-30 N 30-50 N 50-100 N 100-200 N 200-300 N 415-800 N 10-20 0.6 0.9 0.3 0.2 1.0 0.6 0.5 1.0 0.75 0.5 1.0 0.75 N10-20 vs. N>10 (nm) vs. C3) N10-100 vs. 0.9 0.3 0.0 0.6 0.9 0.3 0.0 0.6 0.9 0.3 0.0 0.6 0.9 0.3 0.0 0.6 N > 100( n m ) C O NO NO 2 0.9 0.3 0.6 0.9 0.3 0.6 0.9 0.3 0.6 0.9 0.3 0.6 S O 2 P M 2 .5 N 10-100 PM2.5 vs. C1) C2) A3) A1) A2) D3) D1) D2) B3) B1) B2)co
rr
el
at
io
n c
o
ef
fi
ci
en
t
L O N D O N M IL A N B A R C E L O N A L O N D O N L O N D O N M IL A N M IL A N BA R C E L O N A BA R C E L O N A N 300-415 N > 10( n m )Figure 5
μ μ μμμ μμFig. 5. Correlation coefficient between the weekly cycles (Monday to Sunday daily cycles) of “PM2.5, N10–20, N10–100 and N>10 (nm)”
and those of “the aerosol PM2.5mass, number concentrations (in several size ranges) and gases”.
low (PM2.5<30th-percentile), mid (30th<PM2.5<80th) and
high (PM2.5>80th) mass PM2.5 concentrations was studied
(Fig. 8).
As expected, “low PM – clean air episodes” mostly oc-curred during high wind speed events, frequently associated with air masses renovation linked to cold front passages. “PM pollution episodes” were favoured by weak barimet-ric gradient conditions and anticyclonic situations, frequently associated with winter inversion layers near the ground at MILAN. “Saharan dust transport” occurred under other well known meteorological scenarios.
4.4.1 Urban PM pollution events
During periods dominated by concatenations of “urban pol-lution events” and “clean air-low PM episodes”, the daily mean PM2.5and DpN time series show significant correlated
variations, indicating that PM2.5 is made up of coarser
par-ticles during “pollution events” than under “clean air condi-tions”. Figure 7 (where the types of events are highlighted) shows some examples from the three studied cities, where it can be observed how DpN increases from 30 to ∼65 nm are associated with PM2.5increases from 20 to 80 µg/m3at
MILAN & BARCELONA and to 50 µg/m3 at LONDON,
from “clean air” to “urban pollution” events. Observe in Fig. 8 (where the mean chemical composition and daily evo-lution of aerosols under different polevo-lution degrees is shown) how the increase in the aerosol PM2.5 mass concentrations
throughout the sequence “low-mid-high” levels is associated with an increase in the nocturnal DpN values, leaving the diurnal DpN values relatively constant throughout the se-quence. This indicates that an increase in the aerosol PM2.5
mass concentrations is associated with an enhancement in the nocturnal particle growth described above (“daily evolution” section). A detailed event-to-event analysis corroborates this simultaneous DpN and PM2.5 correlated increases at night
during PM2.5episodes (examples of episodes not shown for
the sake of brevity).
Although both “particle coagulation” and “condensation of semi-volatile species onto pre-existing particles” may con-tribute to this nocturnal particle growth just as described above (Figs. 8a to c), only condensation may accounts for the observed simultaneous increase in the particle’s DpN di-ameter and mass PM2.5 concentrations. This condensation
of semi-volatile species is enhanced when temperature de-creases (e.g. winter vs. summer or night vs. daylight) and when reducing the “boundary layer depth” and “wind speed”.
S. Rodr´ıguez et al.: Mass, chemistry and number size distribution of urban aerosols 2225 50 150 50 LONDON BARCELONA MILAN 25 0 75 20 μ g/ m 3 50 0 μ g/ m 3 75 25 0 25 μ g/ m 3 0 10 μ g/ m 3 J F M A MJ J A S O ND D D J F M A MJ J A S O ND 2004 2004 nss-SO4= BC NH4+ NO3 -OM mineral dust PM2.5 A3) A2) A1) B3) B2) B1) C3) C2) C1) D3) D2)
D1) African dust African dust
J F N O S A J J M A D M 2005 2004
200 MILAN BARCELONA LONDON
0 μ g/ m 3 J F M A M J J A S O N D 2003 E3) E2) 100 E1) nm PM2.5 DpN 100000 30000 15000 N>100(nm) 0 150 0 50000 N10-100 (nm) 0 50 100 J F M A M J J A S O N D 2004 J F M A M J J A S O N D 2004 c m -3 c m -3 H3) H1) H2) F3) F1) F2) G3) G1) G2) 1.8 1.2 w/s= 1.0 5.5 2.6 0.7 6.3 1.5 1.2 7.8 1.8 w/s= 1.3 w/s= 2.4 3.1 1.3 1.3 1.3 1.3 0.7 1.2 w/s= 1.8 1.2 1.2 1.3 2.2 w/s= 1.0 w/s= 1.6 w/s= 1.9 1.3 2.0 w/s= 0.7 1.1 1.3 50 150 50 LONDON BARCELONA MILAN 25 0 75 20 μ g/ m 3 50 0 μ g/ m 3 75 25 0 25 μ g/ m 3 0 10 μ g/ m 3 J F M A MJ J A S O ND D D J F M A MJ J A S O ND 2004 2004 nss-SO4= BC NH4+ NO3 -OM mineral dust PM2.5 A3) A2) A1) B3) B2) B1) C3) C2) C1) D3) D2)
D1) African dust African dust
J F N O S A J J M A D M 2005 2004 50 150 50 LONDON BARCELONA MILAN 25 0 75 20 μ g/ m 3 50 0 μ g/ m 3 75 25 0 25 μ g/ m 3 0 10 μ g/ m 3 J F M A MJ J A S O ND D J F M A MJ J A S O ND D D J FD J F MM AA MMJJ JJ AA SS OO NNDD 2004 2004 nss-SO4= BC NH4+ NO3 -OM mineral dust PM2.5 A3) A2) A1) B3) B2) B1) C3) C2) C1) D3) D2)
D1) African dust African dust
J F N O S A J J M A D M 2005 2004 J F N O S A J J M A D M 2005 2004
200 MILAN BARCELONA LONDON
0 μ g/ m 3 J F M A M J J A S O N D 2003 J F M A M J J A S O N D 2003 E3) E2) 100 E1) nm PM2.5 DpN 100000 30000 15000 N>100(nm) 0 150 0 50000 N10-100 (nm) 0 50 100 J F M A M J J A S O N D 2004 J F M A M J J A S O N D 2004 J F M A M J J A S O N D 2004 J F M A M J J A S O N D 2004 c m -3 c m -3 H3) H1) H2) F3) F1) F2) G3) G1) G2) 1.8 1.2 w/s= 1.0 5.5 2.6 0.7 6.3 1.5 1.2 7.8 1.8 w/s= 1.3 w/s= 2.4 3.1 1.3 1.3 1.3 1.3 0.7 1.2 w/s= 1.8 1.2 1.2 1.3 2.2 w/s= 1.0 w/s= 1.6 w/s= 1.9 1.3 2.0 w/s= 0.7 1.1 1.3
Figure 6
Fig. 6. Daily mean concentrations of PM2.5and including its major contributors (A–D) and hourly mean concentrations of PM2.5 and the aerosol-number concentration in several size ranges (E–J). w/s = mean winter (November–February)/summer (May–August) concentrations ratio.
LONDON
BARCELONA
MILAN
0 0 40 80 40000 12000 1 11 21 1 11 21 31 1 11 21 20000 0 6000 0 40 80 D p N , n m P M 2. 5, μ g/ m 3 P M 2. 5, μ g/ m 3 N > 10 ( n m ), cm -3 N 1 0-100, c m -3 N > 10 0 ( n m ), cm -3 N 10-3 0 , c m -3 B2) A2) B3) A3) B1) A1) February 2004 March 2004 November 2003 Saharan dust Saharan dust Saharan dust Pollution events Ultrafine eventsLONDON
BARCELONA
MILAN
0 0 40 80 40000 12000 1 11 21 1 11 21 31 1 11 21 20000 0 6000 0 40 80 D p N , n m P M 2. 5, μ g/ m 3 D p N , n m P M 2. 5, μ g/ m 3 P M 2. 5, μ g/ m 3 P M 2. 5, μ g/ m 3 P M 2. 5, μ g/ m 3 N > 10 ( n m ), cm -3 N 1 0-100, c m -3 N > 10 ( n m ), cm -3 N 1 0-100, c m -3 N > 10 0 ( n m ), cm -3 N 10-3 0 , c m -3 B2) A2) B3) A3) B1) A1) February 2004 March 2004 November 2003 Saharan dust Saharan dust Saharan dust Pollution events Ultrafine events Ultrafine eventsFigure 7
Fig. 7. Daily mean values of the aerosol PM2.5mass concentrations, number concentrations (in several size ranges) and size distribution
mode (DpN) at the 3 study cities during selected periods when different types of aerosol episodes took place. Events of “Saharan dust”, “urban pollution” and “ultrafine particles” are highlighted (previous identification was performed by using the methodology described in Rodr´ıguez et al. (2005) and references therein).
This second case occurs because the lower dilution increases the concentration of gas-phase precursors favouring that these compounds easily exceed the equilibrium vapour pres-sure, i.e. supersaturation. The study data indicates that con-densation onto pre-existing particles of ammonium-nitrate at the three study sites (and some OM species at MILAN) are strongly involved in the particle growth from the “mid” to “high” PM2.5 events (when the highest “daylight-to-night”
DpN increase is observed; Fig. 8c) at the three study sites. This is supported by the following observations (Fig. 8):
1) ammonium and nitrate are the compounds exhibiting the highest increase from “mid” to “high” PM2.5 episodes
at the three sites, with “high/mid concentration” ratios=4.5 and 2.9 at MILAN & LONDON, and =3.5 and 2.5 at BARCELONA for nitrate and ammonium, respectively, and <2 for the other major components (except for OM at MI-LAN). This nocturnal formation of ammonium-nitrate, that would increase the particle diameter by condensation, has al-ready been documented (Weber et al., 2001; Alastuey et al., 2004).
2) the increase in the concentrations of OM from “mid” to “high” PM2.5episodes is much higher than that of BC at
MILAN (“high/mid” events ratios=3.1 for OM and 1.5 for BC) than at BARCELONA (1.5 for OM and 1.2 for BC) and LONDON (1.4 for OM and 1.1 for BC). Because the BC (a primary particle) increase is mainly attributed to the lower di-lution during poldi-lution episodes (because the lower “bound-ary layer depth”), the much higher OM increase at MILAN is attributed to condensation processes (secondary OM for-mation).
These results showing how the size distribution mode tend to increase when increasing the ammonium-nitrate and or-ganic matter concentrations in PM2.5, provides a
comple-mentary view on the urban PM pollution events usually reg-istered in winter across Europe (Putaud et al., 2004; Querol et al., 2004).
4.4.2 Saharan dust events
Although this study is not focused on characterising Saharan dust, this brief analysis have been included because the in-terest of Saharan dust transport as an air quality impairment agent. In southern Europe, it has been observed that these Sa-haran events result in high PM10concentrations (Rodr´ıguez
et al., 2006). This new data set provides a good opportunity to compare the Saharan dust inputs to PM2.5in northern and
southern regions of Western Europe.
The Saharan dust contributions to PM2.5 levels are
high-lighted in Fig. 6d: 4 events occurred in BARCELONA (over 94 filter samples), 3 events in MILAN (96 samples) and zero events in LONDON (65 samples). Mineral dust concentra-tions during these Saharan dust episodes were into the ranges 8–15 µg/m3in BARCELONA and 4–11 µg/m3in MILAN. These dust events did not resulted in any specific variation (or “signature”) in the particles size distribution or number con-centration. This is attributed to the fact that Saharan dust is present in much lower number concentrations than the urban aerosols, although it exhibits high mass concentrations in the supermicron fraction (because of its relatively high density). Observe in the Figs. 7A2–7B2 how during the Saharan dust events, the aerosol PM2.5mass concentrations experienced a
S. Rodr´ıguez et al.: Mass, chemistry and number size distribution of urban aerosols 2227
μ
μ
μμμ
μμ
Mid pollution degree PM2.5 Pollution events Clean Air events
PM2.5: 30-80th PM2.5 > 80th PM2.5 < 30th 0 5 40 80 P M 2. 5, µ g /m 3 D p N , n m 120 40 60 10 3·N 1 0-3 0 , N > 10 (nm ), N > 100 (nm ), N 1 0 -10 0, x 1 0 3 , c m -3 LONDON MILAN 0 40 60 20 0 40 20 BARCELONA 0 40 60 20 0 20 0 B2) C2) A2) B3) C3) A3) B1) C1) A1) 18 0 6 12 time of day 120 60 20 0 80 40 0 µ g/ m 3 40 60 20 0 40 18 0 6 12 time of day 18 0 6 12 time of day D3) D1) D2) >80th 30-80th <30th PM2.5 composition µ g/ m 3 µ g/ m 3 OM NO3 -NH4+ nss-SO4= BC ND mineral sea-salt trace
Mid pollution degree PM2.5 Pollution events Clean Air events
PM2.5: 30-80th PM2.5 > 80th PM2.5 < 30th 0 5 40 80 P M 2. 5, µ g /m 3 P M 2. 5, µ g /m 3 D p N , n m D p N , n m 120 40 60 10 3·N 1 0-3 0 , N > 10 (nm ), N > 100 (nm ), N 1 0 -10 0, x 1 0 3 , c m -3 3·N 1 0-3 0 , 3·N 1 0-3 0 , N > 10 (nm ), N > 10 (nm ), N > 100 (nm ), N > 100 (nm ), N 1 0 -10 0, N 1 0 -10 0, x 1 0 3 , c m -3 LONDON MILAN 0 40 60 20 0 40 20 BARCELONA 0 40 60 20 0 20 0 B2) C2) A2) B3) C3) A3) B1) C1) A1) 18 0 6 12 time of day 18 0 6 12 time of day 120 60 20 0 80 40 0 µ g/ m 3 40 60 20 0 40 18 0 6 12 time of day 18 0 6 12 time of day 18 0 6 12 time of day 18 0 6 12 time of day D3) D1) D2) >80th 30-80th <30th PM2.5 composition µ g/ m 3 µ g/ m 3 OM NO3 -NH4+ nss-SO4= OM NO3 -NH4+ nss-SO4= BC ND mineral sea-salt trace BC ND mineral sea-salt trace
Figure 8
Fig. 8. Daily mean evolution of several aerosol parameters (A–C) and mean PM2.5 aerosol chemical composition during events of “low
(<30th percentile)”, “mid (30–80th percentile)” and “high (>80th percentile)” PM2.5 concentrations in the 3 study sites. Panels (D): “ND”=Non-Determined (PM2.5– sum of chemistry), “trace” = trace elements (see Table 2), “mineral” = Mineral dust.
strong increase without any significant change in the number concentration.
4.5 Seasonal evolution
Some of the PM2.5 chemical components exhibited features
observed commonly across Europe (Figs. 6): 1) BC, OM and NO−
3 levels maximises in winter, 2) nss-SO
=
4 exhibits
higher background levels and a higher relative contribution in summer, and 3) nss-SO=
4 and NO
−
3 mainly occur as
ammo-nium salts (ionic balance analysis not shown). Moreover, the number concentration in all size ranges exhibits higher lev-els in winter than in summer (only shown for N<100 nm and N>100 (nm) in Fig. 6). This winter maximum in the particles “number concentration” and in the “mass BC, OM, NO−3 and NH+4 concentrations” is prompted by several mechanisms favouring “condensation” and “nucleation of the fresh vehi-cle exhaust emissions”, such as: 1) concentration of parti-cles and its gaseous precursors due to the lower “dilution” prompted by the “lower boundary layer depth”; 2) lower temperatures that reduce the “equilibrium vapour pressure”. This enhancement of the “condensation” processes in winter result in the “PM2.5 mass events” described above,
charac-terised by an increase in the “concentrations of PM2.5 and
N>100 (nm)” and in the “DpN size distribution” (Figs. 6, 7 and 8). In winter, OM and ammonium-nitrate were the most important PM2.5contributors; accounting for 75%, 50% and
47% of PM2.5 mass in winter (November–February) and
32%, 25% and 34% of PM2.5 in summer (June–August) at
MILAN, BARCELONA & LONDON, respectively. Con-versely, the increase in the number concentration due to an enhancement of the “nucleation rates in vehicles exhaust” when decreasing the temperature has been observed both in “emissions” and in “ambient air” studies. Casati et al. (2007) observed how the nucleation mode particle number concen-trations in the “vehicles exhaust” increases when decreas-ing the temperature. This is in agreement with Gidhagen et al. (2005) who observed, in Stockholm, that the slope of the particles number versus NOxconcentrations increased when
the ambient air temperature was decreasing.
The differences in the aerosol mean concentration and in the intensity of the winter maximum observed at the three studied cities are strongly related to the meteorolog-ical features described above (Fig. 1). The enhanced con-densation conditions at MILAN with respect to the other sites are favoured by: 1) lower winter temperatures, and 2) the much lower boundary layer depth (which increases the concentrations of the gaseous precursors) due to the frequent occurrences of winter temperature inversions lay-ers. This enhanced condensation may accounts for the: 1) larger summer-to-winter increase in OM, DpN and N>100 (nm) at MILAN than the other sites (see these ratios in the upper left corner of Figs. 6c, g, j), 2) much higher win-ter (∼9.5) than summer (∼5.8) OM/BC ratios at MILAN, whereas these ratios remains relatively constant from sum-mer to winter both at BARCELONA (∼5.2) and LONDON (∼5.6). Notice how the most important “summer-to-winter”
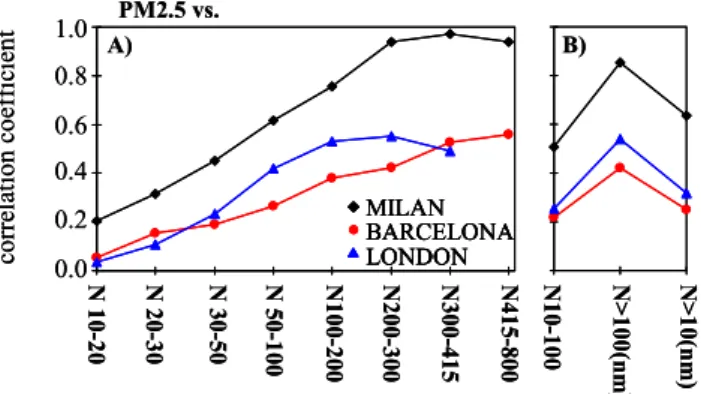
N 30 0-415 N 10 0-200 N > 1 0 (n m) N 30-5 0 N 20 0-300 N 20-3 0 N 10-2 0 N 50-1 0 0 0.0 0.4 0.6 0.8 1.0 0.2 PM2.5 vs. co rr el at io n c o ef fi ci en t BARCELONA LONDON MILAN N 41 5-800 N 10-10 0 N > 100 (n m) B) A) N 30 0-415 N 10 0-200 N > 1 0 (n m) N 30-5 0 N 20 0-300 N 20-3 0 N 10-2 0 N 50-1 0 0 0.0 0.4 0.6 0.8 1.0 0.2 PM2.5 vs. co rr el at io n c o ef fi ci en t BARCELONA LONDON MILAN BARCELONA BARCELONA LONDON LONDON MILAN MILAN N 41 5-800 N 10-10 0 N > 100 (n m) B) A) μ μ μ μ μ μ
Fig. 9. Correlation coefficient between the aerosol hourly “mass
PM2.5 concentrations” and “number concentration (in several size
ranges)” during the 1-year study period (each value obtained with more than 8000 hourly data).
and “daylight-to-night” DpN increases are observed in MI-LAN (Figs. 3c, 6h and 8), where the highest concentrations of semi-volatile components (ammonium-nitrate and uniden-tified OM species) are recorded. These results show how the content in semi-volatile species in PM2.5 also influences the
variability of the particles size distribution.
4.6 Relationship between PM2.5and number size
distribu-tion
In the examples shown in Fig. 7, it can be observed how the total number concentration N>10 (nm) also tend to increase from the “clean air” to the “urban pollution” events, fre-quently from <1×10⁴to >2×104cm−3. However, the
de-gree of correlation between PM2.5and the number
concentra-tion changes significantly depending on the particle size. Ob-serve how (Fig. 7): 1) N>100 (nm) and PM2.5exhibit
day-to-day correlated variations; 2) N10–100 may exhibit concen-trations equally high during both high and low PM2.5
centrations episodes; 3) N10–30 may reach even higher con-centrations during low rather than during high PM2.5
condi-tions. The relationship between the aerosol PM2.5mass
con-centrations and the number size distribution has been studied by: A) calculating and analysing the correlation coefficient between PM2.5and the number concentration in several size
ranges (Fig. 9); B) analysing the “scatter plots” of PM2.5
ver-sus the number concentration in several size ranges (Fig. 10), and 3) calculating and analysing the correlation coefficient between the main PM2.5chemical constituents and the
num-ber concentration in several size ranges (Fig. 11). The fol-lowing discussion is based on these analysis performed over the 1 year database.
As the particle mass increases with the particle size, the correlation between PM2.5 and number concentrations
in-creases with the particle diameter, from “r”<0.2 for 10– 20 nm to 0.6–1.0 for >400 nm (Fig. 9a). As consequence, PM2.5 correlates much better with N>100 (nm) (a fraction
which only accounts for a 15–20% of the total number con-centration N>10 (nm)) than with the dominant ultrafine frac-tion N10–100 (Fig. 9).
The correlation of most of the PM2.5components with the
number concentration increases with the particle diameter (Figs. 11c–k, this analysis is not available for LONDON). This is more clearly observed for secondary species such as nss-SO=
4, NO
−
3 and NH
+
4 (Fig. 11f, g and h), whose
gas-to-particle conversion rates onto the surface of pre-exiting parti-cles are favoured under the presence of partiparti-cles with a large surface (such as those >100 nm; Fig. 2b) in accordance with the Kelvin effect – equilibrium vapour pressure over a sphere increases when the sphere’s diameter decreases. In contrast, BC and OM exhibit high “r” values for both the ultrafine and >100 nm size fraction due to the primary vehicle emissions and the subsequent particle growth by coagulation and con-densation (Figs. 11d–e). Observe how BC and OM are the only components exhibiting a significant correlation with the ultrafine N10–100 particles (Figs. 11a–b). These size distri-butions of the correlation coefficients (Figs. 11c–k) resemble those of the chemical PM2.5 components obtained by
cas-cade impactor sampling (Putaud et al., 2004; Cabadas et al., 2004).
Because both the particle’s surface and mass increases with the particle’s diameter, the N>100 (nm) number, mass PM2.5 concentration and surface concentrations are
posi-tively correlated (Figs. 9, 10c–d). This indicates that: 1) an increase in N>100 (nm) results in an increase of the aerosol surface available for gas-to-particle transfer of matter by con-densation; 2) “urban PM2.5 pollution events” mostly occurs
when particles are grown enough to result in high N>100 (nm) values (e.g. by condensation onto the surface of pre-existing particles of ammonium-nitrate; Figs. 11f–h). Ob-serve in Fig. 7 how N>100 (nm) is the only particle size frac-tion that exhibits high concentrafrac-tions during PM2.5episodes.
4.7 PM2.5versus ultrafine particles events
The analysis described above (Figs. 7–11) also allowed study of the relationship between aerosol PM2.5mass and ultrafine
N10–100 particles events.
The relationship of the ultrafine N10–100 fraction (and its subsets) with PM2.5is more complex than the “simple
posi-tive correlation between PM2.5 and N>100 (nm)”. Observe
in Fig. 7 how N10–30, N10–100 and N>10 (nm) may ex-hibits high concentrations during both high and low PM2.5
events. According to the involvement of the different mi-crophysical processes on the relationship between PM2.5and
ultrafine particles, these events are distinguished as follows: A) Simultaneous high or low “PM2.5and N10–100 events”
are observed during concatenations of some “clean air” and “PM2.5 pollution” events (e.g. 1–7 and 29–31 March 2004
at MILAN, 1–9 February 2004 at BARCELONA or 1–12 November 2003 at LONDON; Fig. 7), when the previously discussed influence of meteorology results in the increase
S. Rodr´ıguez et al.: Mass, chemistry and number size distribution of urban aerosols 2229 0 P M 2. 5, μ g/ m 3 100000 0 4000 S, µm2·cm-3 L O N D O N M IL A N BA RCE L O N A 0 200 100 P M 2. 5, μ g/ m 3 100 120 0 60 50 P M 2. 5 , μ g/ m 3 10000 5000 0 N10-20, cm-3 50000 0 15000 N10-100, cm-3 (D3 (D2 (D1 (A3 (A2 (A1 (B3 (B2 (B1 30000 0 2000 (C3 (C2 (C1 N>100(nm), cm-3 fresh-PM age d-P M 0 P M 2. 5, μ g/ m 3 100000 0 4000 S, µm2·cm-3 L O N D O N M IL A N BA RCE L O N A 0 200 100 P M 2. 5, μ g/ m 3 100 120 0 60 50 P M 2. 5 , μ g/ m 3 10000 5000 0 N10-20, cm-3 50000 0 15000 N10-100, cm-3 (D3 (D2 (D1 (A3 (A2 (A1 (B3 (B2 (B1 30000 0 2000 (C3 (C2 (C1 N>100(nm), cm-3 fresh-PM age d-P M
Figure 10
Fig. 10. Hourly mean aerosol PM2.5 mass concentrations versus number concentrations (in several size ranges) during the 1-year study period. μ μ μ μ μ μ K) trace elements I) mineral dust J) sea-salt E) OM C) PM2.5 D) BC H) NH4+ F) NO3 -G) nss-SO4= co rre la ti o n c o eff ic ie n t N 10-20 N 2 00-30 0 N 5 0 -1 00 N 30-50 N 20-30 N 300-4 1 5 N 4 15-80 0 N 1 00-20 0 BA R CE L O N A M IL A N N 1 0 -2 0 N 2 00-30 0 N 5 0 -1 00 N 30-50 N 20-30 N 3 00-41 5 N 4 15-80 0 N 1 00-20 0 N 10-20 N 2 00-30 0 N 5 0 -1 00 N 30-5 0 N 20-30 N 3 00-41 5 N 4 15-80 0 N 1 00-20 0 0.8 0.6 0.4 0.2 0.0 1.0 A) MILAN B) BARCELONA 0.8 0.6 0.4 0.2 0.0 1.0 0.8 0.6 0.4 0.2 0.0 1.0 S ea -s al t O M NO 3 -P M 2. 5 T ra ce N H 4 + n ss -S O 4 = M ine ra l 0.0 1.0 0.8 0.6 0.4 0.2 0.0 1.0 0.8 0.6 0.4 0.2 N>100(nm) N10-100 N>10(nm) BC K) trace elements I) mineral dust J) sea-salt E) OM C) PM2.5 D) BC H) NH4+ F) NO3 -G) nss-SO4= H) NH4+ F) NO3 -G) nss-SO4= co rre la ti o n c o eff ic ie n t N 10-20 N 2 00-30 0 N 5 0 -1 00 N 30-50 N 20-30 N 300-4 1 5 N 4 15-80 0 N 1 00-20 0 N 10-20 N 2 00-30 0 N 5 0 -1 00 N 30-50 N 20-30 N 300-4 1 5 N 4 15-80 0 N 1 00-20 0 BA R CE L O N A M IL A N BA R CE L O N A BA R CE L O N A M IL A N M IL A N N 1 0 -2 0 N 2 00-30 0 N 5 0 -1 00 N 30-50 N 20-30 N 3 00-41 5 N 4 15-80 0 N 1 00-20 0 N 1 0 -2 0 N 2 00-30 0 N 5 0 -1 00 N 30-50 N 20-30 N 3 00-41 5 N 4 15-80 0 N 1 00-20 0 N 10-20 N 2 00-30 0 N 5 0 -1 00 N 30-5 0 N 20-30 N 3 00-41 5 N 4 15-80 0 N 1 00-20 0 N 10-20 N 2 00-30 0 N 5 0 -1 00 N 30-5 0 N 20-30 N 3 00-41 5 N 4 15-80 0 N 1 00-20 0 0.8 0.6 0.4 0.2 0.0 1.0 0.8 0.6 0.4 0.2 0.0 1.0 A) MILAN B) BARCELONA 0.8 0.6 0.4 0.2 0.0 1.0 0.8 0.6 0.4 0.2 0.0 1.0 0.8 0.6 0.4 0.2 0.0 1.0 0.8 0.6 0.4 0.2 0.0 1.0 S ea -s al t O M NO 3 -P M 2. 5 T ra ce N H 4 + n ss -S O 4 = M ine ra l 0.0 1.0 0.8 0.6 0.4 0.2 0.0 1.0 0.8 0.6 0.4 0.2 0.0 1.0 0.8 0.6 0.4 0.2 0.0 1.0 0.8 0.6 0.4 0.2 N>100(nm) N10-100 N>10(nm) N>100(nm) N>100(nm) N10-100 N10-100 N>10(nm) N>10(nm) BC
Fig. 11. Correlation coefficient between the daily mean aerosol PM2.5 mass concentrations and number concentrations (in several size ranges) during the 1-year study period.
or decrease of PM concentrations. The data of the central part of the PM2.5vs. N10–30 and PM2.5vs. N10–100 scatter
plots are associated with this type of events (Figs. 10a–b). During these episodes, the increase in PM2.5 levels occur
because particles have grown enough to produce a significant N>100 (nm) values (observe in Fig. 7 the DpN and N>100 (nm) increases during the above cited examples).
B) Low PM2.5and high N10–100 episodes (also
associ-ated with N10–30 events) are frequently recorded (e.g. 20– 24 of March 2004 at MILAN, 9–13 and 17 of February 2004 at BARCELONA and 21–22 and 24 of November 2003 at LONDON; Fig. 7). These events are caused by the occur-rence of “very small fresh particles” (observe in Fig. 7 the low “DpN and N>100 (nm)” and high “N10–30” values
during the above cited examples) associated with two pos-sible processes: 1) recent primary emissions (e.g. BC and some OM species) and 2) new particles formation by nucle-ation (e.g. sulphate and some OM species; Jung et al., 2006). The fact that the aerosol surface concentrations are low dur-ing these events (Fig. 10d) favours the occurrence of these very small particles, because under low aerosol surface con-centrations: (i) the coagulation rates remain low (increasing the residence time of these fresh small particles), and (ii) the condensation rates decreases and consequently the gas-to-particle transfer of matter by nucleation is favoured with respect to higher PM2.5 concentration events (note that
con-densation and nucleation are competing processes, the first being favoured under high aerosol surface concentrations and vice versa; see a discussion on this in Rodr´ıguez et al., 2005). This type of events accounts for the data located in the right lower corner (“labelled as fresh PM”) of the PM2.5vs. N10–
30 and PM2.5vs. N10–100 scatter plots (Figs. 10a–b).
C) High PM2.5and low N10–100 episodes. Examples
(Fig. 7): 4 and 13–15 March 2004 at MILAN and 7, 18– 19 and 21 February 2004 at BARCELONA. The following mechanisms may be involved in these events: 1) an enhance-ment of coagulation and condensation processes in relatively “aged air” (e.g. during pollution events at night; Figs. 8c), and 2) the presence of high density primary particles (e.g. fly-ashes, metals or mineral local or Saharan dust). These types of events account for the data located in the left upper corner (“labelled as aged PM” according to the first mech-anism cited above) of the PM2.5 vs. N10–30 and PM2.5 vs.
N10–100 scatter plots (Figs. 10a–b).
The influence of the above cited mechanisms favouring the presence of ultrafine particles under low PM2.5
concentra-tions is also observed in Fig. 8: the decrease in the aerosol concentrations from “high-to-mid” and “mid-to-low” PM2.5
events exhibits ratios ∼0.5 for PM2.5, 0.6 for N>100 (nm),
0.8 for N10–100 and 0.9 for N10–30 at the 3 sites. Observe how the decrease is much less important for ultrafine parti-cles. This could have implications for air quality improve-ments strategies: “a decrease in the ‘accumulation mode par-ticles’ (which accounts for the most important proportion of the aerosol surface) may raise the ultrafine particles number concentration in urban air.” The relationships leading to these conclusions have also been observed in urban and rural areas (Wichmann et al., 2000; Laakso et al., 2003; Rodr´ıguez et al., 2005).
5 Summary and conclusions
In this article, data on urban fine aerosol particles physic-ochemical characterization in MILAN, BARCELONA and LONDON were collected and studied. The analysis of the aerosol number size distribution, chemical composition and mass PM2.5 concentrations data, provides a comprehensive
picture on the involvement of the different microphysical
processes on the aerosol dynamics (i.e. nucleation, coagu-lation, condensation, evaporation, deposition prompted by Brownian diffusion, etc. . . ) in the regular evolution of the urban aerosol in a daily, weekly and seasonal basis as well as in the aerosol evolution from clean-air to pollution episodes. Mean concentrations of PM2.5and N>10 (nm) at the three
sites are within the range of typical values across West-ern Europe, PM2.5: 20–45 µg/m3 and N>10 (nm): 10–
25×103cm−3, being the highest concentrations recorded
in MILAN and the lowest in LONDON. Ultrafine parti-cles N10–100 accounts 80–85% of the total number con-centration of fine aerosol, being the number size distri-bution mode (DpN) about ∼37 nm. The results of this study evidence the much higher levels of: 1) “mineral dust” in the Mediterranean cities (4.6 µg/m3 in BARCELONA, 1.7 µg/m3 in MILAN and 0.6 µg/m3 in LONDON) and 2) organic matter and ammonium-nitrate in the Po Valley (MILAN 7.0 µgNO−3/m3, 5.5 µgOM/m3and 2.5 µgNH+4/m3 higher than in BARCELONA and LONDON). The links be-tween “aerosol chemical composition and mass concentra-tions” with the “number size distribution” have been studied in terms of the involvement of the microphysical processes.
The PM2.5 mass concentrations exhibit a high correlation
with the number concentration of particles >100 nm (N>100 (nm) which only accounts for <20% of the total number concentration of particles >10 nm) but do not exhibit a sig-nificant correlation with the ultrafine particles number con-centration (N10–100 which accounts for >80% of the total number concentration of particles >10 nm). Moreover: 1) ammonium-nitrate and ammonium-sulphate are significantly correlated with N>100 (nm), being this attributed to particle growth processes and to gas-to-particle conversion mecha-nisms involving “condensation onto” and/or “reaction with” the surface of pre-existing particles, 2) organic matter (OM) and black-carbon (BC) are the only aerosol compounds sig-nificantly correlated with the number concentration of ul-trafine N<100 (nm) particles, and are also correlated with N>100 (nm), being this attributed to vehicle exhaust emis-sions and subsequent particle growth due to coagulation and condensation processes.
The results of this study show that in urban environments: 1) PM2.5is mainly weighted by the accumulation mode
par-ticles (0.1–1 µm) linked to the “urban aerosol background” and consequently is highly affected by the microphysical processes contributing to N>100 (nm), such as “condensa-tion or reac“condensa-tion of gases onto the particles surface” and par-ticles growth processes (e.g. by coagulation), and 2) the total number concentration N>10 (nm) is mainly weighed by the ultrafine particles, which are highly influenced by the fresh vehicle exhausts emissions, and exhibits a relatively short residence time because the effects of coagulation and depo-sition prompted by Brownian diffusion. Because of this, the variations on PM2.5 and N>100 (nm) concentrations tend
to be smoother than those in the total N>10 (nm) and ul-trafine N10–100 particles number concentration. The above