HAL Id: hal-00304816
https://hal.archives-ouvertes.fr/hal-00304816
Submitted on 16 Aug 2005
HAL is a multi-disciplinary open access
archive for the deposit and dissemination of
sci-entific research documents, whether they are
pub-lished or not. The documents may come from
teaching and research institutions in France or
abroad, or from public or private research centers.
L’archive ouverte pluridisciplinaire HAL, est
destinée au dépôt et à la diffusion de documents
scientifiques de niveau recherche, publiés ou non,
émanant des établissements d’enseignement et de
recherche français ou étrangers, des laboratoires
publics ou privés.
observed with coarse resolution microwave remote
sensing
K. Scipal, C. Scheffler, W. Wagner
To cite this version:
K. Scipal, C. Scheffler, W. Wagner. Soil moisture-runoff relation at the catchment scale as observed
with coarse resolution microwave remote sensing. Hydrology and Earth System Sciences Discussions,
European Geosciences Union, 2005, 9 (3), pp.173-183. �hal-00304816�
www.copernicus.org/EGU/hess/hess/9/173/ SRef-ID: 1607-7938/hess/2005-9-173 European Geosciences Union
Earth System
Sciences
Soil moisture-runoff relation at the catchment scale as observed
with coarse resolution microwave remote sensing
K. Scipal1, C. Scheffler2, and W. Wagner1,3
1Vienna University of Technology Institute of Photogrammetry and Remote Sensing, Vienna, Austria 2University of Jena, Institute of Geography, Jena, Germany
3Christian Doppler Laboratory “Spatial Data from Laser Scanning and Remote Sensing”, Vienna, Austria
Received: 26 January 2005 – Published in Hydrology and Earth System Sciences Discussions: 2 March 2005 Revised: 29 June 2005 – Accepted: 2 August 2005 – Published: 16 August 2005
Abstract. Microwave remote sensing offers emerging
ca-pabilities to monitor global hydrological processes. In-struments like the two dedicated soil moisture missions SMOS and HYDROS or the Advanced Scatterometer on-board METOP will provide a flow of coarse resolution mi-crowave data, suited for macro-scale applications. Only re-cently, the scatterometer onboard of the European Remote Sensing Satellite, which is the precursor instrument of the Advanced Scatterometer, has been used successfully to de-rive soil moisture information at global scale with a spatial resolution of 50 km. Concepts of how to integrate macro-scale soil moisture data in hydrologic models are however still vague. In fact, the coarse resolution of the data pro-vided by microwave radiometers and scatterometers is of-ten considered to impede hydrological applications. Nev-ertheless, even if most hydrologic models are run at much finer scales, radiometers and scatterometers allow monitor-ing of atmosphere-induced changes in regional soil mois-ture patterns. This may prove to be valuable information for modelling hydrological processes in large river basins (>10 000 km2). In this paper, ERS scatterometer derived soil moisture products are compared to measured runoff of the Zambezi River in south-eastern Africa for several years (1992–2000). This comparison serves as one of the first demonstrations that there is hydrologic relevant information in coarse resolution satellite data. The observed high corre-lations between basin-averaged soil moisture and runoff time series (R2>0.85) demonstrate that the seasonal change from low runoff during the dry season to high runoff during the wet season is well captured by the ERS scatterometer. It can be expected that the high correlations are to a certain degree pre-determined by the pronounced inter-annual cycle observed in the discharge behaviour of the Zambezi. To quantify this
Correspondence to: K. Scipal
effect, time series of anomalies have been compared. This analysis showed that differences in runoff from year to year could, to some extent, be explained by soil moisture anoma-lies.
1 Introduction
Soil moisture is widely recognised as a key parameter in environmental processes, including meteorology, hydrology, agriculture and climate change. From a hydrologic view-point, soil moisture controls the partitioning of rainfall into runoff and infiltration and therefore has an important effect on the runoff behaviour of catchments (Aubert et al., 2003). An accurate assessment of the spatial and temporal varia-tion of soil moisture may therefore be useful for improving the predictive capability of runoff models, and for improv-ing and validatimprov-ing hydrologic process representations. Un-fortunately, useful in-situ observations are rarely available as area representative measurements are expensive and te-dious to collect (Hollinger and Isard, 1994; Rombach and Mauser, 1997). The difficulty of measuring soil moisture on the ground has motivated considerable research in the field of remote sensing (Engman and Chauhan, 1995). Specifically, microwave remote sensing offers the possibility to retrieve soil moisture information at various scales.
Much emphasise has been put on Synthetic Aperture Radars (SAR), the only system which can provide infor-mation on smaller scales (<50 m), with some success be-ing achieved usbe-ing change detection approaches (see e.g. Moran, 2000). However, currently available SAR systems neither provide the data necessary for routine application nor are they truly optimised for soil moisture retrieval. That is why SAR studies are in general still experimental and progress has been slower than expected. At the same time,
significant progress has been made using coarse-resolution microwave radiometers and scatterometers. The advantage of these systems compared to SAR is that they offer multi-dimensional, multi-temporal observation capabilities (multi-ple frequencies and polarisations in the case of microwave radiometers and multiple-viewing capabilities in the case of scatterometers). These capabilities allow one to better ac-count for the confounding effects of vegetation and surface roughness, which are inherent in both active and passive mi-crowave observations. The progress made, led to the ap-proval of two experimental satellite missions optimised to measure soil moisture, ESA’s Soil Moisture and Ocean Salin-ity Mission (SMOS) and NASA’s Hydrosphere Sate Mission (HYDROS). As low microwave frequencies are beneficial for soil moisture retrieval (longer wavelengths better pene-trate vegetation) both missions will be operated in L-band. SMOS will use a radiometer to make measurements at a spa-tial resolution of about 40 km (Kerr et al., 2001). HYDROS will combine a radiometer (40 km) and a scatterometer (3 and 10 km). Foreseen launch dates are 2007 and 2010, re-spectively. These two missions will perform first-of-a-kind exploratory measurements and aim to measure soil moisture with an accuracy of 0.04 m3m−3.
Beside these dedicated hydrological missions, operational satellite missions not optimised for soil moisture retrieval have also been found useful. Attention has been put on the Advanced Microwave Scanning Radiometer (AMSR) on the Aqua satellite and the scatterometers on the European Re-mote Sensing satellites (ERS). Only recently a global surface soil moisture product based on AMSR data has been pub-lished (Njoku, 2004). The novelty of the data set and the still limited temporal availability of data however constrain sci-entific applications. Data from the ERS scatterometer have been used for the first time to derive a global validated long term soil moisture dataset (Scipal, 2002; Scipal et al., 2002). The data set has a spatial resolution of 50 km and a compa-rable quality with state-of-the-art, global soil moisture mod-els (Wagner et al., 2003). The accuracy of the scatterometer based soil moisture product was assessed using over 45 000 measurements worldwide and is around 0.054 m3m−3 for the 0–1 m layer for temperate and tropical climatic regions (a red-noise filtering approach was used to estimate the water content in the soil profile from the remotely sensed surface soil moisture series). The retrieval algorithm developed for the ERS scatterometer will be directly applicable to its suc-cessor, the Advanced Scatterometer (ASCAT). This instru-ment has a spatial resolution of 25 km and will be flown on a series of METOP satellites, providing data continuity over an initial period of at least 14 years, starting in 2006.
The coarse resolution of these sensors is however often assumed to be insufficient for hydrologic applications, there-fore they have so far not been considered by the hydrologic community. Given the impending launch of a series of coarse resolution microwave sensors capable of retrieving soil mois-ture and the unavailability of other data sources, the logic
dictates, that it is necessary to investigate the potential of these techniques to support hydrologic applications. Clearly, substantial research efforts will be needed to develop meth-ods for ingesting data into hydrologic models. The questions of spatial resolution, irregular sampling intervals, and low penetration depth into the soil surface need to be addressed. Fortunately, the technique of data assimilation has recently gained significant attention and will provide important impe-tus in the future (e.g. Walker et al., 2001).
Before complex hydrological assimilation schemes are de-veloped, it is advisable to gain a better understanding of the available information. This is the aim of this paper, which compares ERS scatterometer soil moisture with runoff time series from the Zambezi River. The Zambezi River has been chosen for this investigation because of its large catchment area and its pronounced intra- and inter-annual variability in runoff. Before the results of this comparison are presented in Sect. 7, Sect. 2 reviews a number of studies, which investi-gated the possibility of using soil moisture observations for improving runoff prediction. Soil moisture scaling issues are addressed in Sect. 3 to lay the foundation for assessing the in-formation contained in coarse resolution data. The soil mois-ture retrieval technique based on ERS scatterometer data is explained in Sect. 4, including a more detailed discussion on the accuracy of the derived soil moisture products in Sect. 5. The available hydrometric data are described in Sect. 6. The discussion of the results aims particularly at identifying the information inherent in the macro-scale soil moisture prod-ucts.
2 State of the art
In recent years there have been a few studies geared to-wards combining hydrologic models and space borne data to improve runoff models, or just to use the data to improve and validate hydrologic process representation at catchment scale.
Classically, soil moisture observations are not used di-rectly to address hydrologic problems such as runoff predic-tion, drought monitoring or flood forecasting, but are used in assimilation schemes of land surface hydrologic models or to constrain soil vegetation atmosphere transfer models (Aubert et al., 2003; for examples see Houser et al., 1998; Li and Islam, 1999; Walker et al., 2001; Walker and Houser, 2001; Reichle et al., 2001). Most of these studies focused on the assimilation technique itself and its influence on the soil water content, but did not examine the effect of the soil moisture assimilation on other modelled fluxes such as dis-charge and evapotranspiration (Pauwels et al., 2001). This was also noted by Aubert (2003) who states that coupling soil moisture observations with the routing function of hydrolog-ical models, in order to improve stream flow simulations and forecasts, has not extensively been studied. However, first experimental studies confirm that assimilation of remotely
sensed soil moisture can significantly improve simulation re-sults especially under extreme conditions.
Pauwels (2001) examined the effect of ERS SAR derived soil moisture assimilation on modelled discharge, concluding that the data assimilation could improve model based dis-charge estimates. In the study, a lumped hydrologic model was used in combination with two assimilation methods of remotely sensed soil moisture. One assimilation method used the spatial patterns, the other only the spatial mean and vari-ance of observed soil moisture. Assimilation of the spa-tial mean and variance already improved hydrological model based discharge predictions. These results suggest that the mean value captured by coarse resolution soil moisture is a statistically meaningful descriptor, which may help to im-prove simulation results regardless of scale differences be-tween model and data.
Francois et al. (2003) and Bach and Mauser (2003) showed that spaceborne observations of soil moisture are especially useful to improve simulation results under extreme flood conditions. Francois et al. (2003) used an extended Kalman filter with a lumped rainfall runoff model, Bach and Mauser (2003) a four dimensional data assimilation method with a flood forecasting model. Similar results were obtained by Aubert et al. (2003) showing that observed soil moisture can be used to improve runoff prediction over a sub-catchment of the Seine River in France. Although not using remotely sensed data, the study elaborates on the use of remotely sensed soil moisture observations and indicates its potential if provided frequently enough (1–3 days). This high tempo-ral sampling requirements can currently only be fulfilled by coarse resolution sensors. Although none of these studies di-rectly used coarse resolution data, they indicate the potential of coarse resolution data and point to possible ways forward in the use of macro scale soil moisture products.
3 Soil moisture scales
To make best use of a certain data set it is essential to de-fine the processes captured by the data set, to understand the processes influencing the observed quantity, the scale at which the variability acts and finally the relation between the process and the observation scale. According to Grayson et al. (2002), scale is one of the key issues in hydrologic appli-cations. It is not only a question of how to observe relevant features but also to observe and use them at the appropriate scale. In the ideal case process scale, model scale and the measurement scale are compatible (Bl¨oschl, 1996). The pro-cess scale characterizes the typical time and length scales on which the process takes place, while the measurement scale refers to the spatial resolution and temporal sampling interval of the measurement device.
Based on in-situ soil moisture data, scaling properties of the soil moisture field have been investigated. It has been found that soil moisture is spatially and temporally highly
variable. Several authors showed that the variability is driven by vegetation, soil type and topography and suggested that the spatial scale of soil moisture is on the order of tens of meters (Nielsen et al., 1973; Vieira et al., 1981; Vachaud et al., 1985). The perception was, that beyond this distance there is too much variability of soil, vegetation and topogra-phy to maintain a correlation of soil moisture. Concurrently it was argued by Kontorschikov (1979), Meshcherskaya et al. (1982) and more recently by Cayan and Georgakakos (1995) that a second factor influences soil moisture variabil-ity on a scale of hundreds of kilometres and attributed it to at-mospheric forcing effects. Studies by Vinnikov et al. (1996) and Entin et al. (2000) support the two scale concept with a small scale component influenced by vegetation, soil type and topography acting on the range of centimetres to hun-dreds of meters and a large scale component influenced by climatic conditions and atmospheric events such as precipi-tation and radiation acting on scales of kilometres and larger. Vinnikov et al. (1999) argued that small scale variability does not effect soil moisture above 1 km, and that above this scale the variability in soil moisture for the scale of typical coarse resolution sensors (ranging from 1 km to 100 km resolution) is relatively constant.
Evidence of a two scale concept are also found in Ceballos et al. (2002) and Mart´ınez-Fern´andez and Ceballos (2003). The authors studied characteristics of soil moisture in a semi-arid environment based on data from the REMEDHUS net-work located in the North West of the Iberian Peninsula. The network consists of twenty soil moisture measurement sta-tions spread over a 1200 km2 large area, characterised by different soil and land use types. The stations are within the same climatological context but are hydrologically indepen-dent. The analysis of multi-year soil moisture time series indicated clear spatial patterns of persistence. Some stations were noted to be consistently wetter than the average while some were consistently drier, independent of the point in time. Still, all stations followed the same temporal trend and a high correlation between the twenty stations could be ob-served. Differences in absolute soil moisture were explained by differences in soil type, texture and topography.
This leads to the conclusion that observations made with coarse resolution sensors, which effectively average over the small-scale structure of the observed region, contain infor-mation about the large-scale component which refers to me-teorological and climatic events.
4 Soil moisture from scatterometer data
Soil moisture data used in this study are taken from the Global Soil Moisture Archive 1992–2000 located at http:// www.ipf.tuwien.ac.at/radar/ers-scat/home.htm (Scipal et al., 2002). The archive is based on ERS Scatterometer data and comprises global surface soil moisture data and indicators of root zone soil moisture sampled at ten-day intervals.
Scatterometers are active microwave sensors with a coarse spatial and a high temporal resolution. To retrieve soil mois-ture information, scatterometers onboard of the European Remote Sensing Satellites ERS-1 and ERS-2 were used. The ERS scatterometer operates at 5.3 GHz (C-band) verti-cal polarization, collecting backscatter measurements over an incidence angle range from 18◦to 57◦ using three side-ways looking antennae. The sensor achieves global cover-age within 3 to 4 days where each beam provides measure-ments of radar backscatter for overlapping 50 km resolution cells with a 25 km grid spacing at approximately 10:30 a.m. and 10:30 p.m. for ascending and descending tracks, respec-tively.
Scatterometry offers capabilities to infer soil moisture due to the strong variation of the dielectric constant of soil with volumetric water content. However, scattering from land sur-faces also depends on other factors. Potential retrieval tech-niques must account for the confounding effects of surface roughness, vegetation, topography and soil texture. Since the 1970’s several methods have been developed to retrieve soil moisture from microwave remote sensing data. Possibly the largest potential is held by change detection approaches. Change detection has successfully been used to retrieve soil moisture for active (Wagner et al., 1999c; Moran et al., 2000) and passive data (deRidder, 2000). Unlike more complex theoretical or semi empirical approaches often preferred for retrieval purposes, change detection is attractive for global applications because comprehensive pre-knowledge of sur-face characteristics is not required.
Retrieval of soil moisture for “The Global Soil Moisture Archive” is based on the change detection method developed by Wagner et al. (1999c). The method fully accounts for the effects of surface roughness, vegetation and heterogeneous land cover (Wagner et al., 1999a, b, c). It allows the re-trieval of surface soil moisture information equivalent to the degree of saturation in relative units (ranging between 0 and 100%). To infer root zone soil moisture a red-noise filtering approach was used, which is controlled by the ratio of the layer depth and the pseudo diffusivity that depends on soil properties (Wagner et al., 1999c; Ceballos et al., 2005). As soil properties are not known quantitatively on a global scale, this parameter was determined empirically and set constant (Wagner et al., 1999c). The resulting index is the Soil Wa-ter Index SWI, a percentile measure of soil moisture between the soil moisture extremes 2min(dry) and 2max(wet) which
have been shown to correlate well with the wilting level and the point central to the field-capacity and the total water ca-pacity (Wagner et al., 1999c).
5 Soil moisture quality
To assess the quality of scatterometer derived soil moisture, data from “The Global Soil Moisture Archive 1992–2000”
has been compared extensively with soil moisture informa-tion from various sources.
Wagner et al. (2003) compared scatterometer derived soil moisture with gridded precipitation data and modelled soil moisture. The study showed that there is reasonable agree-ment between the different datasets especially in tropical and temperate climates. Only in extreme climates such as deserts and the arctic, spurious effects have been observed. Given, that the accuracy of the gridded precipitation and the mod-elled soil moisture is not known it is not possible to draw any quantitative conclusions. Considering that the datasets are independent it is however reasonable to assume that a high agreement indicate regions of good data quality and that in such a case upper limits of the accuracy of the scatterometer derived soil moisture can be inferred. This upper limit has been determined to be in the range of 0.03–0.07 m3m−3.
A quantitative assessment of the soil moisture product was carried out by Scipal (2002) using over 45 000 soil mois-ture measurements from 372 stations worldwide. Samples were taken at agro-meteorological networks covering a wide range of soil types and climatic regions located in Russia, Ukraine, China, Mongolia and the US. For Ukraine, Rus-sia and Illinois soil moisture samples from a depth of 1 m were compared. In India and China, soil moisture samples from a depth of 50 and 60 cm were used. Statistical analy-sis showed an accuracy of 0.049 m3m−3and 0.084 m3m−3 depending on the measurement network. The average accu-racy was 0.054 m3m−3. Even better values have been
deter-mined for soil moisture anomalies with an average accuracy of 0.032 m3m−3.
A more detailed study, was carried out by Ceballos et al. (2005) who compared scatterometer derived soil mois-ture to field observations from the REMEDHUS network. All stations of the REMEDHUS network are within one scatterometer pixel therefore allowing a more detailed as-sessment of soil moisture conditions. For the comparison, data from twenty stations were averaged. The resulting time series compared well with scatterometer derived soil mois-ture. The coefficient of determination R2for the average soil moisture profile (0–100 cm) reached a value of 0.74 and the mean square error (RMS error) was 0.022 m3m−3.
6 Hydrometric data
Hydrometric data is available for the Zambezi River. The basin of the Zambezi River is one of the largest of the African continent covering approximately 1.35 million km2or 5% of the continent. The Zambezi River runs through six coun-tries: Zambia, Angola, Zimbabwe, Namibia, Botswana and Mozambique, from the centre of Africa to the Indian Ocean. The source of the Zambezi River is situated at Kalenehills in the northwestern part of Zambia. At the frontier to Zim-babwe, the Zambezi reaches a width of 1.7 km before it reaches the Victoria falls. The entire river length is 3000 km
Table 1. Gauging stations on the Zambezi River used in this study.
Gauging station River Location Catchment size Measurement Kalabo Luanginga 14◦580S–22◦410E 28 500 km2 Discharge Watopa Pontoon Kabompo 14◦020S–23◦3703000E 66 750 km2 Discharge Chavuma Mission Zambezi 13◦050S–22◦410E 76 000 km2 Discharge Victoria Falls Zambezi 17◦550S–25◦500E 507 200 km2 Discharge Nanas Farm Zambezi 17◦500S–25◦390E 524 000 km2 Discharge Lukulu Zambezi 14◦230S–23◦140E 212 450 km2 Water level Matongo Zambezi 15◦160S–23◦0303000E 245 000 km2 Water level Senanga Zambezi 16◦070S–23◦2301500E 290 572 km2 Water level Sesheke Zambezi 17◦250S-20◦120E 322 500 km2 Water level
from source to estuary (Zambezi River Authority, 2002). Along the Zambezi River two major dams (Lake Kariba and Cabora Bassa) have been built that are mainly used for gen-eration of energy.
The climate of the Zambezi catchment underlies the move-ment of the Intertropical Convergence zone ITC, resulting in distinct dry and wet seasons during the year. Consequently, the flow of the Zambezi River is seasonal with the lowest flows occurring from June to November and the higher flows occurring from December to May. The study period, was characterized by a wet period from 1992 to 1994, followed by a rather dry period from 1995 to September 1997. The end of the study period was characterized by extreme wet conditions with disastrous floods in the years 1997 and 2000. The Zambezi River Authority in Zambia provided daily water level data from eleven stations (Fig. 1). At seven of these stations, additional flow measurements are carried out which allows calculation of runoff. Records of the stations Gwayi and Sanyati are incomplete and have therefore not been used in this study. The observations cover the years 1992 to 2000. Only stations above Lake Kariba have been used, which are Chavuma, Watopa, Lukulu, Kalabo, Ma-tongo, Senanga, Sesheke, Nana’s Farm and Victoria Falls (Table 1). For the station Sesheke unrealistic low water level values have been recorded for the period March 1997 to Oc-tober 1998 which do not fit with the other measurements. These records have been removed.
7 Results
Studying the relationship between soil moisture and hydro-metric parameters is not straightforward. Principally it can be expected that both parameters are related. When soils are close to saturation runoff will be much higher compared to the situation when soils are dry. However given the different nature of the parameters it can be expected that no linear rela-tionship exists but that a more complex interaction between the processes has to be considered. Soil moisture will, for
Fig. 1. The catchment of the Zambezi River with the location of the nine gauging stations used in this study.
example, show higher sensitivity to changes under dry con-ditions compared to runoff. Under prolonged wet concon-ditions soil moisture will saturate and will be insensitive to addi-tional rainfall. Runoff, conversely, is theoretically not bound to an upper limit and will be highest under such conditions. Additionally, it has to be considered that runoff is a point measurement integrating information on the hydrologic sta-tus of an entire catchment. To get a representative indicator,
SWI data has therefore been integrated over all grid points of
the sub basins according to Eq. (1) to derive a “Basin Water Index” BWI: BWI = N P i=1 SWIi N . (1)
In this simplistic approach the position of each sample point with respect to the hydrometric gauging station is not con-sidered. It can be expected that each point shows a unique relation to the gauging station which is determined by the geomorphology of the basin. This will specifically be the case for large catchments. Equation (1) also assumes that all points in the catchment are equally relevant for the
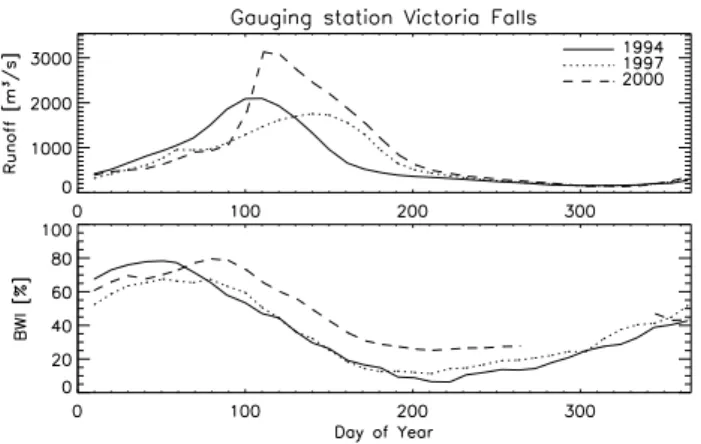
Fig. 2. Runoff and Basin Water Index series for the station Victoria Falls situated on the Zambezi River for the years 1994, 1997 and 2000.
generation of runoff. For the sake of simplicity of this ex-planatory analysis more realistic schemes were set aside. To retrieve temporal matching data sets daily hydrometric pa-rameters have been averaged over ten day periods.
The first step in the analysis was to visually compare the scatterometer derived soil moisture with samples from hy-drometric gauging stations. It was examined if similar tem-poral trends can be observed in both datasets. Figure 2 shows discharge and BWI time series for the station Victoria Falls for the years 1994, 1997 and 2000. The year 1994 is charac-teristic for wet conditions, the year 1997 for dry conditions whereas the year 2000 was an extreme wet year with dis-astrous floods. These climatic differences are well reflected in both time series. However, the extreme conditions of the year 2000 are better visible in the discharge time series than in the BWI time series. Generally, it can be observed that the BWI shows less variability between the sampled years than the hydrometric data. However, annual variations in the
BWI are clearly evident for all stations. In Fig. 2 it can also
be observed that the maximum runoff lags some time behind the maximum BWI. For the station Victoria Falls the high-est runoff is recorded between April and May, whereas the
BWI maximum is observed between February and March.
The time difference in the observed maxima is most likely explained with the delay time of the discharge system. It can be expected that runoff measured at a gauging station shows a much slower response to precipitation events than soil moisture which will immediately respond. This is also in agreement with the observation that the magnitude of the delay time increases with the basin size. Despite this differ-ence in the two data sets, differdiffer-ences in the annual cycle are clearly visible and follow the climatic conditions experience during the study period.
In the second step of the analysis, the relation between the hydrometric parameters and the BWI has been assessed quantitatively. For this purpose hydrometric samples have been plotted against the BWI for all stations. To account for
Table 2. Parameters of the logarithmic model given in Eq. (2) after optimising the fit between the model and the parameters for all sta-tions, and coefficients of correlation R for the whole year and for the wet and dry seasons.
Gauging station Q0 χQ BWImax 1t R RDry RWet
Watopa Pontoon 32.78 93.08 82.4 30 0.94 0.83 0.96 Chavuma Mission 8.55 151.28 75.1 40 0.96 0.97 0.94 Victoria Falls 19.87 711.63 74.7 60 0.95 0.63 0.92 Nana’s Farm 56.69 630.29 73.3 60 0.96 0.48 0.93
Table 3. Parameters of the logarithmic model given in Eq. (3) after optimising the fit between the model and the parameters for all sta-tions, and coefficient of correlation R for the whole year and for the wet and dry seasons.
Gauging station h0 χh BWImax 1t R RDry RWet
Lukulu 1.52 0.88 82.6 30 0.92 0.79 0.95 Matongo 1.48 1.93 84.1 50 0.96 0.82 0.95 Senanga 0.15 1.67 83.6 60 0.96 0.93 0.90 Sesheke 4.77 1.52 78.9 60 0.96 0.84 0.93
the response time observed in the time series, hydrometric data was shifted back such that the observed maxima corre-sponded. To achieve correspondence between the maxima, different time shifts had to be applied to each individual sta-tion. Figures 3 and 4 show the plots of the BWI and the shifted runoff and water level data. The best fit and hence the magnitude of the applied shift was determined using a sim-ple regression model. The models used to determine the rela-tion between the BWI and the hydrometric parameters (runoff and water level) has been set up empirically. The regression models are given in Eqs. (2) and (3) where the first is used for discharge measurements and the second is used for water level measurements. Although both models are mathemati-cally identical they have been defined separately to allow a correct interpretation of the parameters. In Eq. (2) the dis-charge Q at time t is determined by the “baseflow” Q0, the
highest observed Basin Water Index BWImax, a hydrometric
scaling factor χQand the delay time 1t: Q (t ) = Q0+χQln
BWImax
BWImax−BWI (t − 1t)
. (2)
Similarly, in Eq. (3) the water level h at time t is determined by the lowest water level h0, by the highest observed Basin
Water Index BWImax, a hydrometric scaling factor χhand the delay time 1t :
h (t ) = h0+χhln
BWImax
BWImax−BWI (t − 1t)
. (3)
The models were defined in a way that their parameters can be related to physical quantities. The baseflow Q0and the
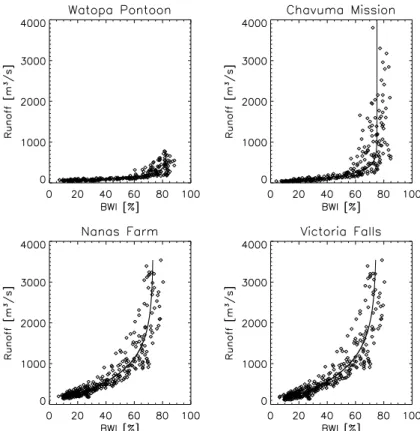
Fig. 3. Scatterplot of Basin Water Index and runoff at four gauging stations of the Zambezi River. Runoff data has been shifted back such that the observed maxima corresponded. The fitted model of Eq. (2) is also shown.
Fig. 4. Scatterplot of Basin Water Index and water level at four gauging stations of the Zambezi River. Water level data has been shifted back such that the observed maxima corresponded. The fitted model of Eq. (3) is also shown.
Fig. 5. Runoff and Basin Water Index series for the station Kalabo situated at the Luanginga River for the years 1996, 1998 and 2000.
water level h0 relate to the waterflow when soils are
com-pletely dry. The highest observed BWI relates to the thresh-old where the soils are close to saturation and any additional rainfall will directly result in runoff. The hydrometric scaling factor is necessary to determine the shape of the logarithmic model, such influencing the soil moisture runoff/water level behaviour. The delay time 1t determines the difference ob-served in the temporal response of the two parameters to pre-cipitation events.
The fit of the regression model expressed in Eqs. (2) and (3) is excellent as can be observed in Figs. 3 and 4. Only for the station Kalabo the fitting procedure of the model did not converge. The reason for this is the extreme temporal pattern observed at the Kalabo station with very low runoff during the entire observation period and one exceptional high runoff event in 2000, which significantly exceeded samples taken at previous years (Fig. 5). The logarithmic model, described in Eq. (2), is from a mathematical point of view, not suited to describe such extreme behaviour. For all other stations the estimated coefficients of determination are well above
R2=0.8 for all stations (Tables 2 and 3). Evidentially, the parameters Q0, h0and BWImax also give realistic numbers.
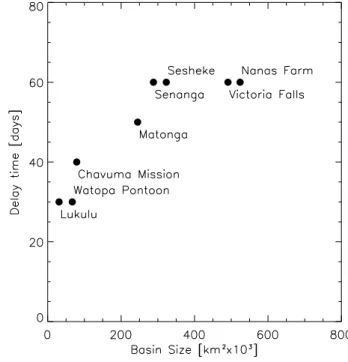
It is interesting to note that the delay time 1t shows a depen-dency on the catchment size. For upstream gauging stations a delay time of 30 days is estimated, for downstream stations this value increases to 60 days (Fig. 6). Also the hydromet-ric scaling factor increases with basin size. Obviously the parameters Q0, h0, 1tand BWImax depend on the
geomor-phology of the Zambezi basin. From a hydrologists point of view this might lead to new insight in the soil moisture runoff behaviour. Quantitative information about the basin and its structure is unfortunately not publicly available. A meaning-ful analysis was therefore not possible.
Although the results are favourable they need to be con-sidered carefully. It can be expected that the pronounced inter-annual cycle observed in the discharge behaviour of the Zambezi with a very dry period and a wet period
predeter-Fig. 6. Relation between basin-size and delay time of the discharge system.
mines the high correlations. To check if the BWI is not only sensitive to annual variations, the coefficient of determina-tion has been determined for the dry and rainy season inde-pendently and in a second step anomalies have been com-pared. To calculate the coefficients of determination for the dry season only measurements taken during the period July to October have been considered, for the rainy season only measurements taken during the period November to March. The resulting coefficients of determination are comparable to those calculated using all measurements. The values for the dry season are a bit lower than those from the wet sea-son. This observation is not surprising, considering that the runoff behaviour of the Zambezi is more sensitive to differ-ences between dry and wet years during the rainy season. During the dry season runoff is generally low with little dif-ferences between the years. In any case these results indicate that the model is robust and that it correctly reflects year to year differences during high and low flow seasons.
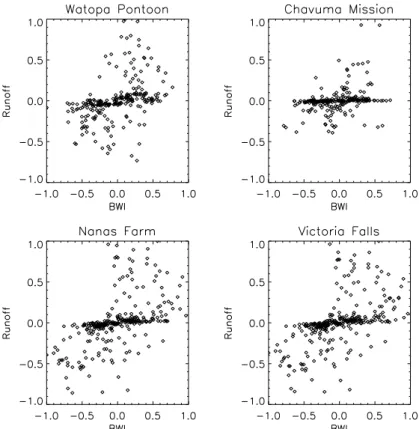
Anomalies were calculated by subtracting the mean annual cycle from the samples (both from the BWI and the hydro-metric series). The mean annual cycle was calculated taking the mean at each decad over the years 1992–2000. If mea-surement series were incomplete, care was taken that the cal-culation of the mean hydrometric parameter and scatterome-ter soil moisture were based on the same data range. Mean values were only calculated if at least two measurements per sample interval were available, otherwise the respective sam-ple was removed from the data set. Figures 7 and 8 show scatterplots of the anomalies. To ease interpretation both
Fig. 7. Scatterplot of Basin Water Index and discharge anomalies at four gauging stations of the Zambezi River. Anomalies are scaled between −1 and +1.
Fig. 8. Scatterplot of Basin Water Index and water level anomalies at four gauging stations of the Zambezi River. Anomalies are scaled between −1 and +1.
quantities have been scaled between −1 and +1. The trend observed in all plots is positive which indicates that differ-ences in runoff/waterlevel from year to year can to some ex-tent be explained by soil moisture anomalies. However under dry conditions the BWI anomalies show much more variabil-ity than the hydrometric anomalies. This is not surprising as especially under dry conditions variations caused by dif-ferent precipitation/evapotranspiration rates only affect the soils. Given the lack of appropriate ground truth informa-tion about these quantities distinct conclusions are specula-tive and should be clarified in further studies.
8 Conclusions
In this paper a novel data set “The Global Soil Moisture Archive 1992–2000” has been presented. Although being not optimum for hydrologic applications due to the coarse reso-lution it was shown that the soil moisture products contain valuable information about large scale atmospheric induced variations of the soil moisture field. Contrary to the avail-ability of this soil moisture data, a review of state of the art research led to the impression that concepts of how coarse resolution products can be used in hydrological modelling are still vague. The quality of the soil moisture data set, and first result of soil moisture assimilation studies however gave rise to the argument that coarse resolution soil moisture can successfully be used in hydrologic applications if scaling is-sues are considered carefully.
To assess the usefulness of coarse resolution soil moisture data for catchment scale modelling, scatterometer derived soil moisture data was compared to hydrometric measure-ments (runoff and water level) taken at eight gauging stations of the Zambezi River in Africa. For this purpose the “Basin Water Index” BWI has been introduced which integrates scatterometer derived soil moisture over the respective sub-basins. Visual analysis showed a reasonable agreement be-tween the BWI and the hydrometric time series. Aside from a shift between the observed maxima of the two datasets cli-matic conditions and multi-annual variations are clearly vis-ible. The observed shift could be explained with differences in the response time to precipitation events. To quantify re-sults of the comparison between the BWI with hydromet-ric measurements a simple logarithmic regression model has been developed. Using this model considerable agreement was found, with coefficients of determination well above
R2=0.8. Also for anomalies a positive trend was observed which led to the feeling that differences in runoff/water level from year to year can to some extent be explained by soil moisture anomalies. However these results need to be con-sidered carefully. It can be expected that the pronounced inter-annual cycle observed in the discharge behaviour of the Zambezi with a very dry period and a wet period predeter-mines the high correlations.
Nevertheless these observations are encouraging espe-cially considering the approaching launch of a number of coarse resolution microwave sensors which will provide a flow of operational, global, high quality soil moisture data. Especially in ungauged basins these datasets might turn out as a valuable source of information to improve the predictive capability of runoff models, or just to use the data to improve and validate hydrologic process representation.
Acknowledgements. We would like to thank the Zambezi River
Authority in Zambia for making hydrometric data available. The study has been funded by the Austrian Science Fund (FWF) through the GLOBSCAT project (L148-N10) and the Austrian Academy of Sciences through the HOE PUB project.
Edited by: G. Pegram
References
Aubert, D., Loumagne, C., and Oudin, L.: Sequential assimilation of soil moisture and streamflow data in a conceptual rainfall-runoff model, J. Hydrol., 280, 145–161, 2003.
Bach, H. and Mauser, W.: Methods and Examples for Remote Sens-ing Data Assimilation in Land Surface Process ModellSens-ing, IEEE Geosci., 41, 1629–1637, 2003.
Bl¨oschl, G. and Sivapalan, M.: Scale issues in hydrological mod-elling: A Review, Hydrol. Proc., 9, 251–290, 1995.
Bl¨oschl, G.: Scale and scaling in hydrology, Wiener Mitteilungen, Wasser Abwasser Gew¨asser, Band 132, Insitut f¨ur Hydraulik, Gew¨asserkunde und Wasserwirtschaft, Technische Universit¨at Wien, 1996.
Cayan, D. R. and Georgakakos, K. P.: Hydroclimatology of conti-nental watersheds: II spatial analyses, Water Res. R., 31, 677– 697, 1995.
Ceballos, A., Martin´ez-Fern´andez, J., Santos, F., and Alonso, P.: Soil Water Behaviour of sandy soils under semi-arid conditions in the Duero Basin (Spain), J. Arid Env., 51, 501–519, 2002. Ceballos, A., Scipal, K., Wagner, W., and Mart´ınez-Fern´andez, J.:
Validation of ERS Scatterometer-Derived Soil Moisture Data in the Central Part of the Duero Basin, Spain, Hydrol. Proc., 19, 1549–1566, 2005.
Crow, W. T. and Wood, E. F.: The assimilation of remotely sensed soil brightness temperature into a land surface model using En-semble Kalman filtering: A case study based on ESTAR mea-surements during SGP97, Adv. Water R., 26, 137–149, 2002. De Ridder, K.: Quantitative estimate of skin soil moisture with
the Special Sensor Microwave/Imager, Bound-Lay. M., 96, 421– 432, 2000.
Engman, E. T. and Chauhan, N.: Status of microwave soil moisture measurements with remote sensing, Remot. Sen. E., 51, 189– 198, 1995.
Entekhabi, D., Asrar, G. R., Betts, A. K., Beven, K. J., Bras, R. L., Duffy, C. J., Dunne, T., Koster, R. D., Lettenmaier, D. P., McLaughlin, D. B., Shuttleworth, W. J., van Genuchten, M. T., Wei, M., and Wood E. F.: An Agenda for Land- Surface Hydrol-ogy Research and a call for the Second International Hydrologi-cal Decade, B. Am. Meteor., 80, 2043–2058, 1999.
Entin, J. K., Robock, A., Vinnikov, K. Y., Hollinger, S. E., Liu, S., and Namkhai A.: Temporal and spatial scales of observed soil
moisture variations in the extratropics, J. Geophys. Res-A., 105, 11 865–11 877, 2000.
Francois, C., Quesney, A., and Ottle C.: Sequential assimilation of ERS–1 SAR data into a coupled land surface hydrological model using an extended Kalman filter, J. Hydromete., 4, 473– 487, 2003.
Grayson, R. B., Bl¨oschl, G., Western, A., and McMahon, T. A.: Advances in the use of observed spatial patterns of catchment hydrological response, Adv. Water R., 25, 1313–1334, 2002. Hollinger, S. E. and Isard, S. A.: A Soil Moisture Climatology of
Illinois, J. Climate, 7, 822–833, 1994.
Houser, P. R., Shuttleworth, W. J., Famiglietti, J. S., Gupta, H. V., Syed, K. R., Goodrich, D. C.: Integration of soil moisture remote sensing and hydrologic modelling using data assimilation, Water Res. R., 34, 3405–3420, 1998.
Kerr, Y. H., Waldteufel, P., Wigneron, J.-P., Martuzzi, J.-M., Font, J., and Berger, M.: Soil moisture retrieval from space: The Soil Moisture and Ocean Salinity (SMOS) mission, IEEE Geosci, 39, 1729–1735, 2001.
Kontorschikov, V. I.: Statistical structure of the soil moisture in Ukraine, (in Russian), 1979.
Koster, R. D., Houser, P. R., Engman E. T., Kustas W. P.: Remote Sensing May Provide Unprecedented Hydrological Data, http: //www.agu.org/eos elec/97035e.html, 1999.
Li, J. and Islam, S.: On the estimation of soil moisture profile and surface fluxes partitioning from sequential assimilation of sur-face layer soil moisture, J. Hydrol., 220, 86–103, 1999. Martin´ez-Fern´andez, J. and Ceballos A.: Temporal stability of Soil
Moisture in a Large-Field Experiment in Spain, Soil Sci. So., 67 1647–1656, 2003.
Meshcherskaya, A. V., Boldyreva, N. A., and Shapaeva N. D.: Dis-trict Average Plant available soil water storage and the depth of snow cover, statistical analysis and its usage (some examples), Gidrometeoizdat, Leningrad, USSR, 243, (in Russian), 1982. Moran, M. S., Hymer, D. C., Qi, J., and Sano, E. E.: Soil
Mois-ture Evaluation Using Multi-Temporal Synthetic AperMois-ture Radar (SAR) in Semiarid Rangeland, Agr. For. Met., 105, 69–80, 2000. Njoku, E.: AMSR-E/Aqua L2B Surface Soil Moisture, Ancillary Parms, & QC EASE-Grids V001, March to June 2004. Boulder, CO, USA: National Snow and Ice Data Center, Digital media, 2004.
Pauwels, V. R. N., Hoeben, R., Verhoest, N. E. C., and DeTroch, F. P.: The importance of the spatial patterns of remotely sensed soil moisture in the improvement of discharge predictions for small scale basins through data assimilation, J. Hydrol., 251, 88–102, 2001.
Reichle, R. H., Mc Laughlin, D. B., and Entekhabi, D.: Variational data assimilation of microwave radiobrightness observations for land surface hydrology applications, IEEE Geosci, 39, 1708– 1718, 2001.
Robock, A., Vinnikov, K. Y., Srinivasan, G., Entin, J. K., Hollinger, S. E., Speranskaya, N. A., Liu, S., and Namkhai, A.: The Global Soil Moisture Data Bank, B. Am. Meteor., 81, 1281–1299, 2000. Rombach, M. and Mauser, W.: Multi-annual analysis of ERS sur-face soil moisture measurements of different land uses, 3rd ERS Symposium on Space at the service of our Environment, Flo-rence, Italy, 14–21 March, European Space Agency, SP-414, 27– 34, 1997.
Scipal, K.: Global Soil Moisture Monitoring using ERS Scatterom-eter Data, Dissertation an der Technisch Naturwissenschaftlichen Fakult¨at, Technische Universit¨at Wien, Juni, 2002.
Scipal, K., Wagner, W., Trommler, M., and Naumann, K.: The Global Soil Moisture Archive 1992–2000 from ERS Scatterom-eter Data: First Results, in: Proc. IGARRS’2002, Toronto, Canada, 24–28 June, 2002.
Vachaud, G., Passerat de Silans, A., Balabanis, P., and Vauclin M.: Temporal stability of spatially soil water probability density functions, Soil Sci. So., 45, 1040–1048, 1985.
Vieria, S. R., Nielsen, D. R., and Biggar J. W.: Spatial variability of field meassured infiltration rate, Soil Sci. So., 67, 1647–1656, 1981.
Vinnikov, K. Y., Robock, A., Qiu, S., Entin, J. K., Owe, M., Choudhsury, B. J., Hollinger, S. E., and Njoku, E. G.: Satel-lite remote sensing of soil moisture in Illinois, USA, J. Geophys. Res-A., 105, 4145–4168, 1999.
Wagner, W., Noll, J., Borgeaud M., and Rott, H.: Monitoring soil moisture over the Canadian Prairies with the ERS scatterometer, IEEE Geosci., 37a, 206–216, 1999a.
Wagner, W., Lemoine, G., Borgeaud, M., and Rott, H.: A study of vegetation cover effects on ERS scatterometer data, IEEE Geosci., 37b, 938–948, 1999b.
Wagner, W., Lemoine, G., and Rott, H.: A Method for Estimating Soil Moisture from ERS Scatterometer and Soil Data, Remot. Sen. E., 70, 191–207, 1999c.
Wagner, W., Scipal, K., Pathe, C., Gerten, D., Lucht, W., and Rudolf, B.: Evaluation of the agreement between the first global remotely sensed soil moisture data with model and precipitation data, J. Geophys. Res-A., 108, 4611–4626, 2003.
Walker, J. P. and Houser, P. R.: A methodology for initializing soil moisture in a global climate model: assimilation of near-surface soil moisture observations, J. Geophys. Res-A., 106, 11 761– 11 774, 2001.
Walker, J. P., Willgoose, G. R., and Kalma, J. D.: One-dimensional soil moisture profile retrieval by assimilation of near-surface ob-servations: A comparison of retrieval algorithms, Adv. Water R., 24, 631–650, 2001.