THÈSE DE DOCTORAT
de l’Université de recherche Paris Sciences et Lettres
PSL Research University
Préparée à l’Université Paris-Dauphine
European office market and economic environment: essays on the
reactions and interactions
École doctorale n
oED 543
DRM FINANCE
Spécialité
SCIENCES DE GESTIONSoutenue par
Benoit LEFEBVRE
le 08 mars 2019
Dirigée par Alain Coën
et par Arnaud Simon
COMPOSITION DU JURY :
M. Martin Hoesli Université de Genève Rapporteur
M. François Des Rosiers Université Laval
Rapporteur M. Michel Baroni
ESSEC Business School Membre du jury
M. Sébastien Bourdin EM Normandie Membre du jury M. Richard Malle
BNP Paribas Real Estate Membre du jury
M. Alain Coën
Université du Quebec à Montréal Directeur de thèse
Averstissement / Warnings
Cette thèse a été réalisée dans le cadre d’une Convention Industrielle de Formation par la Recherche (CIFRE) entre l’Université Paris Dauphine et la société BNP Paribas Real Estate. L’Université Paris Dauphine et la société BNP Paribas Real Estate n’entendent donner aucune
approbation ou improbation aux opinions émises dans cette thèse.
Ces opinions et résultats doivent être considérés comme propres à leurs auteurs. Ils en assument l’entière responsabilité et ne sauraient engager la responsabilité d’un tiers.
* * *
This thesis was conducted within an Industrial Training and Research Agreement (CIFRE) between the Paris Dauphine University and BNP Paribas Real Estate.
Paris Dauphine University and BNP Paribas Real Estate will not be responsible for any approval or disapproval opinions expressed in the thesis.
Remerciements
Mes premiers remerciements vont tout naturellement à Arnaud Simon et Alain Coën d’avoir accepté d’encadrer ce travail de thèse. Ils m’ont véritablement guidé et soutenu durant ces trois années. J’ai pu mener à bien cette thèse grâce à leurs précieux conseils et leur disponibilité. J’espère avoir été digne de la confiance qu’ils m’ont témoignée et avoir l’occasion, à l’avenir, de continuer à collaborer avec eux.
Je remercie également Richard Malle, Global Head of Research, et Samuel Duah, Head of Economics chez BNP Paribas Real Estate de m’avoir accueilli au sein de leurs départements durant trois ans. Leur expérience et leur connaissance des marchés immobiliers ont nourri des échanges intéressants et m’ont grandement aidé tout au long de mes recherches. Je tiens à remercier tout particulière-ment Richard pour sa présence, son soutien et son inspiration au quotidien. La confiance qu’il m’a témoignée depuis mes premiers jours dans l’entreprise et les nombreux projets sur lesquels nous avons pu collaborer ensemble m’ont fait grandir.
Je remercie chaleureusement le Professeur François Des Rosiers et le Professeur Martin Hoesli d’avoir accepté de participer au jury de cette thèse en tant que rapporteur. Mes remerciements vont égale-ment au Professeur Michel Baroni, ainsi qu’à Sébastien Bourdin, qui me font l’honneur de participer à ce jury. Leur lecture attentive et leurs remarques serviront à améliorer ce travail de thèse et je leur en suis très reconnaissant.
Mon quotidien de jeune chercheur au sein de BNP Paribas Real Estate n’aurait pas été si plaisant sans la formidable équipe dans laquelle j’ai pu évoluer. La qualité de nos échanges, tant sur le plan professionnel que personnel m’a aidé à réaliser ce travail de thèse et je les en remercie. Les relations d’amitiés que j’ai pu lier au sein de cette entreprise sont aujourd’hui essentielles pour moi.
J’ai une pensée également pour tous mes amis qui m’ont permis de m’évader du quotidien de doctorant. Je remercie tout particulièrement mes amis bisontins, Emilien et Guillaume, pour nos
discussions quasi-quotidiennes et leur soutien dans les moments de doute. Merci également à An-tonin, Graziella et Jonathan d’avoir été présents pour moi. David, Julie et Jules, merci pour ces moments de détente et de déconnexion à vos côtés.
Enfin, ce travail n’aurait pas été possible sans l’aide et le soutien infaillible de ma famille qui m’a toujours encouragé dans cette démarche. J’ai une pensée particulière pour mon frère Thomas qui a décidé de suivre cette voie quelques années avant moi et qui a toujours été présent pour me guider et me conseiller.
CONTENTS
List of Figures 6
1 Introduction Générale 7
1 General Introduction 19
2 International money supply and real estate risk premium: The case of the London
office market. 30
1 Introduction . . . 32
2 Theoretical framework and stylized facts. . . 37
2.1 Real estate risk premium . . . 37
2.2 The London office market: some stylized facts . . . 39
2.3 Money and real estate prices . . . 43
2.4 A monetary index for international real estate investments . . . 45
3 Model and Data . . . 46
3.1 VAR model . . . 46
3.2 Structural VAR . . . 50
3.3 Data . . . 51
4 Empirical Results . . . 52
4.1 Optimal lag of the monetary index . . . 53
4.2 Results for the whole period: relevance of the monetary index . . . 54
4.3 Results for the sub-periods: the GFC as a potential breakdown . . . 58
4.4 How do real estate markets react differently to money supply and the 3-month Libor rate? . . . 59
4.5 Responses to an unexpected monetary shock . . . 60
5 Conclusion . . . 62
Bibliography 64
3 New monetary policies: fuelling metropolisation and megalopolisation? 80
1 Introduction . . . 82
2 Monetary policies, European megalopolis and metropolisation . . . 84
2.1 European monetary governance: a federal policy in an imperfectly federal union 84 2.2 European Megalopolis and European centrality . . . 86
2.3 Metropoles and global connectivity . . . 88
3 Measuring the monetary spillover in a heterogeneous European office market . . . 90
3.1 Unconventional monetary policies: fuelling the urban investments? . . . 90
3.2 The heterogeneity of the European office markets . . . 91
3.3 Modelling the fundamentals of the office markets . . . 93
3.4 Elasticities of the European office markets to the monetary policies . . . 97
4 Three wealth-reshaping trends supported by the new monetary policies . . . 98
4.1 European metropolises: global connectivity or market size effect? . . . 98
4.2 The ECB monetary policy: an institutional leverage effect for the German office markets . . . 101
4.3 The revival of the megalopolitan advantage . . . 103
5 Conclusion . . . 107
Bibliography 110 4 Rental adjustment in European office markets: global or local effect? 116 1 Introduction . . . 118
2 Literature review . . . 119
3 Theoretical framework: economic modelling . . . 123
3.1 Vector autoregression model . . . 123
3.2 Panel data vector autoregression . . . 124
4 Data . . . 125
5 Empirical analysis: Results . . . 127
5.1 Rental value growth: a global effect? . . . 127
5.2 Rental value growth: a predominance of local dynamics? . . . 130
5.3 The natural vacancy rate: A standard approach . . . 135
6 Conclusion . . . 141
Bibliography 143
5 General Conclusion 147
5 Conclusion Générale 157
LIST OF FIGURES
1.1 Historique des volumes investis en Europe : 2004-2017. . . 9
1.2 Patrimoine immobilier des investisseurs institutionnels en Europe en 2017. . . 11
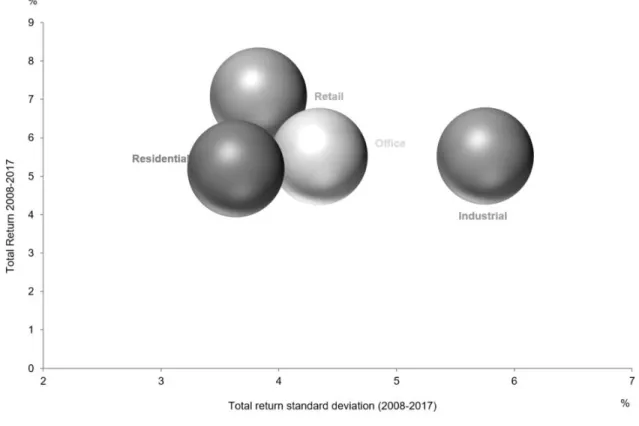
1.3 Rendement global et écart type des actifs immobiliers : 2008-2017. . . 13
1.1 Historical investment volume in Europe : 2004-2017. . . 21
1.2 Property portfolio of the institutional investors across Europe in 2017. . . 23
1.3 Total return and standard deviation in real estate markets : 2008-2017. . . 24
2.1 Decomposition of the historical total return in Central London: 1981-2015. . . 38
2.2 Share of foreign investors in the Central London across time: 2004-2015. . . 42
2.3 Breakpoints of the monetary index according to the Bai-Perron test: 2002-2005. . . . 49
2.4 Impulse response functions following a shock in the monetary supply: 2002-2015. . . 61
2.5 Monetary aggregates for the eurozone, the US and China: 2004-2015. . . 71
2.6 Investment volume in Europe across time: 2004-2015 . . . 71
2.7 Price of foreign currency in terms of units of domestic currency: 2002-2016. . . 72
2.8 Price of domestic currency in terms of units of foreign currency: 2002-2016. . . 72
2.9 Impulse Response Functions following a positive shock to monetary index after QE policies: 2009-2015. . . 78
2.10 Impulse Response Functions following a shock to the 3-month Libor rate: 2002-2015. 79 3.1 Map of the main office markets in Europe. . . 94
3.2 Stock value variations between metropoles sub-groups: 2008-2016. . . 101
3.3 Stock value variations between the German segmentation sub-groups: 2008-2016. . . 104
3.4 Stock value variations for the megalopolitan sub-groups: 2008-2016. . . 106
3.5 European investments in the megalopolis and in the periphery: 2009-2016. . . 107
4.1 Real Prime rent index for the German markets and London: 2002-2017 . . . 132
5.1 Prices index for each type of asset: 2001-2017. . . 154
CHAPITRE 1
L’immobilier est un bien financier unique, défini par une forte hétérogénéité, une faible liqui-dité et un manque de transparence. La particularité de l’immobilier vient principalement de son caractère tangible et non fongible. Un bien immobilier est défini par ses propres caractéristiques (matériaux, étages, surface, adresse, etc.) et ne peut pas être parfaitement répliqué. Chaque actif étant différent les uns des autres, les résultats qui s’appliquent à un actif (ou à un marché) peuvent difficilement être généralisés. La faible liquidité du marché est principalement due à l’aspect réel de l’immobilier direct : la réalisation d’un projet immobilier peut prendre des mois, voire des années (avec la mise à disposition du terrain, la construction de l’immeuble, la vente, etc.). Les importants coûts d’acquisition et de maintenance sont également une contrainte à l’investissement immobilier, réduisant le nombre potentiel d’investisseurs. Le cadre juridique de l’immobilier direct et l’absence d’un marché organisé prolongent encore la durée de réalisation d’une transaction.1 Devaney et
Sco-filed (2014) ont estimé que le temps moyen pour vendre un bien immobilier commercial à Londres (considéré comme le marché le plus liquide d’Europe) est de 135 jours (i.e quatre à cinq mois). L’immobilier étant un marché de gré à gré, il existe un certain manque de transparence. En effet, dans un marché de gré à gré, tous les détails d’une transaction (tels que les prix, les acheteurs, les vendeurs, etc.) ne sont pas nécessairement disponibles publiquement, ce qui rend l’analyse plus difficile. Certains pays sont considérés comme fortement transparent (principalement les Etats-Unis, les Etats européens et les principaux marchés asiatiques), alors que d’autres marchés sont considérés comme « semi-transparents », voire opaques (les marchés émergents ou des marchés avec des bar-rières géopolitiques). L’objectif de cette thèse est d’améliorer la connaissance du marché immobilier européen et d’apporter de nouvelles informations pour les investisseurs, ainsi que pour les utilisa-teurs. Ce travail devrait permettre aux acteurs du marché de l’immobilier de disposer de nouveaux
1
L’immobilier direct correspond à l’achat et à la gestion d’un immeuble (ou seulement d’une partie). L’immobilier indirect consiste à acquérir des parts d’un fonds immobilier ou d’une société cotée.
outils pour analyser ce dernier et de mieux le comprendre.
Cette thèse est consacrée à l’immobilier commercial, et plus particulièrement aux marchés des bu-reaux. Les deux autres classes d’actifs en immobilier commercial sont les commerces et les locaux industriels.2 Alors que l’immobilier résidentiel est fortement corrélé aux ménages, l’immobilier
com-mercial doit être vu comme un actif financier. En effet, les locataires en immobilier comcom-mercial sont rarement propriétaires et une grande majorité des actifs sont destinés à offrir des revenus (tirés des loyers). En Europe, les volumes investis ont augmenté de 60 milliards à 200 milliards d’euros entre 2004 et 2007 (Figure 1.1). Suite à la crise financière mondiale, les volumes investis ont chuté à 67 milliards d’euros en 2009.
Figure 1.1 : Historique des volumes investis en Europe : 2004-2017.
Source : BNP Paribas Real Estate
Depuis, les volumes investis sont en constante augmentation (sauf en 2016) et ont atteint 215 milliards d’euros en 2017, ce qui montre l’intérêt grandissant des investisseurs pour cette classe
2
d’actifs. Cette hausse peut être la conséquence de la bonne performance du secteur, ainsi que de sa faible volatilité comparée à d’autres actifs financiers. L’immobilier est également considéré par les investisseurs comme un actif qui a un pouvoir diversifiant, présentant une corrélation négative avec le marché des actions (Eichholtz, 1996 et Chaudhry, Myer et Webb, 1999 entre autres). De plus, la régulation imposée aux banques et aux assurance (les accords de Bâle et de Solvency) exigent moins de capitaux propres pour réaliser des investissements immobiliers que pour d’autres actifs tels que les actions ou les produits dérivés. Ces éléments renforcent encore la compétitivité du secteur immo-bilier. En 2017, une enquête menée par l’INREV confirme cette hypothèse puisque les investisseurs institutionnels ont déclaré vouloir augmenter la part allouée à l’immobilier dans leurs portefeuilles.3
Au regard des investissements des institutionnels, l’Europe est la région qui a attiré le plus d’in-vestisseurs en 2017, avec 35% du total des volumes investis (source : MSCI).4 Les Etats-Unis sont
le deuxième marché juste derrière l’Europe avec 34%. Le Japon continue d’attirer une part impor-tante des volumes investis (10%), le reste du monde ne se partageant que 21%. Il est intéressant de remarquer que les volumes investis en Europe dépassent difficilement ceux des Etats-Unis malgré le nombre important de pays composant la zone. De plus, en analysant la répartition des inves-tissements par pays, nous pouvons voir que la situation est particulièrement contrastée en Europe (Figure 1.2).
En Europe, le Royaume-Uni est le premier marché en 2017 et représente 25% du total des in-vestissements. La bonne dynamique du marché de Londres et sa dimension internationale (70% d’investissements étrangers) expliquent cette première position. L’Allemagne est le deuxième mar-ché le plus attractif en Europe pour les investisseurs institutionnels. L’Allemagne est le seul pays
3
L’INREV (Investors in Non-Listed Real Estate Vehicles) est l’Association Européenne des Investisseurs des Fonds non cotés.
4
MSCI (Morgan Stanley Capital International) construit et fournit des indices immobiliers couvrant plus de 30 pays et 240 marchés dans le monde. Leur portefeuille est composé d’immeubles détenus par les investisseurs institutionnels dont les banques, les assurances, les fonds de pension, les fonds immobiliers, etc.
Figure 1.2 : Patrimoine immobilier des investisseurs institutionnels en Europe en 2017.
Source : MSCI
européen composé de plusieurs marchés de grande taille, due à la construction décentralisée du pays (suite à la fragmentation de l’empire germanique et à l’unification tardive du pays au XIXème siècle). De plus, l’Allemagne étant la première puissance économique en Europe, les investisseurs sont attirés par la stabilité des différents marchés, ainsi que par leur faible volatilité. La France a attiré, quant à elle, 15% des investissements en Europe. Comme pour l’Angleterre, la France est portée par le marché parisien, qui a concentré deux tiers des investissements en 2017. Cependant, la dimension internationale de Paris est à nuancer, puisque les investisseurs étrangers ne représentent que 30% du volume global.
différentes classes d’actifs. Au total, l’immobilier commercial représente presque 80% du volume global investi en 2017 par les investisseurs institutionnels, alors que l’immobilier résidentiel ne re-présente que 16%. Ce chiffre prouve que l’immobilier commercial doit être étudié comme un actif financier, et non comme un marché de propriétaire occupant. De plus, les rendements locatifs sont souvent plus attractifs pour l’immobilier commercial que pour l’immobilier résidentiel. En effet, la différence entre le rendement brut et le rendement net est souvent plus importante pour le rési-dentiel, dû à un taux de rotation plus élevé, à la législation ou encore à des coûts de maintenance unitaire plus importants. Les investisseurs sont alors plus attirés par l’immobilier commercial qui apporte des rendements plus élevés, ainsi qu’une meilleure liquidité. Les bureaux sont la classe d’actifs privilégiée par les investisseurs et représentent 39% de leur portefeuille. Le commerce et les locaux industriels représentent, respectivement, 26% et 13% de l’investissement immobilier.
La relation entre le rendement global et la volatilité historique (qui peut être un indicateur du risque) montre des différences importantes entre les différents actifs (Figure 1.3). En effet, pour une performance historique équivalente, la volatilité est moins élevée pour les bureaux que pour les locaux industriels. La volatilité historique des prix des locaux industriels est plus importante que celle des prix des bureaux : par exemple, suite à la crise financière mondiale les prix des bureaux ont diminué seulement pendant 2 ans alors que ceux des locaux industriels ont chuté pendant 7 ans, de 30%. Le secteur du commerce a réalisé de meilleures performances que les autres secteurs ces der-nières années mais le niveau limité de produits disponibles pour les investisseurs permet d’expliquer la faible part dans les portefeuilles des investisseurs. En se basant sur les rendements historiques, le risque associé et le nombre de transactions, les bureaux sont la principale classe d’actifs immobi-liers. Cependant, la littérature portant sur ce sujet doit encore être approfondie. L’objectif général de cette thèse est de contribuer à la littérature autour du marché des bureaux et d’apporter de
Figure1.3 : Rendement global et écart type des actifs immobiliers : 2008-2017. Source : MSCI
nouveaux développements sur ce sujet.
Dans cette thèse nous allons principalement nous intéresser à la relation bilatérale entre l’économie réelle et les marchés immobiliers. D’une part, l’immobilier commercial est fortement dépendant de l’environnement économique global. En effet, les fondamentaux du marché (niveau de transaction, taux de vacance, loyers, etc.) sont principalement influencés par des variables telles que le PIB ou le niveau d’emploi. Lorsque l’emploi est en hausse, la demande d’espace de bureaux augmente faisant diminuer le taux de vacance et tirant les loyers vers le haut. Les volumes investis sont éga-lement fortement dépendants du contexte économique comme nous avons pu le voir lors de la crise mondiale récente (Figure 1.1). D’autre part, l’économie mondiale est également liée à la santé du marché immobilier. Les exemples de crises économiques déclenchées par l’éclatement d’une bulle du
marché immobilier sont nombreux à travers le monde. Le secteur bancaire, par le biais des prêts hypothécaires, peut être fortement touché par l’évolution du marché immobilier. Si par le passé les crises immobilières avaient principalement un impact national (Japon, 1990 ; France 1991), les effets sont beaucoup plus internationaux de nos jours suite à la financiarisation du marché. Cependant, si le marché de l’investissement peut être considéré comme partiellement intégré et international, la question peut se poser pour le marché utilisateur. Les deux marchés sont en effet différents. Le marché de l’investissement dépend à la fois de facteurs locaux et internationaux (un choc extérieur aura probablement des effets sur le marché local). Le marché utilisateur est quant à lui moins relié à des facteurs externes et dépend plus de variables locales telles que l’emploi ou la santé financière des entreprises. Nous étudierons ces deux marchés séparément pour déterminer les facteurs écono-miques qui ont pu les impacter lors de ces dernières années. D’un point de vue académique, comme professionnel, il est important d’étudier les deux marchés pour avoir une meilleure compréhension du marché immobilier dans son ensemble.
Avec la crise économique récente, l’impact du nouvel environnement économique mondial sur les marchés immobiliers doit être étudié de manière détaillée. En effet, les plus grandes banques centrales ont mis en place des politiques monétaires expansionnistes suite aux ralentissements importants sur les marchés financiers, aux récessions économiques et à la crise des dettes souveraines. Tout d’abord, les banques centrales ont abaissé leurs taux directeurs à des niveaux proches ou égaux à zéro. L’ob-jectif était d’améliorer la liquidité et le marché interbancaire. L’impact a cependant été limité, dû aux incertitudes élevées. Le faible niveau des taux d’intérêt ne s’est donc pas reflété sur l’inves-tissement privé ou sur les marchés financiers. Les banques centrales ont donc décidé de mettre en place des politiques d’assouplissement monétaire (ou quantitative easing) afin de réduire le risque systémique suite à l’effondrement de Lehman Brothers, à la crise de la dette en Europe et au risque
de déflation. Le quantitative easing est défini comme une politique monétaire expansionniste où la banque centrale achète un montant prédéterminé d’obligations d’Etat ou d’autres actifs financiers pour stimuler l’économie. Ces politiques sont qualifiées de non conventionnelles. Ainsi, de nos jours, il devient plus pertinent d’étudier l’impact de l’abondance de monnaie sur l’économie et sur les marchés immobiliers. Comme les obligations d’Etats et les actions ont été pénalisées respectivement par des rendements de plus en plus faibles et par des contraintes réglementaires, l’afflux de liquidité s’est dirigé vers d’autres classes d’actifs. Les accords de Bâle ou les directives de Solvency ont pour objectif d’assurer la stabilité du système financier en augmentant les capitaux propres nécessaires aux banques et aux assurances lors de l’achat d’actifs financiers. Ces régulations imposent donc une part de capitaux propres plus faible pour les actifs immobiliers que pour les actions ou les produits dérivés. De plus, comme la demande des obligations d’Etats augmente suite au quantitative easing, les rendements ont été tirés vers le bas.5 L’immobilier est donc attractif pour les investisseurs, avec
des rendements élevés, une faible volatilité comparé aux actions et aux produits dérivés, et un besoin en capitaux propres moins important.
Cependant, l’augmentation de la masse monétaire ne devrait pas avoir un effet homogène sur tous les marchés. L’hétérogénéité de l’immobilier a pu induire une réallocation implicite des richesses en fonction des pays et certains marchés auraient donc pu bénéficier de cet afflux de capitaux.
Un des principaux objectifs de cette thèse est d’étudier l’impact du nouvel environnement éco-nomique sur le marché des bureaux et de permettre une meilleure compréhension des dynamiques de marché depuis que les banques centrales ont mis en place les politiques monétaires non conven-tionnelles.
5
La suite de cette thèse sera organisée comme suit : les deux prochains chapitres vont contribuer à avoir une meilleure compréhension de la relation entre les nouvelles politiques monétaires et le marché de l’investissement immobilier. Plus précisément, nous analyserons dans le chapitre 2 les dynamiques du marché de Londres et ses principaux déterminants entre 2002 et 2015, en don-nant une attention particulière à la politique monétaire. Pour cela, nous nous basons sur le modèle théorique ISLM de Mundell-Fleming pour une économie ouverte avec taux de change flexible. Une hausse de la quantité de monnaie en circulation devrait, en théorie, impliquer une augmentation de l’investissement et donc, dans un marché où l’offre est inélastique, une hausse des prix. Afin d’étudier ce phénomène empiriquement, nous allons construire un indice monétaire en pondérant l’offre de monnaie par les volumes investis sur le marché. Tout d’abord, nous estimons un modèle vecteur auto-régressif (VAR) pour étudier les relations statistiques entre les différentes variables. Nous trouvons que le taux de vacance, le FTSE 100, le paramètre autorégressif ainsi que l’indice monétaire sont positifs pour expliquer la prime de risque, alors que l’emploi a un impact négatif. L’effet positif de l’indice monétaire confirme qu’une hausse de la masse monétaire entraine une augmentation des prix des bureaux, et donc de la prime de risque. Cependant, en segmentant la modélisation par sous-période, la réalité est plus complexe et les résultats deviennent hétérogènes. Enfin, nous estimons un VAR structurel pour estimer les effets d’un changement inattendu de la masse monétaire. L’ampleur de la réponse est plus importante après un choc sur la masse monétaire qu’après un choc sur le taux interbancaire, ce qui confirme que le quantitative easing a eu un impact plus important sur le secteur immobilier qu’une baisse des taux directeurs.
Ensuite, nous étudions l’impact de la masse monétaire sur les principaux marchés immobiliers en Europe. Avoir une meilleure compréhension de l’effet hétérogène des politiques monétaires non conventionnelles sur les marchés immobiliers est important. En effet, entre 2009 et 2016, l’afflux de
capital a constamment augmenté en Europe, exerçant une possible pression à la hausse sur les prix. Dans le même temps, la valeur totale du stock de bureaux en Europe a augmenté de 60%, ce qui interroge sur le rôle des politiques monétaires. Cependant, le soutien de la banque centrale sur les marchés immobiliers a pu être hétérogène en Europe, principalement à cause des différences mar-quées entre les pays. Tout d’abord, nous étudions l’impact de l’offre de monnaie sur les marchés des bureaux en Europe en utilisant des données de panel pour confirmer l’effet théorique obtenu grâce au modèle IS-LM (chapitre 2). Les résultats suggèrent que le taux de vacance, l’emploi et l’indice monétaire étaient les principaux déterminants des prix des bureaux pendant la période d’étude. En-suite, nous introduisons plusieurs ségmentations pour tester l’homogénéité de l’effet monétaire sur le marché des bureaux. Au niveau européen, ces résultats sont importants puisque l’hétérogénéité des pays a pu créer des distorsions et des réallocations implicites des investissements et certains marchés ont pu bénéficier davantage de ces nouvelles politiques monétaires. Nous avons trouvé que les métropoles, ainsi que les marchés dans la mégalopole européenne, ont principalement attiré les capitaux. Ce résultat est paradoxal puisque les nouvelles politiques monétaires qui ont été mises en place en Europe pour aider et soutenir les économies périphériques en difficulté ont, au final, favorisé les métropoles et la mégalopole européenne.
Le chapitre 4 est plus en lien avec la recherche en économie immobilière. Comme nous l’avons in-diqué précédemment, le marché immobilier peut être divisé en deux sous catégories : le marché de l’investissement et le marché utilisateur. Après avoir étudié le premier, nous allons maintenant nous pencher sur le second. Dans ce chapitre, nous allons étudier la dynamique des valeurs locatives en Europe et leurs principaux déterminants. Tout d’abord, nous allons supposer que les marchés euro-péens ont la même structure en utilisant un modèle de panel vecteur autorégressif. Nous trouvons que les marges des entreprises nationales, l’emploi, le taux de vacance et le paramètre autorégressif
sont les principaux déterminants du loyer Prime. Les différentes relations entre les loyers et les variables explicatives sont celles attendues : toutes les variables ont un effet positif sur les loyers, excepté le taux de vacance. Cependant, étant donné l’hétérogénéité des marchés immobiliers, l’hy-pothèse d’une structure commune des marchés européens est difficilement soutenable. Pour tester les potentielles différences, nous estimons la même équation pour chacun des marchés. Les résultats montrent que les déterminants sont différents en fonction des marché et qu’une analyse locale est toujours nécessaire pour avoir une compréhension complète du marché. Enfin, nous revisitons la théorie du taux de vacance naturel et nous fournissons un taux de vacance de référence pour chaque marché. Ces résultats montrent que la plupart des marchés européens ont des taux de vacance in-férieurs à leurs taux naturels.
Le cinquième et dernier chapitre tient lieu de conclusion générale sur cette thèse. Nous synthétisons les principaux résultats, ainsi que les contributions scientifiques de nos recherches et ensuite, nous développons quelques perspectives qui peuvent découler de cette thèse ou du contexte actuel.
CHAPTER 1
Real estate is a unique financial asset and characterised by an important heterogeneity, a low liquidity and a lack of transparency. The singularity of real estate is mainly related to its tangibility and its non-fungible aspect. A property asset is defined by its characteristics (materials, level, space, address, etc.) and cannot be perfectly replicable. Each asset is different from the other, implying that what applies for an asset (or a market) might not be the same for the others. The illiquidity is driven first by the physical aspect of the sector: it could take months or even years before a new project emerges, such as a building. The high acquisition or maintenance costs also constrain real estate investments by reducing the number of potential buyers. The legal framework of the direct real estate sector and the lack of an organised market extend the time to transaction.1 Devaney and Scofield
(2014) estimated that the time to sale of commercial property in the London market (considered as the most liquid market in Europe) was 135 days (i.e., four to five months). Because the direct real estate market is an over-the-counter (OTC) market, there is an important lack of transparency. In an OTC market, the details of a transaction (such as prices, buyers, sellers, etc.) are not necessarily public, making the analysis and the pricing more difficult. In some countries, the market is highly transparent (predominantly in the United States, Europe and leading Asian markets); in others, it could be qualified as semi-transparent or even opaque (mostly emerging markets or markets with geopolitical barriers). The aim of this thesis is to provide insight into this singular market at the European level and to impart some new information for investors and occupiers. This work should provide new tools to analyse the real estate sector and a better understanding for the market players. This thesis focuses on commercial real estate and, more specifically, on the office market. The two other asset classes are the retail and the industrial sector.2 The residential sector is mainly driven
1
Direct real estate investments involve the purchase and the managing of a building (or a part of a building). An indirect investment consists of buying shares of a fund or a publicly or privately held company.
2
by households, but commercial real estate should be seen as a financial asset. Indeed, occupiers are hardly ever the owners of a particular building, and the vast majority of the assets are intended to provide income (stream form rents). In Europe, that investment volume increased from e60 billion to e200 billion between 2004 and 2007 (Figure 1.1). Following the global financial crisis (GFC), investment volume dropped to e67 billion in 2009.
Figure 1.1: Historical investment volume in Europe: 2004-2017. Source: BNP Paribas Real Estate
Since then, investment volume constantly increased (except in 2016) and reached e215 billion in 2017, showing the growing interest of investors for the real estate sector. This rise can be attributed to the good performance and to the lower volatility of the real estate sector than other financial assets. In addition, real estate is believed to provide portfolio diversification benefits via its low and negative correlation with the stock market (Eichholtz, 1996 and Chaudhry, Myer and Webb, 1999 among others). The regulations imposed on the banking sector and on the insurance companies (the Basel Accords or the Solvency Directive) require less regulatory capital for real estate investment than for stocks or derivatives. These elements contribute to reinforcing the competitiveness of real
estate investments. A 2017 survey published by the INREV association corroborates that point, showing that institutional investors continue to increase the real estate allocations in their portfo-lios.3
According to the institutional investors’ portfolio, the region that attracted the most of the invest-ment in 2017 was Europe, accounting for 35% of the total amount invested (source: MSCI).4 The
United States was the second market, just behind Europe, with 34%. Japan continues to attract a significant portion of the invested volume (10%). The rest of the world shared only 21%. An impor-tant remark is that the European market hardly exceeded the United States, despite the imporimpor-tant number of countries in Europe. By analysing the country breakdown, we can see that the situation is much contrasted across Europe (Figure 1.2).
In Europe, the United Kingdom was the first market in 2017 and accounted for 25% of the total investment. This leading position is due to the global city of London and its international dimension (with around 70% of overseas investors). The second most attractive market in Europe for insti-tutional investors is Germany. The situation in Germany is different from the other countries with five big markets, because of historical reasons, such as the fragmentation of the Holy Germanic Em-pire and the late unification of the country in the 19th century. Moreover, because Germany is the leading economic country in Europe, investors are attracted by the stability and the low volatility. Finally, France draws 15% of the total investment volume in Europe. As for the United Kingdom, France is mostly driven by the Parisian market, which attracted two-thirds of the investments in 2017. However, the international dimension of Paris is less important than that of the London mar-ket, with less than 30% of foreign investments. The three main countries accounted for more than
3
The INREV is the European Association for Investors in Non-Listed Real Estate Vehicles.
4
MSCI is a global provider of real estate indexes, covering more than 30 countries and 240 cities worldwide. Its portfolio is composed of buildings owned by institutional investors, including banks, insurance companies, pensions fund, hedge funds and REITs.
half of the total investment.
Figure 1.2: Property portfolio of the institutional investors across Europe in 2017. Source: MSCI
In addition to the important heterogeneity across geographical area, there is a distinction across real estate assets. Altogether, commercial real estate accounted for almost 80% of the total amount invested in 2017 by institutional investors, and the residential market represented only 16%. It confirms that commercial real estate should be seen as an investment asset rather than a homeowner market. Moreover, yields are often more attractive for commercial real estate than for the residential market. Indeed, the difference between the gross and the net yield is greater for residential assets because of important turnover, legislation, higher management fees, and so forth. Investors are thus more attracted by commercial real estate that brings higher income and liquidity. Offices are the main asset for investors and represent 39% of the investors’ portfolio. The retail and the industrial
sectors account for 26% and 13%, respectively.
Figure 1.3: Total return and standard deviation in real estate markets: 2008-2017. Source: MSCI
By studying the relation between the total return and the historical volatility (representing the risk), we can see the main differences of the assets (Figure 1.3). For an equivalent performance, the historical volatility for offices is less important than for the industrial sector. This is mainly explained by the prices’ volatility; for example, after the GFC, office prices decreased for only two years, and industrial prices dropped for seven years by 30% overall. Moreover, office prices reached their pre-crisis level in 2013, when industrial prices were still largely below. The retail sector out-performed the other sectors during the past ten years, but the low level of supply explains the small proportion of retail assets in investors’ portfolios. According to the historical return, the associated risk and the number of transactions, offices are the main real estate asset. However, the literature
on this topic still needs to be further expanded. The general purpose of this thesis is to contribute to the office market literature and to bring new development on the subject.
Here, we will focus primarily on the economic dimension of the real estate market. The relation between the global economy and real estate is well known and in both ways. On one side, the real estate market is highly dependent on the economic environment. For commercial real estate, the market fundamentals (transaction level, vacancy rates, net absorption, rents, etc.) are mostly driven by economic variables, such as the GDP and employment growth. For example, when employment increases, the demand for office space rises and the vacancy rate should decrease. In addition, in-vestment volumes are highly dependent on economic conditions, as we have seen during the GFC (Figure 1.1). On the other side, the global economy is highly related to the real estate market. Ex-amples of crises triggered or exacerbated by the bursting of housing market bubbles are numerous throughout the world. Moreover, the banking sector is highly dependent on the real estate market conditions, mainly on the home equity loans. Until the end of the 20th century, the bursting of the property bubbles mainly affected the national market (Japan, 1990; France, 1991). Today, following the internationalisation and the financialisation of the real estate market, bubbles have had a global effect. However, if the investment market should be seen as partially integrated and international, the question should be raised for the occupier market. The two markets are significantly different. The investment markets depend on national factor and on the global economy, meaning that an external shock might have an effect on a market. The occupier market is much more independent and related to locally based economic factors, such as the employment growth or the financial health of local companies. This thesis studies these two specifics and distinct markets separately to provide insight into the economic factors that might affect each of the markets. From an academic and from a practitioner’s point of view, it is important to study both the occupier and the investment market
to gain a better understanding and a complete picture of the real estate market.
Because the real estate market and economic factors are closely related, the contemporaneous eco-nomic environment should be studied carefully. Since the GFC and the major downturns in financial market, followed by a deep economic recession and the European debt crisis, the main central banks have undertaken expansionary monetary policies. First, central banks have lowered their interest rates to zero or to levels close to zero. The aim was to boost the liquidity and the interbank lending market. The effect on the global economy is limited because of the considerable uncertainties. The low interest rate has not resulted in an increase in private investments, and both the financial market and the real economy were still struggling. Thus, the major central banks have decided to establish a quantitative easing program to reduce the systemic risk following the collapse of Lehman Brothers, the European debt crisis and the deflation risk. Quantitative easing (QE), also known as ’large-scale assets purchases’ (LSAPs), is defined as "an expansionary monetary policy whereby a central bank buys predetermined amounts of government bonds or other financial assets in order to stimulate the economy"5 and is qualified as an unconventional monetary policy. Today, it is important to study the effect of the abundance of available money on the real estate market: the increase of the money supply implies a rise in the capital available for investments. As government bonds and stocks are less attractive because of the lower returns and important regulatory constraints, the inflow of liq-uidity should move towards other investment assets. The Basel Accords and the Solvency Directive regulations aim to ensure the solvency of institutions (both the banking and the insurance sector) and the overall economic stability by increasing the capital requirement when the financial exposure is significant. The regulations imply a greater capital requirement for stocks or derivatives to hedge against financial and operational risks. Moreover, as the demand for governmental bonds increased
5
(following the quantitative easing), the yields were driven downward.6 Thus, real estate has become
more attractive for investors and requires less capital, given its low volatility when compared with stocks and derivatives (25% of equity requirement, compared with 40% to 50% for shares).
However, the rise of the money supply should not have the same effects according to the market. Indeed, the heterogeneity of real estate might have produced implicit wealth reallocation movements across countries and some markets might have benefited more from this inflow of capital.
Thus, the goal of this thesis is to study the effect of the new economic environment on the office market and to allow a better understanding of the market dynamism because the central banks have implemented unconventional monetary policies.
The remainder of this dissertation is divided as follows: The next two chapters contribute to providing a better understanding about the relation between the new monetary policies and the real estate investment market. More precisely, chapter 2 analyses the dynamics of the direct Central London office and its most relevant determinants from 2002 to 2015, giving special attention to the monetary aggregates. We consider an IS/LM Mundell-Fleming framework for an open economy with a flexible exchange rate to describe the link between the available money supply and the London office market dynamics. Theoretically, an increase in the money supply should result in a rise of capital inflow and, given the inelasticity of the supply, an inflation of office prices. To empirically explore this phenomenon, we constructed a monetary index using an appropriate aggregation of the money supply. First, we ran a VAR model to estimate the statistical relation between variables, and we found that the vacancy rate, the FTSE 100, the autoregressive parameter and the new monetary index were significant and had a positive effect on the risk premium, while the employment level
6
had a negative effect. The positive effect of the monetary index indicates that an increase of the money supply does lead to a rise of office prices. However, by studying the same model for different sub-periods, we showed that reality is complex. Finally, we ran a structural VAR to estimate the ef-fect of unexpected monetary policy changes. The response of the risk premium was more important following a shock in the money supply than a shock in the interbank rate, confirming the greater effect of quantitative easing on the real estate sector.
Next, we studied the effect of money supply on the main real estate market across Europe. It is important to have a better understanding on the way unconventional monetary policies hetero-geneously affect real estate. Between 2009 and 2016, the capital inflow strongly and constantly increased in Europe, driving prices up. The total value of the office stock increased by 60% during this period, causing people to question the role of monetary policies on the inflation of these prices. The central bank’s support for the real estate market might have different effects across Europe, mainly induced by the willingness to create an economic area with heterogeneous countries. First, we studied the effect of the money supply on European office prices by using panel data analysis to confirm the theoretical effect of the monetary aggregate on the real estate market at a European level, such as in the previous chapter. The results suggest that the vacancy rates, the employment level and the monetary index were the main determinants of office prices during the whole period. Next, we introduced several segmentations to test the homogeneity of the effect of increasing the money supply in the real estate market. At the European level, this result was crucial. The het-erogeneity across countries might have generated distortions and implicit reallocation trends: some cities could benefit more from the new ECB policies. We found that the largest cities and the ones in the megalopolis were the most able to attract the liquidities. The paradoxical effects of the new monetary policies, which were made to support peripheral markets but mostly favoured the largest
cities and the megalopolis, raise some challenging economic and political questions.
Chapter 4 is much more part of real estate economic research. As previously indicated, a real es-tate market can be divided into two sub-markets: the investment and the occupier markets. After studying the first sub-market in the two first chapters, we found it was necessary to have a better understanding of the occupier market and its main drivers. In this section, we study the rental val-ues and their most relevant determinants across Europe at two different geographical levels. First, we considered that European markets have the same structure by using a panel VAR modelling. We found that the margin of national companies, the employment level, the vacancy rate and the autoregressive parameter were the main determinants in the dynamics of the primary rental values. The responses of the rent prices to changes in the variables were consistent with the theoretical expectations: all of the variables had a positive effect on the rents, except for the vacancy rate. However, given the heterogeneity of the real estate markets, the hypothesis of a common structure across European markets would be hardly sustainable. To test the potential specificities, we ran the same equation for each of the markets. The results showed that the drivers were different according to the markets and that a local analysis was required. Finally, we revisited the natural vacancy rate theory and provided empirical benchmarks for each office market. The results showed that most of the European office markets had vacancy rates below the natural rates.
The fifth and last chapter consists of the general conclusion. We synthesise the main results and scientific contributions of our research and then discuss potential research opportunities resulting both from this thesis and from the actual context.
CHAPTER 2
INTERNATIONAL MONEY SUPPLY AND
REAL ESTATE RISK PREMIUM: THE
CASE OF THE LONDON OFFICE
MARKET.
Published: Journal of International Money and Finance, Volume 82, April 2018.
Keywords: Real estate, Office market, Direct risk premium, Monetary policies, Structural VAR Mots-clés: Immobilier, Marché des bureaux, Prime de risque, Politiques monétaires, VAR structurel
Abstract
The main purpose of this study is to deeply investigate the determinants of the risk premium for the Central London market between Q2-2002 and Q3-2015 using a vector autoregression (VAR) model. We shed new light on the role of central banks in the historical level of the commercial real estate risk premium. Indeed, since the global financial crisis (GFC), central banks have used unconven-tional monetary policies, increasing the quantity of money available in the economy and creating structural changes. Therefore, we have described the link between monetary policies and real estate using a theoretical IS/LM Mundell-Fleming framework for a small open economy with a flexible exchange rate. To empirically explore this phenomenon, we have constructed a monetary index adapted to the office market. We find that throughout the whole period (2002 to 2015), the vacancy rate, the employment in services, the FTSE 100, the new monetary index and the autoregressive parameter are the main determinants of the historical risk premium. However, this result hides the complex realities of different sub-periods. Finally, we study the structural changes introduced by the monetary policy using a structural VAR model and impulse-response function.
Résumé
L’objectif de cet article est d’étudier les déterminants de la prime de risque immobilière pour le marché de Londres entre le T2 2002 et le T3 2015, en utilisant un modèle vecteur autorégressif (VAR). Nous mettons également en perspective le rôle des banques centrales dans la variation de la prime de risque, suite à la mise en place des politiques monétaires non conventionnelles depuis la crise financière de 2007. Théoriquement le lien entre l’offre de monnaie et le marché immobilier peut être analysé grâce à un modèle IS/LM pour une économie ouverte, avec des taux de change flexibles. Pour vérifier ces hypothèses, nous avons construit un indice monétaire adapté au marché des bureaux. Sur toute la période (2002 à 2015), le taux de vacance, l’emploi dans les services, le FTSE 100, l’indice monétaire et le terme autorégressif sont les principaux déterminants de la prime de risque. Cependant, ce résultat global cache une réalité complexe sur les différentes sous-périodes. Nous avons enfin analysé les changements structurels introduits par les politiques monétaires grâce à un modèle VAR structurel et aux fonctions d’impulsion de réponse.
1
Introduction
Our aim in this study is to analyse the dynamics of the direct Central London office market risk premium and its most relevant determinants from 2002 to 2015, giving special attention to the changes in the money supply. We therefore suggest a specific international monetary index as a determinant of the real estate risk premium. Although the Central London office market is one of the most analysed office markets in the real estate economics literature, as reported by Hendershott, Lizieri and MacGregor (2010), our understanding of its mechanism is still fragmented and requires deeper investigation, especially after the global financial crisis (GFC). One of the main drawbacks of the Central London office market is the availability of data and its high volatility. In this study, we are able to use a private database of high quality that provides an exhaustive description of the occupier market and of the investment market in London.
A growing amount of literature has been devoted to the London office market modelling, focusing on the main determinants and potential risk factors. Wheaton, Torto and Evans (1997) highlight the importance of the role played by employment in the cyclicality of the office market. Hendershott, Lizieri and Matysiak (1999) report the relative importance of employment and interest rate fluctu-ations. Similarly, Hendershott, MacGregor and Tse (2002) confirm the crucial role of employment. Rent dynamics are also a point of interest - for instance, with Hendershott et al. (2010). Lizieri (2009) developed a model in which employment, interest rates and inflation can explain the rent levels in the London City office market. Moreover, some authors (e.g., Wheaton et al. (1997), Farelly and Sanderson (2005), Hendershott et al. (2010) and Lizieri (2009), among others) shed light on the persistence of real estate cycles. The recent article by Lizieri and Pain (2014) should also be mentioned. Analysing the relationship between the production of financial space and systemic risk, they highlighted the crucial role of the London City office market in the diffusion process during
the GFC.
The global determinants of office returns have been largely analysed in the real estate economics literature, as reported by Sivitanidou and Sivitanides (1999), Hendershott et al. (1999), De Wit and Van Dijk (2003) and Hendershott and MacGregor (2005), among others. These articles underline the fact that the supply and demand relationships are related to variables such as construction, absorption, vacancies, rents, employment growth and real interest rates.1 However, with the recent
rise of unconventional monetary policies, it is important to study the impact of the abundance of available money on the real estate market (Appendix A). Indeed, the increase of the money supply implies a rise in the spending power, with a drop in interest rates, creating more capital available for investments.2
Since the seminal study led by Friedman and Schwartz (1963), the impact of monetary policies has been extensively analysed in the economic literature. Following Lucas (1972) or Tobin (1977) (among many others), the deep analysis of the process by which the monetary policies are trans-mitted into economic changes has been one of the main topics in the economic debates (Ramey 2016). For instance, Bernanke and Kuttner (2005) focused on the stock market’s reaction to Fed-eral Reserve policy. They reported that "the effects of unanticipated monetary policy actions on expected excess returns account for the largest part of the response of stock prices". Mishkin (2007) highlighted the important role of the real estate market and especially the housing market in the monetary transmission mechanism. Taylor (2007) indicates that there is a link between the Federal Reserve System’s adoption of an accommodative policy between 2002 and 2004 and the housing
1
However, these variables are acknowledged to exhibit endogeneity biases. In this context, there is a need to use a robust econometric method that includes simultaneous equations: the seminal VAR modelling introduced by Sims (1980) is a good candidate.
2
Money supply is defined as the total amount of monetary assets and other liquid instruments circulating in a country at a particular time.
bubble in the US. Johnson (2000), Bredin, O’Reilly and Stevenson (2011), as well as Anderson, Boney and Guirguis (2012) (among others), reported that real estate investment trusts (REITs) followed the same pattern as other financial assets regarding monetary policy rate changes.
Nevertheless, the GFC in 2008 introduced a breakdown in the monetary policies. ’Quantitative easing’ (QE), also known as ’large-scale assets purchases’ (LSAPs), is defined as "an expansionary monetary policy whereby a central bank buys predetermined amounts of government bonds or other financial assets in order to stimulate the economy" and is qualified as an unconventional monetary policy.3QE has generated a growing amount of literature focusing on the role of real estate markets
in the transmission mechanism of money supply (Joyce et al. (2012), Feroli et al. (2012), Gabriel and Lutz (2014), Chiang et al. (2015), etc.). This monetary policy breakdown, followed by the so-called ’currency war of 2009-2011’, gives us the opportunity to shed new light on the real estate risk premium in the London office market, introducing a specific monetary index as a determinant, and to use this market as a case study for the effects of monetary policies. We therefore follow Rozeff (1974), who introduced monetary variables to analyse the impact of money supply on stock prices, and we develop this approach to apply to the real estate office market.
The link between the monetary policy and the London office market dynamic may be described in a simple IS/LM Mundell-Fleming framework for a small open economy with flexible exchange rates.4 The Mundell-Fleming framework is an extension of the IS-LM model and is used to study
the relationship between an economy’s interest rate, nominal exchange rate and national output. The general equilibrium is obtained by combining the simultaneous equilibrium in all the markets: the interest, the assets (goods and services) and the exchange rate. Thus, the total output of an
3
"What is quantitative easing?" Bank of England. Retrieved December 14, 2016.
4
As reminded by S. Fisher in his lecture at the IMF, the Mundell-Fleming framework is still one of the best theoretical frameworks to analyse capital mobility and stabilization under flexible exchange rates.
economy is related to a change on both interest and exchange rates. A change in money supply will create a distortion in the interest rates equation (the local and the global interest rates will not be equal anymore), implying an adjustment of the real exchange rate and of the assets market until local and global interest rates are equal again. A change in the global interest rate will have an impact on the capital flows, the local currency and the net exports with an adjustment of the local interest rate. Finally, the model shows that, in case of a positive change in government expenditure, the flexible exchange rate will offset the effect on the national output, with a capital flight towards foreign economies.
Here, we may consider a relationship between the London office supply (used as the output Y), the exchange rate and the interest rate: an increase of the Bank of England money supply (or an LSAP) shifts the LM curve to the right. This induces a decline of local (domestic) interest rates relative to global (foreign) interest rates. Capital outflow increases, leading to an increase of the real exchange (depreciation of the GBP, ceteris paribus). Ultimately, it shifts the IS curve to the right until local interest rates equal global interest rates (assuming horizontal balance of payments). Also acknowledged in the real estate economic literature, we may mention that the short-term office market supply is inelastic: with an increase of money supply, the stock will not be adjusted in the short/medium term, leading to a rise of the office prices (and thus an increase in the real estate risk premium).5 Due to the depreciation of the local currency and the relative appreciation of the
foreign currency, we should expect a capital inflow from the global economy relative to the local economy and consequently, a change in the identity of investors. Local real estate is cheaper for foreign investors, and we should also observe an arbitrage in asset markets: real estate offers higher
5
A decrease in the money supply will cause the exact opposite process, ceteris paribus. It would be possible to develop a formal model of this mechanism for the office market, with short-term inelastic supply, sticky prices and imperfect capital mobility. Nevertheless, our purpose here is more empirical through the introduction of the monetary index in VAR and SVAR modellings.
returns compared to bonds and shares, ceteris paribus.6 Here, we suggest a specific and dynamic
monetary index to assess this money supply variation.
Our methodological contribution is twofold. First, in order to take into account the international dimension of the London market and its evolutions, we introduce and compute a dynamic specific composite monetary index. Second, in order to analyse the potential determinant candidates of the direct office risk premium dynamic, we suggest the use of structural VAR (SVAR) modelling. The SVAR model highlights the potential contribution of the index during a volatile and crisis period, marked by relevant breaking points in the monetary policy.7
At first sight, the monetary index and the interest rates series appear to offer significant explana-tions of the London premium throughout the period (2002 to 2015), but this hides a very different reality. Indeed, before the GFC, neither the rates nor the index were significant. The main deter-minant is exogenous and involves the Olympic Games effect. During the GFC and after 2009, our monetary index is strongly significant, contrary to the interest rates. The office market reacts to the monetary policies through an upward adjustment of prices during the QE period. The structural model exhibits the same kind of results when we consider an unexpected monetary shock on the economy. Office prices face a more important adjustment during an unexpected monetary shock than during a shock on interest rates.
The paper proceeds as follows. Section 2 describes our theoretical framework. It explains our method-ology and how we extend the previous literature on the subject. Section 3 is devoted to the presen-tation of the model and of the data. Section 4 presents the empirical results that show the relevance
6
This mechanism could be described in the theoretical IS/LM framework developed by Blanchard (1981).
7
The effects of monetary shocks, defined as an unanticipated deviation in a central bank’s policy (Campbell et al., 2012; Wright, 2012; and Nakamura and Sternson, 2015), may be relevantly analyzed within a structural vector autoregression (SVAR) framework, as suggested by Barsky and Sims (2011), Francis et al. (2014) and Ben Zeev and Khan (2015).
of our dynamic composite monetary index. Section 5 is the conclusion.
2
Theoretical framework and stylized facts.
2.1 Real estate risk premium
Also acknowledged in the literature, the real estate risk premium is defined as the difference between the property total return and a non-risky asset (usually the national 10-year bond).8The total return
is divided into two components: the income return and the capital growth. The first is the net income received by the owner, expressed as a percentage of the invested capital.
Income Return = Nt
CVt-1
The capital growth is the percentage of variation between the capital value at the end of the period and the amount originally invested.
Capital Growth = CVt CVt-1− 1 Thus: Total Return = Nt CVt-1 + CVt CVt-1− 1, (2.1)
with Nt the net income received at time t, and CVt the capital value at time t.
In the professional literature, it may happen that the risk premium is reduced to the yield gap; that is, a simple difference between the income return and the risk-free rate, omitting the capital growth. This simplification is problematic. According to historical values, the average total return9 is indeed mainly directed by the capital growth (Figure 2.1), and we can suspect that the
8
See, for example, Young, Geltner, McIntosh and Poutasse (1995), Geltner and Miller (2007), Brueggeman and Fisher (2015).
9
informational content of the yield gap is poor.
Figure 2.1: Decomposition of the historical total return in Central London: 1981-2015. Source: BNP Paribas Real Estate
Notes: The total return is the sum of income return and capital growth. The income return is the net income received by the owner, expressed as a percentage of the invested capital. Capital growth is the percentage of variation between the capital value at the end of the period and the amount originally invested.
During the first cycle (from 1987 to 1993), the capital value jumped during the first three years. When the investment volumes dropped due to global uncertainties, prices collapsed, causing a neg-ative total return during those three years. The second real estate cycle ended in 2002 with a crisis in the occupier market due to the dot-com crash. Following the crisis and the collapse of major
commercial real estate investments. These segments are defined as Core, Value Add and Opportunistic strategies. The Core is the least risky investment strategy, with fully leased and secure class A building in major markets. Value Add are investments with medium risk/medium returns and involved mispositioned properties requiring improvement. Opportunistic investments are the riskiest and relate to building that need a high degree of refurbishment in order to realize their potential.
companies, the vacancy rate in London jumped from 4% to 12.3%, and the capital value decreased. After 2004, the market experienced three years of record highs with important investments, strong demand, high prices and high rents. With the subprime crisis, the prime capital value dropped between 2007 and 2009 by 42%.10However, as we can see in Figure 2.1, despite the global economic
downturn, the capital return was strongly negative just for one year, before quickly recovering. Trying to reduce the effect of the GFC, central banks decided to adopt non-conventional monetary policies. In this context, the London market reached a historical peak in 2016 at 49 272 euros per square meter.
2.2 The London office market: some stylized facts
An office market strongly related to financialization and globalization
Since the early 80’s, the office market in London has been growing, and its stock value can be estimated at approximately 270 billion in pounds sterling. According to the Global Financial Centers Index, London was the first financial centre in 2016, before New York and far ahead of its main competitors in Europe (Zürich: 9th rank; Frankfurt: 19th rank). This market is characterized by two main aspects: globalization and finance. Since the nineteenth century, London has been qualified as a global city, with a growing importance in terms of international financial services, especially since the mid-80s and the so-called ’Big bang’. According to Sassen (2006) (reported in Lecomte 2012), a global city is "a strategic site for the management of the global economy and the production of the most advanced services and financial operations", and the London office market satisfies these conditions. As an illustration, and according to TheCityUK, London is the first OTC (Over the
10
The prime capital value is the price per square meter for an office unit of standard size, of the highest quality and specification and in the best location of the market.
Counter) market for derivatives, the first exchange rates market (with a volume of 37% of world transactions in 2016, more than the added volumes of New York and Tokyo). London is also in second place for asset management and in first place for foreign investors. The London Stock Exchange (LSE) reports the highest number of cross-listed firms, and the insurance industry sector is the first in Europe and second in the world. According to Hendershott, Lizieri and MacGregor (2010), financial employment represented 73% of total employment in the City of London in 2006. It is informative to link this percentage with the statistic reported by Lizieri (2009), who observed that more than 85% of real estate space in the City was occupied by financial and professional services in the same year.
A few elements of the London urban policy
Important urban topics must be reported. Thornley (2015) argues that, in a long-term perspective, three stages have to be considered for London. The first one is associated with the dismantling of the Greater London Council in 1986, a structure in charge of the metropolitan government, resulting in planning fragmentation. Then, in the 1990s, growing concerns about the competitive position of London led to a new recentralization. The central government and the private sector became indeed increasingly involved in the promotion and the maintaining of London as a ’world city’, the aim of which was to attract international investments. The third stage consisted of organizing a competitive approach to urban regeneration for the funding of projects. On a smaller scale, the Corporation of London (the authority that runs the City) simultaneously launched an institutional reform in the early 2000s to reinvent itself and to market its identity (Kaika, 2010).
The application for the Olympic Games in 2003 and its approval in 2005 must also be mentioned as having a crucial role in this strategy. Vijay (2015) documents, for instance, the rhetoric about
ruins and regeneration developed by planners and officials during the application and its link to the costly developments and the infrastructural changes undertaken thereafter.
These institutional and strategic evolutions helped London to become an emblematic example of a global city (Marchal and Stébé, 2011), as previously mentioned. It went with numerous high rises and architecture projects to rebrand London in the global economy. Appert and Montes (2015) point out that the towers are indeed one of the most striking markers of the contemporaneous metropolization. They also report that more than 50 new towers have already transformed the London skyline since 2000. Following those developments, new territorializations occurred in the old or new business districts from the global companies, and in the central residential districts from the middle and upper classes with the well-known gentrification. This led to Davidson and Lees (2005) arguing that it could be a return in London of the urban model, where centrality is reserved for highly qualified inhabitants. These changes also went with urban planning conflicts, for instance in the northeast of the city (Appert and Drozdz, 2010), or about specific buildings, such as the Shard (Appert and Waine, 2011).
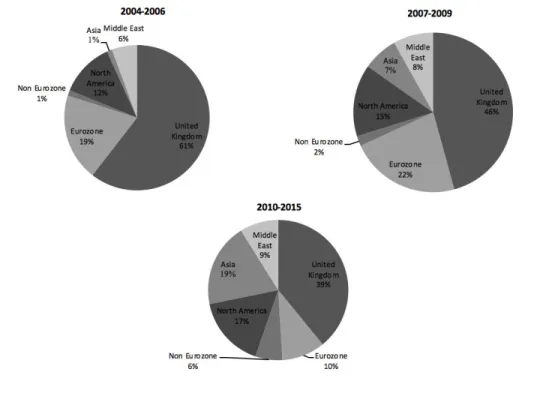
Changes of the investors’ nationalities
From 2004 to 2006, national investments were the main drivers, making up almost 60% of total investments. After 2007, the percentage of foreign investors strongly increased as a potential conse-quence of the depreciation of the GBP relative to other currencies (see Appendix B). This induced an outflow of capital from the UK and an increase of exports for London offices. The national with-drawal may also be explained by the variations in the monetary policies of the Bank of England and of the global economy, inducing the emergence of new investors. An increase of money supply and the use of QE in an economic situation with lower interest rates in the UK compared to the
global economy would have caused this phenomenon of capital outflows and inflows (as described in the Mundell-Fleming framework).
Since 2010, national investments represented only 35% of total investments, and the share of the Eurozone investors was just half as large as it had previously been. Indeed, before 2007, Irish in-vestors were the most important foreign inin-vestors in the London market.11 Due to the economic
downturn, the share of Ireland fell almost to zero, decreasing the total contribution of the Eurozone.
Figure 2.2: Share of foreign investors in the Central London across time: 2004-2015. Source: BNP Paribas Real Estate
The shares of Middle Eastern and East Asian investors sharply increased after the economic crisis. However, while some countries in Middle East amplified their positions (Qatar and Kuwait),
11