Corporate control concentration measurement and firm performance
31
0
0
Texte intégral
(2) Corporate control concentration measurement and firm performance Yves Crama a, Luc Leruth b, Luc Renneboog*,c and Jean-Pierre Urbain d. Abstract: Traditionally share price returns and their variance have been explained by factors linked to the operations of the company such as systematic risk, corporate size and P/E ratios or by factors related to the influence of the macro-economic environment. In these models, the institutional environment in terms of concentration and nature of voting rights, bank debt dependence and corporate and legal mechanisms to change control have rarely been included. In this paper we have a dual objective. We first highlight the large discrepancies among corporate governance environments. We conclude that there is a need for a theoretically well-grounded measure of corporate control applicable to all systems and we define such a measure. Secondly, the impact of ownership structure on the share price performance and corporate risk is empirically analysed for companies listed on the London Stock Exchange. Within Europe, the UK corporate landscape is particularly interesting because of its widely-held nature and the liquidity of the market for controlling rights. Our results point to the fact that voting power, as measured by Z-indices, is tightly correlated to both share price performance and risk. The negative relation between the largest Z-index and corporate share price performance is explained by the fact that the voting power held by executive directors measures the degree of insider entrenchment which has a negative impact on performance. This negative relation is compensated when outside shareholders (e.g. industrial companies, individuals or families) own substantial voting power and may actively monitor the firm. This is because with a counterbalancing pole of control, the largest shareholder is forced to compromise and maximize firm’s profits rather than his or her own utility function. The risk regressions show that entrenched insider as well as large shareholders my seek higher levels of systematic risk. It may be that these shareholders prefer risky high growth strategies which are providing higher levels of private benefits for these types of shareholders at the expense of small shareholders. We also conclude that the classic Herfindahl indices inaccurately measure control, which is reflected in the weaker relationship with performance.. FORTHCOMING IN : Social Responsibility: Corporate Governance Issues, series Research in International Business and Finance (Vol. 17), J. Batten and T. Fetherston (eds.), Oxford: JAI Press (Elsevier Science ltd.), 2003, 123-149. *. Corresponding author: Department of Finance and CentER for Economic Research, Tilburg University, Warandelaan 2, 5000 LE Tilburg, The Netherlands, Email : [email protected], Phone: ++31-13- 466.82.10. a. School of Business Administration, University of Liège; b International Monetary Fund, Washington D.C.; c Department of Finance, Tilburg University; d Department of Quantitative Economics, University of Maastricht.. Key words : power indices, corporate governance, voting rights, shareholder coalitions, corporate performance. JEL codes : G10, G32, G34.
(3) Corporate control measurement and firm performance 1.. 1. INTRODUCTION. Traditionally, share price returns and their variance have been explained by factors linked to the operations of the company such as systematic risk, corporate size and P/E ratios (as in Fama and French, 1992, among many examples) or by factors related to the influence of the macro-economic environment (e.g. Chen, N., Roll and Ross, 1986) In these models, the institutional environment in terms of concentration and nature of voting rights, bank debt dependence and corporate and legal mechanisms to change control have rarely been included. In fact, empirical research on the dynamics of ownership and its impact on corporate performance in European economies has only become possible in recent years. Indeed, while detailed data on ownership for listed corporations in Anglo-American markets have been available for some decades, the European Commission’s Transparency Directive of 1988 (88/627/EEC) has only gradually been integrated into the national legislation of continental European countries.1 Even so, each country retained the right to modulate the Commission’s directive according to its own specific requirements with the result that ownership disclosure regulation of voting rights differs substantially across countries in terms of notification thresholds and frequency.2 In this paper we have a dual objective. Firstly, we focus on highlighting the large discrepancies among corporate governance environments. As environments differ widely, we conclude that there is a need for a theoretically well-grounded measure of corporate control applicable to all systems and we define such a measure. Secondly, the impact of ownership structures on the share price performance and corporate risk is empirically analysed for companies listed on the London Stock Exchange. Within Europe, the UK corporate landscape is particularly interesting because of its widely-held nature and the liquidity of the market for controlling rights. Our results point to the fact that voting power, as measured by Z-indices, is tightly correlated to both share price performance and risk. The negative relation between the largest Z-index and corporate share price performance is explained by the fact that the voting power held by executive directors measures the degree of insider entrenchment which has a negative impact on performance. This negative relation is compensated when outside shareholders (e.g. industrial companies, individuals or families) own substantial voting power and may actively monitor the firm. This is because with a counterbalancing pole of control, the largest shareholder is forced to compromise and maximize firm’s profits rather than his or her own utility function. The risk regressions show that entrenched insider as well as large.
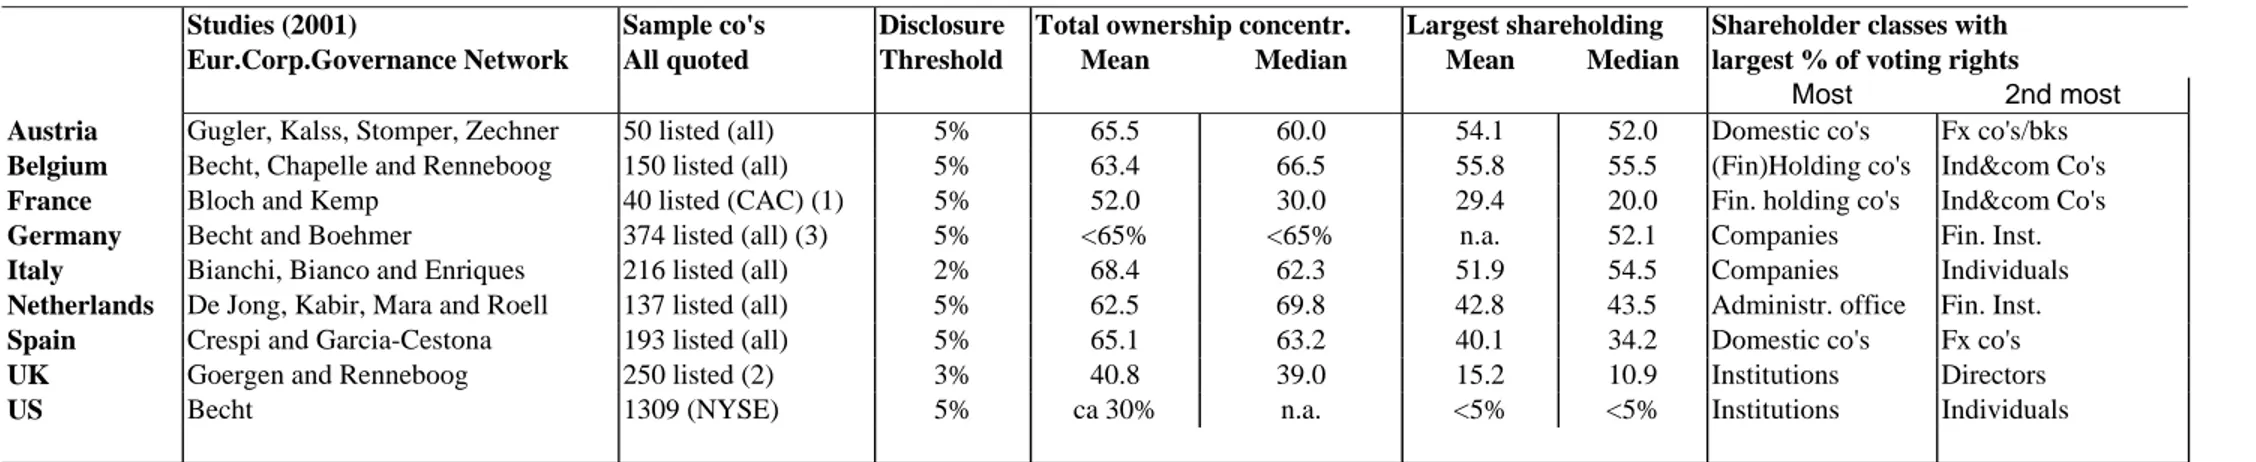
(4) Corporate control measurement and firm performance. 2. shareholders my seek higher levels of systematic risk. It may be that these shareholders prefer risky high growth strategies which are providing higher levels of private benefits for these types of shareholders at the expense of small shareholders. We also conclude that the classic Herfindahl indices inaccurately measure control, which is reflected in the weaker relationship with performance. The paper is organised as follows. Section 2 discusses the main differences in ownership structures in Europe. The section draws upon the research results of the European Corporate Governance Network3. In section 3, we show that voting rights are but one element – albeit an important factor – in the corporate governance framework and we highlight the role of corporate law, minority protection, courts and banks. Section 4 focuses on a key issue in any economic analysis of corporate governance, i.e. the definition of effective measures of control in complex ownership structures, possibly characterised by multiple, intertwined layers of shareholding. We briefly discuss the weaknesses of classical approaches to this issue (via raw voting rights or Herfindahl indices) and we propose an alternative measure of control based on the Banzhaf index which we call the Z index. We illustrate why the Z index more adequately captures each shareholder's negotiating or voting power. On the basis of a sample of UK companies, section 5 provides an econometric illustration of the importance of control dispersion on some key economic variables (beta and returns). We also briefly illustrate how the Z index can be applied in the case of Continental European economies. Conclusions are presented in section 6.. 2. OWNERSHIP CONCENTRATION AND VOTING BLOCKS. 2.1 Insider versus outsider corporate governance systems In spite of the relative paucity of data on voting structures, some striking features emerge from a simple cross-country comparison. For example, Table 1 highlights the major difference in ownership concentration between continental Europe and the Anglo-American countries. In the former, all large (disclosing) shareholders combined own more than 60% of the equity capital4, in the latter these control only about 40% of the voting rights. The differences in voting rights held by the largest shareholder are even more remarkable: the largest owner in the median UK listed company holds a stake of less than 15% and this stake is less than 5% in the US. In contrast the largest shareholder (or group of large shareholders) controls 40-54% of the voting rights on the continent. About 85% of the listed non-financial.
(5) Corporate control measurement and firm performance. 3. companies in Continental Europe have a large shareholder which holds at least a blocking minority (25%) and in about half the companies, one shareholder owns an absolute majority.. <Insert table 1 about here>. The high concentration of ownership in Continental European equity markets is only one manifestation of what is known as an insider system with the following characteristics: (i) the corporate sector has controlling interests in itself because companies are often shareholders of other ones; (ii) the number of listed companies is small compared to the size of the economy; (iii) and the capital market is illiquid because controlling blocks are held by a few dominant shareholders. Worse still, in spite of all the efforts made to simplify corporate structures, there remains a large number of holdings or interlocked companies, which de facto deter any attempt by outsiders to control any of them (Renneboog, 2000). Thus, while given an opportunity to participate in equity returns, outside investors have little hope to trade and acquire control. In contrast, the Anglo-American system is labelled as an outsider system. In that system, the number of listed companies is large; the process of acquiring control (not only participate in equity return) is effectively market-oriented (i.e. there is a liquid capital market with frequently traded ownership and control rights); and there are few corporate holdings or interlocked patterns of ownership. Finally, there are few major, controlling shareholdings and these are rarely associated with the corporate sector itself (Wymeersch, 1994, La Porta et al. 1999).. 2.2 Cash flow versus voting rights Although equity markets in Continental Europe indeed display some similarity, they also markedly differ with regard to a number of criteria. We concentrate on two of them. Firstly, as shown in Table 1, the nature of the main shareholders varies from country to country. Obviously, each category of shareholder has different incentives or abilities to exert control. For example, there is little evidence that institutional investors undertake any disciplinary actions against poorly performing management (Stapledon, 1996). In contrast, corporate shareholders might value dominant shareholding positions, not only for the financial return of their investment, but also for other potential benefits of control, especially when a customer or supplier relation exists with the target company (Barclay and Holderness, 1989)..
(6) Corporate control measurement and firm performance. 4. Secondly, the complexity of ownership structures also varies across countries. Germany, for example, is characterised by complex shareholdings around and within industrial groups (Becht and Boehmer, 2001) while the French system is characterised by ownership cascades of financial groups and cross-company shareholdings (Bloch and Kremp, 2001). In Italy, long pyramids controlled by state or family-owned corporations are typical (Bianchi et al., 2001). More than a third of listed and non-listed Belgian companies are controlled by financial holdings companies (Becht et al., 2001) while in most Dutch listed companies, the separation of ownership and control is almost absolute, as blocks of voting rights are not held by shareholders but by an Administration Office (De Jong et al., 2001). Finally, although state controlled ownership has decreased substantially in Spain since 1995, state holding companies still own a golden-share in strategic sectors (Crespi and Garcia, 2001).. These differences have important implications in terms of the one-share-one-vote principle. Ownership pyramids, for instance, allow power concentration with limited investment, since controlling a target company can be achieved via a number of subsidiaries and a chain of 51% of their voting rights. With one intermediate holding, the ultimate shareholder retains absolute control while only receiving 25% (=0.51×0.51) of the cash flow.5 Whereas legal restrictions have impeded the occurrence of ownership cascades in the UK (Goergen and Renneboog 2002), they are common practice in Belgium, France or Italy. Another way of amassing voting power is through voting pacts and proxy votes. For example, voting pacts are not uncommon in Germany (Chirinko and Elston, 1996) and German banks commonly use proxy votes of the shares deposited in their custody (called the “Depotstimmrecht”, see for example Wenger and Kaserer, 1997).6. Still, a number of mechanisms exist to erode voting power, such as the imposition of voting caps. An extreme case is the Netherlands where under the ‘structural governance regime’, non-voting certificates are distributed to ordinary shareholders while the voting power is given to a foundation controlled by company insiders (De Jong et al, 2001). In Germany, Belgium or Spain, a decision by the board of directors can limit any percentage of voting power to e.g. 5%.7 Whereas dual class shares are frequently used to separate ownership and control in Sweden (Agnblad et al. 2001), this has been actively discouraged in the UK by the LSE (Brennan and Franks, 1997). Finally, since the take-over wave in the 1980s, several.
(7) Corporate control measurement and firm performance. 5. poison pills like shelf registration of equity8, issuing bonds cum warrants or convertible bonds, are frequently used to dilute the voting power of ‘hostile’ shareholders.. 2.3 Corporate governance and agency costs Both the insider and outsider corporate governance systems present weaknesses and advantages which can be analysed in terms of the principal-agent theory (see Table 2). The Anglo-American system, characterised by high dispersion of voting and cash flow rights and called the ‘Weak owners, strong managers’–case by Roe (1994), may induce free riding9 on control. As a single small shareholder only benefits from performance improvements in direct proportion to the cash flow rights, he or she may not find it profitable to monitor management while a large shareholder will necessarily feel differently. This situation may result in agency conflicts between management and shareholders.10 Still, the large free float allows investors to take advantage of portfolio diversification possibilities and introduces the discipline of the (hostile) take-over market11.. Concentration of ownership and voting rights, on the other hand, stimulates corporate governance actions against under-performing management, but may lead to expropriation of the rights of minority shareholders as discussed in panel D of Table 2. Furthermore, share liquidity is reduced due to the low free float and hostile take-overs are virtually ruled out.. <Insert Table 2 about here>. Panels B and C of Table 2 present the other combinations of concentrations of ownership and voting rights which can be attained by some of the instruments described above to amass or dilute voting power. For example, when shareholder coalitions or proxy votes are allowed, the supervisory power of a block of shareholders vis-à-vis management increases, but the agency conflicts shift from shareholder-management towards large versus minority shareholders.. 3.. CORPORATE GOVERNANCE: SYMBIOSIS OF FINANCIAL MARKETS AND. CORPORATE LAW..
(8) Corporate control measurement and firm performance. 6. The discussion above points to the difficulty in explaining corporate governance systems on the basis of conventional theories. In this section, we shall emphasise this critical point before moving on to a discussion of the methodology we use to measure control. Indeed, neither transaction costs theory12, nor principal agent theory13, nor the theory of implicit contracting14 nor the theory of vertical integration15 can fully explain why two governance systems (Continental European and Anglo-American) have emerged or, in a more refined way, why Continental European countries differ in terms of structure and concentration of ownership (cash flow rights) and voting rights. In the previous section, we have shown that the weaknesses of both systems have been partially dealt with through mechanisms separating cash flow and voting rights. In addition however, governments, regulators and stock exchanges have often found it necessary to develop a legal environment able to limit the inconveniences (e.g. agency costs) induced by the corporate governance system.. In fact, historic evolution of regulation has shaped ownership structures, capital markets and corporate governance systems (for a path-dependence theory; see Bebchuk and Roe, 1999). Not surprisingly, there are two broad legal traditions; the common law system, found in Anglo-American countries and the Commonwealth, and the civil law tradition of Continental Europe and its sphere of influence (former colonies). These two legal systems are different in terms of shareholder protection, adherence to the one-share-one-vote principle and creditor protection. According to La Porta et al. (1997, 1998, 2000), the common law system appears to provide stronger shareholder and creditor protection.16 But legal origin can also explain differences in corporate governance systems and the degree of capital market development. In common law countries, the ratio of external capital to GDP is higher, as are the ratio of corporate debt to GDP and the number of listed domestic firms and initial public offerings as a proportion of the corporate population. Whether or not the institutional environment has a momentous impact on economic activity has been explored by a number of authors. In particular, Carlin and Mayer (2001) investigate the relation between economic growth, R&D investment and fixed income formation, on the one hand, and the presence of bank-firm relations, development of security markets, degree of ownership concentration and the legal system on the other. For a sample of companies in 20 countries, there is little influence of banking activity and ownership concentration on economic growth, but they find that legal protection of investors and development of securities markets matter..
(9) Corporate control measurement and firm performance. 7. A seemingly logical implication of the discussion above is that it would be extremely difficult to develop a set of corporate governance regulations applicable to all EU countries without undertaking the difficult task of concomitantly dismantling the existing countryspecific mechanisms that currently provide shareholder protection. Indeed, several attempts made in that direction had to be withdrawn. For example, the mandatory take-over bid requirement for all listed companies included in the first draft of the 13th Company Law Directive was dropped. The consequence would have been a weakening of direct monitoring resulting from reduced voting block sizes (Becht, 1999). The 5th Company Law Directive (now abandoned) aimed at imposing the one-share-one-vote rule on all European companies. As dual class shares would also have been ruled out, there was a danger that shareholders would have reacted by relying increasingly on pyramids and voting pacts in order to retain control, thereby reducing market liquidity.. 4. EFFECTIVE MEASURES OF CONTROL. 4.1 The weakness of Herfindahl indices The previous discussion underlines the difficulty of apprehending the whole intricacy and diversity of the issues surrounding corporate governance. In this context, a most fundamental question appears to be that of measuring the extent to which a given company is controlled by each of its (ultimate) shareholders and to measure the dispersion of control among shareholders. A number of indices have been proposed to answer this question. Most of these indices belong to the Herfindahl family, i.e. they focus on the (square of the) proportion of shares owned by the largest direct shareholder(s) in the company. We claim, however, that such indices do not provide a theoretically sound measure of dispersion.. Let us first tackle the case of the Anglo-American or “outsider” system. Consider a target company whose capital is first diluted from 5 shares to 7 shares, then from 7 to 9 shares, as illustrated in Exhibits 1a to 1c (in Figure 1). It is easy to verify that company A1 has full control over the target in Exhibit 1a, no more control than any other shareholder in Exhibit 1b17 (meaning that dilution leads to less concentration of control in this case), but more than any other shareholder in Exhibit 1c18 (meaning that dilution leads to higher control concentration in this case). Yet, each successive dilution yields Herfindahl indices which.
(10) Corporate control measurement and firm performance. 8. wrongly diagnose less concentration, mostly due to the fact that the proportion of shares owned by company A1 steadily decreases in the process.19 In addition, since Herfindahl indices concentrate on the largest shareholders and totally disregard the float, they fail to integrate a very important element of the potential disciplinary effect of coalitions of small shareholders in the outsider system.. <Insert Figure 1 about here>. Let us next consider the case of the Continental European (or insider) system. By definition, Herfindahl indices can only tackle one layer of shareowners. While this may be a good approximation of reality in outsider systems, a simple look at Exhibit 2 (Figure 1) reveals that it is clearly insufficient in more complex, multi-layered (pyramid) ownership structures. Indeed, should one compute the Herfindahl index on the basis of the largest direct shareholder or take into account the presence of B1 and B2 ? If we do the latter, A2 (or A3 or A4 indifferently) becomes the largest shareholder since B1 would only have the equivalent of 9/5 (= 3*3/5 < 2) direct shares. In practice, however, B1 has more control over T than any other shareholder and a Herfindahl index would fail to diagnose it. Similarly, corporate law fails to capture the whole complexity of the issue. Banking commissions and other regulatory bodies usually rely on rather simple concepts of corporate control, whereby owners are classified into a small number of distinct categories. For instance, a shareholder is said to detain majority control if he controls (directly or indirectly) more than 51 percent of the shares; he has at least a blocking minority if he controls between 25 and 50 percent of the shares (and could be considered to have more control if he has the ability to remove administrators); otherwise, he is viewed as having no control at all. There are many situations, however, where such rules prove unsatisfactory. A striking example occurs when a single individual (call him for instance Bill Gates) owns 20 percent of the shares of a company (call it Microsoft), while the remaining 80% of the shares are totally dispersed among an "ocean" of small investors. In such a case, the main shareholder typically rules the company, while legal regulations would consider him as possessing no significant control. Alternatively, it may happen that a corporate shareholder with more than 50 percent shares in a subsidiary is himself owned by a dispersed group of shareholders, in which case, it is highly debatable whether the subsidiary is controlled or not..
(11) Corporate control measurement and firm performance. 9. Thus, it appears difficult to build indices of corporate control that succeed in providing effective and consistent estimates of ownership dispersion, especially when studying a variety of corporate governance systems. Promising attempts, however, have been made to handle this question within a formal game theoretic framework. The idea is here to model shareholders as players in a voting game, and to use classical power indices (such as Shapley indices, see e.g. Owen, 1982; Crespi and Renneboog 2001) to measure the extent of their control over a target company. Intuitively, such power indices reflect the relative ability of each player (or shareholder) to impose his will to the target company through coalitions with other players. This approach has been applied to the study of corporate control by a few authors (see Cubbin and Leech, 1983; Gambarelli, 1991; Zwiebel, 1995). Yet, their investigations are mostly theoretical and/or restricted to the analysis of a single layer of shareowners.. We propose here to use the Banzhaf index, which measures the ability of a voter to swing the decision in his or her own favour. More precisely, the Banzhaf index of a player can be defined as the probability that the outcome of the voting process changes when the player changes her mind unilaterally, under the assumption that all vectors of votes are equally likely (see Banzhaf, 1965, 1966, 1968). Although there are technical differences between the Banzhaf Index and the Shapley value, both indices essentially capture the same phenomenon and often yield nearly equivalent measures of power. However, we found the Banzhaf Index easier to compute algorithmically, especially in the case of complex structures. The reader interested in a detailed discussion of the differences between the Banzhaf Index and the Shapley value is referred to Dubey and Shapley (1979) and Felsenthal and Machover (1998). Thus, we have computed an index (the Z Index) largely based on Banzhaf’s methodology. For the computation of the Z Index, we have assumed that the float was constituted of a large number of small voters. This is not always done as it is often assumed that only large shareholders matter, in which case the float is neglected by normalizing the total number of shares to the sum of the shares held by the largest identified shareholders.. 4.2 How to compute the Z Index: an illustration We illustrate the computation of the Z Index in the simple cases displayed in Figure 1. Let us first consider Exhibit 1a, and assume that there is one issue concerning T on which.
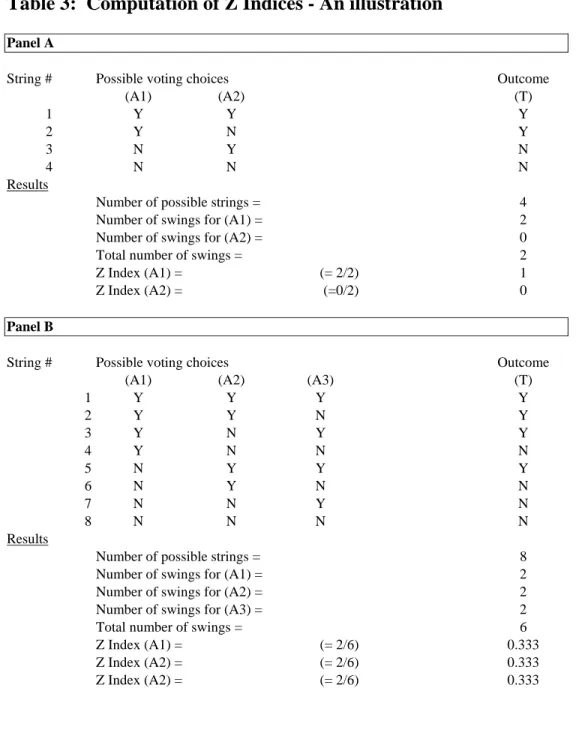
(12) Corporate control measurement and firm performance. 10. shareholders have to vote “yes” or “no”. Assuming that votes are not correlated, there are 4 (22) possible voting strings as shown in Table 3. Among these, there are two where (A1) changes her mind while (A2) does not and the result of the vote changes in both occasions. On the other hand, although (A2) changes her mind twice as well, the final vote does not change in either occasion, reflecting the absolute incapacity of (A2) to affect the outcome. The Z index is computed as the ratio between the number of swings in the final outcome induced by each player over the total number of swings in the final outcome induced by all players. It is equal to 100 percent (2/2) for (A1) and 0 percent (0/2) for (A2), reflecting that (A1) has full control over T, which can readily spot in this very simple case. Let us move to Exhibit 1b where there are 8 (23) possible voting strings among which 4 correspond to situation where (A1) changes her mind while the others do not. Thus, (A1) can induce two swings in the final outcome when changing her mind 4 times. The same holds for both other players, so that a change in the final outcome caused by one single change of mind can only occur in 6 instances. Thus, the Z Index for each player is the same and equal to 2/6 or 1/3. Consider now Exhibit 1c. This time there are 16 (24) possible voting strings. A similar computation, detailed in Table 3 shows that the Z Index has now increased for (A1) from 1/3 to ½ while the Z Index of all three other players has gone down to 1/6. Thus, in contrast to the traditional indices as the Herfindahl, the Z Index provides results which are fully consistent with the intuition discussed in the previous subsection. In particular, the control held by (A1) goes down then up as the capital is diluted.. < Insert Table 3 about here>. In order to make the case that the Z Index can be used in the more complex structures of the insider systems, we consider Exhibit 2 of Figure 1 where there are only 5 players because the vote of (A1) is fully determined by the vote of (B1) and (B2). A similar mechanism based on the analysis of 32 possible voting strings shows that the Z Index is ½ for (B1), 1/6 for (A2), (A3), and (A4) and 0 for (B2).. Using a sample of French companies, we have computed the Z index for the main (possibly indirect) shareholder and compared it with the percentage of shares held by the largest direct shareholder. We display here two exhibits (see Figure 2). In the first exhibit, we show the relationship between the Z index for the main shareholder and the percentage of shares held.
(13) Corporate control measurement and firm performance. 11. when the latter is below 50 percent (about 35 companies). It is readily apparent that the relation between both indicators is highly non linear. In the second exhibit, we display the Z index of the main indirect shareholder for a sample of about 70 companies in which the largest direct shareholder owns more than 50 percent. Note that this does not imply a Z index of 1 because the majority direct shareholder may feature a dispersed ownership structure itself.20 Actually, the graph in Figure 2 suggests that this must often be the case. Thus, it clearly appears that the Z Index provides a strikingly different picture of shareholding structures from that based on the Herfindahl concept. The above discussion also shows that the Z Index (or any index of a similar nature) would provide a sound measure for all systems of corporate governance.. <Insert Figure 2 about here>. In the next section, we use the Z index to analyse the impact of corporate ownership dispersion on the financial performance of UK firms.. 5. EMPIRICAL RESULTS. We have already discussed the main features of the corporate governance system that prevails in the UK. We are now going to describe some of the relationships that emerge between the financial characteristics of firms, on the one hand, and either Herfindahl or Zindices on the other, as they emerge from an empirical study of a panel of listed British firms.21. 5.1 Data sources A random sample of 250 companies quoted on the London Stock Exchange was selected and (yearly) data relative to these companies were collected in the pre-Cadbury period (1988-1993). All disclosed ownership stakes were retrieved from microfiche and hard-copy annual reports: these include all beneficial and non-beneficial shareholders with stakes of 3% or more, as well as all directors’ shareholdings. Whenever a nominee was mentioned as major shareholder, the individual, corporation or institution behind the nominee shareholding was identified by contacting the companies’ finance managers. The risk measures are from the Risk Measurement Service and betas have been calculated via a.
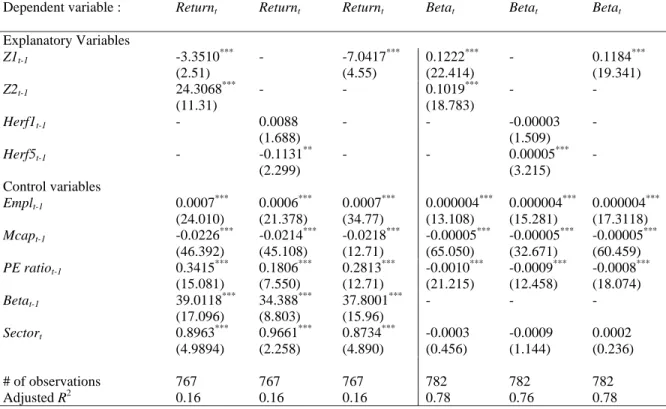
(14) Corporate control measurement and firm performance. 12. Vasicek Bayesian-updating procedure. Share price performance measures are from the London Share Price Database. Accounting and firm specific characteristics data (including several non-risk security characteristics dividends, P/E ratio, etc) are from Datastream.. Table 4 shows the ownership distribution of the random sample of UK firms. Panel A shows that in most firms (187 out of 250) institutional shareholder own large stakes. The second most important category consists of executive directors. The largest share stake across categories is around 13%. Panel B shows that, although institutions are omnipresent, their stakes are smaller (usually below 10%), whereas a higher proportion of the share stakes above 10% is controlled by executive directors. It should be mentioned that blockholders owning large stakes often deliberately remain below the 30% threshold which triggers a mandatory bid on all other shares.. <Insert Table 4 about here>. 5.2 Tests and results In order to illustrate the importance of ownership dynamics in the economy, we report here on two specific issues. First, we investigate the possible link between the performance of a stock and the ownership structure of the firm at the previous period. Performance is measured by annual return, i.e. by the ratio called Returnt in Table 4: (capital gain plus dividend) to (value of the stock at the previous period). Four types of control indices are used to capture the ownership structure of each firm: •. Z1 denotes the Z index of the largest shareholder;. •. Z2 denotes the Z index of the second largest shareholder;. •. Herf1 denotes the square of the percentage of shares detained by the largest. shareholder; •. Herf5 denotes the sum of squared percentages of shares detained by the five largest. shareholders.. The other variables appearing in the regression (Table 4) are included to control for firm specific characteristics. Firstly, we control for corporate size measured by the level of employment (Emplt-1) and market capitalisation (Mcapt-1) as in Demsetz and Lehn (1985). This way, we incorporate the small firm effect on returns and on risk. The small firm effect.
(15) Corporate control measurement and firm performance. 13. has been documented by many studies: small firms are expected to generate higher returns than predicted by the capital asset pricing models as such models understate small firms’ riskiness. As the correlation between the employment and market size is low, the results do not suffer from multicollinearity. Secondly, we include future growth in relation to current profitability as measured by the price-earning ratio (PE ratiot-1). A third control variable represents the systematic risk of the stock as measured by its Beta (Betat-1) and we control for industry effects by including a dummy for the sector of activity (Sectort). Note that a Zindex is defined for each firm’s shareholder while Herfindahl indices correspond to a distribution of ownership for the firm. Thus, while Herf1 and Z1 may correspond to the same unique financial link when the largest direct shareholder also happens to be the largest ultimate shareholder, there is no such similarity between the Z indices and Herfindahl indices of higher order. In a second model, we investigate the possible link between the systematic risk of a stock, as measured by its Beta, and the above indices of ownership structure. Thus, we have obtained three econometric equations (with either H1 and H2; or Z1 and Z2; or Z1 only respectively) explaining returns and three explaining the Beta. Given the presence of missing observations for some years and/or firms in the sample, the models (fixed effects models with time/year specific dummies) were estimated from an unbalanced panel by feasible GLS using estimated cross-section residual variances. Heteroskedasticity robust t-test statistics (in absolute value) are reported in parentheses. The higher the t-test statistics, the more significant the variable is. The main results are summarised in Table 5.. <Insert Table 5 about here>. The relation between ownership concentration, as measured by voting power indices, and performance is expected to be positive, provided that large shareholders assume a monitoring task to ensure that management focuses its efforts on the maximisation of corporate value (Roe, 1994). If, however, large shareholders use their voting dominance to safeguard private benefits of control and to extract rents from the company, large shareholder concentration may be have a detrimental effect on the share price return. Empirical research has not shown convincing evidence of large shareholder monitoring. For example, neither Franks et al. (2001) nor Faccio and Lasfer (1999) find evidence that large shareholders are involved in corporate governance actions like managerial disciplining, but confirm that executive ownership entrenches management. For Continental Europe where.
(16) Corporate control measurement and firm performance. 14. blockholders are more prominent, there is evidence that the presence of substantial shareholders has a detrimental impact on corporate returns. For example, Banerjee et al. (1997) and Renneboog (2000) show that respectively large French and Belgian holding companies do not monitor their investments and are not well monitored, which may account the discount compared to their market break-up value. Thus, if large shareholders pursue private benefits of control and if the codes of conduct and corporate law do not sufficiently curb the extraction of corporate rents by large shareholders, this may be reflected in lower corporate returns. Similarly, the presence of dominant large shareholder combined with inefficiencies initiated by private benefits (like the choice of a non-optimal investment policy) may increase systematic risk.. Table 5 shows that the Z-indices are highly significant in both models tested. The Z voting power index of the largest shareholder is negatively correlated with return. This implies that a company with strong concentration of voting power in the hands of one single shareholder generates a lower return than a widely-held firm. An analysis of the type of shareholders with the highest voting power reveals that it is the large pivotal shareholdings (and hence high Z-indices) held by executive directors who are directly responsible to the negative sign. This suggests that executive directors owning large ownership stakes succeed in building entrenched positions such that the corporate focus on not on value maximisation. Several papers found strong evidence that directors can extract private benefits of control at the detriment of shareholders (Johnson et al., 2000; Dyck and Zingales, 2001) or manage to insulate themselves from any corporate monitoring even in the wake of poor performance (Zwiebel 1995, Franks et al. 2001, Crespi and Renneboog 2001). In contrast, when managers have less discretion as a result of smaller relative voting stakes, the negative relation between control and return is reversed indicating that large monitoring shareholders have a beneficial impact on corporate performance. The presence of a large second shareholder may reduce potential rent extraction by directors and hence have a positive impact on the share price return. In other words, when there exists a counterbalancing pole of control (both Z1 and Z2 are high), utility functions are usually different and the best compromise is then to maximize profits. This balancing effect clearly appears as the coefficient of Z2 is significantly positive while that of Z1 is significantly negative..
(17) Corporate control measurement and firm performance. 15. By contrast, the coefficients of Herf1 is not significant and Herf5 is only statistically significant at a lower levels. The Herfindahl index measuring the dispersion of control of the largest 5 shareholders shows that more diffuse ownership has a negative impact on the returns. We find strong statistical significance for our control variables22: high risk and strong growth opportunities are reflected in positive returns in the next period. Large firms, measured by numbers of employees generated higher returns, which is in line with the reverse size effect of the early 1990s.. The beta-regressions of table 5 report that high shareholder voting power (measured by the Z-indices of the largest and second largest shareholder) are positively correlated to systematic risk. This finding suggests that the presence of large dominant shareholders – both directors and outsiders, like corporations and institutions – chose to take on higher levels of risk than widely-held firms. Both directors and other classes or large shareholders may opt to undertake additional risk because for these shareholders not only the financial return on their investment is important but also other benefits of control which may come at the detriment of (small) shareholders. Let us consider two examples of expropriation of shareholder rights. La Porta et al. (2000) give some examples of ‘tunnelling’; they show that large corporate shareholders can influence sales or investments such that e.g. setting low transfer pricing or spinning off of assets below market value siphons off corporate value to companies of which the large shareholders own 100% of the voting rights. Directors may also tempted to investment in high-risk investment projects which aim at corporate growth rather than corporate value. The reason is that remuneration schemes in the UK have been shown to be more size-sensitive than performance-sensitive (see e.g. Murphy, 1999).. 6. CONCLUSION. This paper has described two broad systems of corporate governance existing in Continental Europe (the insider system) and in the UK (and the US, the outsider system). We have emphasised a number of striking differences in concentration and nature of ownership between both systems. For example, in a typical Continental European country, (majority) control is held by one shareholder or a small group of interlocked (corporate) shareholders, whereas Anglo-American companies are predominantly widely held. These discrepancies.
(18) Corporate control measurement and firm performance. 16. have important consequences in terms of agency costs and therefore, mechanisms have been developed in most countries to separate ownership (cash flow rights) and control (voting rights) both at the level of the firm and through corporate law. The complexity of apprehending the numerous and intricate issues related to corporate governance has led us to focus on the need to adequately measure the extent to which a company is controlled by its shareholders. We have shown that traditional indices belonging to the Herfindahl family do not provide theoretically sound measures and have proposed to use another index (the Zindex) based on the idea that shareholders are players in a voting game.. In order to illustrate the importance of ownership dynamics on the economy, we analysed empirically the impact of the Z-index and Herfindahl indices on the financial performance of a stock and its risk. Given the widely held nature of companies listed on the London Stock Exchange, the importance of the role played by potential shareholder coalitions, and the availability of data, the equations have been estimated for the UK. Our results point to the fact that voting power, as measured by Z-indices, is tightly correlated to both share price performance and risk. The negative relation between the largest Z-index and corporate share price performance is explained by the fact that the voting power held by executive directors measures the degree of insider entrenchment which has a negative impact on performance. This negative relation is compensated when outside shareholders (e.g. industrial companies, individuals or families) own substantial voting power and may actively monitor the firm. This is because with a counterbalancing pole of control, the largest shareholder is forced to compromise and maximize firm’s profits rather than his or her own utility function. The risk regressions show that entrenched insider as well as large shareholders my seek higher levels of systematic risk. It may be that these shareholders prefer risky high growth strategies which are providing higher levels of private benefits for these types of shareholders at the expense of small shareholders. We also conclude that the classic Herfindahl indices inaccurately measure control, which is reflected in the weaker relationship with performance..
(19) Corporate control measurement and firm performance. 17. REFERENCES Alchian, A. & Demsetz, H. (1972). Production, information costs and economic organization. American Economic Review, 62, 777-795. Agnblad, J., Berglof, E., Hogfeldt, P. & Svancar, H. (2001). The Swedish model at a crossroads – Family and bank control through dual class shares meets international capital. In F. Barca and M. Becht (Eds), The control of corporate Europe. Oxford: Oxford University Press, 228-258. Banerjee, S., Leleux, B. & Vermaelen, T. (1997). Large shareholdings and corporate control: an analysis of stake purchases by French holding companies. European Financial Management, 3, 23-43. Banzhaf, J. F., III, (1965). Weighted voting doesn’t work: a mathematical analysis. Rutgers Law Review, 19, 317-343. Banzhaf, J. F., III, (1966). Multi-member electoral districts – Do they violate the “One man – One vote’s” principle?. Yale Law Journal, 75, 1309-1338. Banzhaf, J. F., III, (1968). One man – 3,312 votes: a mathematical analysis of the electoral college. Villanova Law Review, 13, 304-332. Barclay, M. & Holderness, C. (1989). Private benefits from control of public corporations. Journal of Financial Economics, 25, 371-395. Bebchuk, L. & Roe, M. (1999). A Theory of Path Dependence in Corporate Governance and Ownership. Stanford Law Review, 52, 127-170. Becht, M., (1999). European Corporate Governance: trading off liquidity against control. European Economic Review, 43, 1071-83. Becht, M., Chapelle, A. & Renneboog, L. (2001). Shareholding cascades: the separation of ownership and control in Belgium. In F. Barca and M. Becht (Eds), The control of corporate Europe. Oxford: Oxford University Press, 71-105. Becht, M. & Boehmer, E. (2001). Ownership and control in Germany. In F. Barca and M. Becht (Eds), The control of corporate Europe. Oxford: Oxford University Press, 128153. Bianchi, M., Bianco, M. & Enriques, L. (2001). Ownership, pyramidal groups and separation between ownership and control in Italy. In F. Barca and M. Becht (Eds), The control of corporate Europe. Oxford: Oxford University Press, 154-187. Bloch, L. & Kremp, E. (2001). Ownership and voting power. In F. Barca and M. Becht (Eds), The control of corporate Europe. Oxford: Oxford University Press, 106-127. Brennan, M. & Franks, J. (1997). Underpricing, ownership and control in initial public offerings of equity securities in the UK. Journal of Financial Economics, 45, 391-413. Carlin, W. & Mayer, C. (2001). Finance, Investment and Growth. Working paper, University of Oxford. Chen, N., Roll, R. & Ross, S. (1986). Economic forces and the stock market. Journal of Business, 59, 386-403. Chirinko, R. S. & Elston, J. (1996). Banking Relationships In Germany: Empirical Results and Policy Implications. In Federal Reserve Bank of Chicago, Rethinking Bank Regulation: What Should Regulators Do? Chicago: Federal Reserve Bank of Chicago, 239-255. Crespi, R. & Garcia, M. (2001). Ownership and control: A Spanish survey. In F. Barca and M. Becht (Eds), The control of corporate Europe. Oxford: Oxford University Press, 207-227. Crespi, R. & Renneboog, L. (2001). United we stand: Coalition formation and shareholder monitoring in the UK. Discussion paper CentER, Tilburg University..
(20) Corporate control measurement and firm performance. 18. Cubbin, J. & Leech, D. (1983). The effect of shareholding dispersion on the degree of control in British companies: Theory and measurement. The Economic Journal, 93, 351-369. De Jong, A., Kabir, R., Mara, T. and Roell, A. (2001). Ownership and control in the Netherlands. In F. Barca and M. Becht (Eds), The control of corporate Europe. Oxford: Oxford University Press, 188-206. Demsetz, H. & Lehn, K. (1985). The structure of corporate ownership: Causes and consequences. Journal of Political Economy, 93, 1155-1177. Dubey, P., & Shapley, L. S. (1979). Mathematical properties of the Banzhaf power index. Mathematics of Operations Research, 4, 2-28. Dyck, A. & Zingales, L. (2001). Private benefits of control, and international comparison. Working paper University of Chicago. Edwards, J. & Fisher, K. (1994). Banks, finance and investment in Germany. Cambridge: Cambridge University Press. Edwards, J. & Ogilvie, S. (1996). Universal banks and German industrialization: a reappraisal. Economic History Review, 49, 427-464. Edwards, J. & Nibler, M. (2000). Corporate governance in Germany: the role of banks and ownership concentration. Economic Policy, 31, 237-60. Fama, E. & French, K. (1992). The cross-section of expected stock returns. Journal of Finance, 47 (2), 427-466. Felsenthal, D. & Machover, M. (1998). The measurement of voting power. London: Edward Elgar publishing Inc. Franks, J. & Mayer, C. (1996). Hostile takeover and the correction of managerial failure. Journal of Financial Economics, 40, 163-181. Franks, J. & Mayer, C. (2001). Ownership and control of German corporations. Review of Financial Studies, 14, 943-977. Franks, J., Mayer C. & Renneboog, L. (2001). Who disciplines management in poorly performing companies? Journal of Financial Intermediation, 10, 209-248. Gambarelli, G., (1991). Political and Financial Applications of the Power Indices. In G. Ricci (Ed), Decision Processes in Economics. Berlin and Heidelberg: Springer-Verlag, 84-106. Goergen, M. & Renneboog, L. (2001). Strong managers and passive institutional investors in the UK. In F. Barca and M. Becht (Eds), The control of corporate Europe. Oxford: Oxford University Press, 259-284. Goergen, M. & Renneboog, L. (2002). Why are the levels of control (so) different in German and UK firms? Evidence from initial public offerings, forthcoming Journal of Law, Economics and Organization. Grossman, S. & Hart, O. (1982). Corporate financial structure and managerial incentives. In J.McCall (Ed), The Economics of Information and Uncertainty. Chicago: University of Chicago Press. Grossman, S. J. & Hart, O. (1986). The cost and benefits of ownership: a theory of vertical and lateral integration. Journal of Political Economy, 94, 691-719. Gugler, K., Kalss, S., Stomper, A. & Zechner, J. (2001). The separation of ownership and control: an Austrian perspective. In F. Barca & M. Becht (Eds), The control of corporate Europe. Oxford: Oxford University Press. Hart, O., (1995a). Corporate Governance: some theory and implications. Economic Journal, 105, 678-689. Hart, O., (1995b). Firms, contracts, and financial structure. Clarendon Lectures in Economics. Oxford and New York: Clarendon Press..
(21) Corporate control measurement and firm performance. 19. Hart, O. & Moore, J., (1990). Property rights and the nature of the firm. Journal of Political Economy, 98, 1119-1158. Hart, O. & Holmstrom, B. (1987). The theory of contracts. In T. Bewley (Ed), Advances in economic theory. New York and Melbourne: Cambridge University Press, 71-155. Johnson, S., La Porta, R., Lopez-de-Silanes, F. & Shleifer, A. (2000). Tunnelling, NBER Working paper 7523. Kan, R., & Zhang, C. (1999). Two-Pass tests of Asset Pricing Models with Useless Factors. Journal of Finance, 54, 203-236. Kim, D., (1995). The Errors in Variables Problem in the Cross-Section of Expected Stock Returns. Journal of Finance, 50, 1605-1634. La Porta, R., Lopez-de-Silanes, F., Shleifer, A. & Vishny, R. (1997). Legal Determinants of External Finance. Journal of Finance, 52, 1131-1150. La Porta, R., Lopez-de-Silanes, F., Shleifer, A. & Vishny, R. (1998). Law and Finance. Journal of Political Economy. 106, 1113-1155. La Porta, R., Lopez-de-Silanes, F., Shleifer, A. & Vishny, R. (1999). Ownership Around the World. Journal of Finance, 54, 471-517. La Porta, R., Lopez-de-Silanes, F., Shleifer, A. & Vishny, R. (2000). Investor protection and corporate governance. Journal of Financial Economics, 58, 3-27. Martin, J. & McConnell, J. (1991). Corporate Performance, Corporate Takeovers and Management Turnover. Journal of Finance, 46, 671-687. Milgrom, P. & Roberts, J. (1992). Economics, organization and management. Journal of Finance, 47 (3), 1121-1140. Muphy, K., (1999). Executive compensation. In O. Ashenfelter and D. Card (Eds), Handbook of Labor Economic. Amsterdam: North-Holland. Owen, G., (1982), Game Theory. New York: Academic Press. Renneboog, L., (2000). Ownership, Managerial Control and the disciplining of poorly performing companies listed on the Brussels Stock Exchange. Journal of Banking and Finance, 24, 1959-95. Roe, M., (1994). Strong managers, weak owners. The political roots of American corporate finance. New York: Princeton University Press. Shleifer, A. & Vishny, R. (1986). Large shareholders and corporate control. Journal of Political Economy, 94, 461-88. Stapledon, G. (1996). Institutional Shareholders and Corporate Governance. Oxford: Clarendon Press. Wenger, E. & Kaserer, C. (1997). The German system of corporate governance – a model which should not be imitated. American Institute for Contemporary German Studies, The Johns Hopkins University, WP 14, Washington DC. Williamson, O. E., (1983). Organizational form, residual claimants, and corporate control. Journal of Law and Economics, 26, 351-380. Wymeersch, E., (1994). Elements of comparative corporate governance in Western Europe. In M. Isaksson and R. Skog (Eds), Aspects of Corporate Governance. Stockholm: Juristforlaget. Zwiebel, J., (1995). Block Investment and partial benefits of corporate control. Review of Economic Studies, 62, 161-185..
(22) 20. Corporate control measurement and firm performance. Table 1 : Concentration of voting rights by country. Austria Belgium France Germany Italy Netherlands Spain UK US. Studies (2001) Eur.Corp.Governance Network. Sample co's All quoted. Gugler, Kalss, Stomper, Zechner Becht, Chapelle and Renneboog Bloch and Kemp Becht and Boehmer Bianchi, Bianco and Enriques De Jong, Kabir, Mara and Roell Crespi and Garcia-Cestona Goergen and Renneboog Becht. 50 listed (all) 150 listed (all) 40 listed (CAC) (1) 374 listed (all) (3) 216 listed (all) 137 listed (all) 193 listed (all) 250 listed (2) 1309 (NYSE). Disclosure Threshold 5% 5% 5% 5% 2% 5% 5% 3% 5%. Total ownership concentr. Mean Median 65.5 63.4 52.0 <65% 68.4 62.5 65.1 40.8 ca 30%. 60.0 66.5 30.0 <65% 62.3 69.8 63.2 39.0 n.a.. Largest shareholding Mean Median 54.1 55.8 29.4 n.a. 51.9 42.8 40.1 15.2 <5%. 52.0 55.5 20.0 52.1 54.5 43.5 34.2 10.9 <5%. Shareholder classes with largest % of voting rights Most 2nd most Domestic co's Fx co's/bks (Fin)Holding co's Ind&com Co's Fin. holding co's Ind&com Co's Companies Fin. Inst. Companies Individuals Administr. office Fin. Inst. Domestic co's Fx co's Institutions Directors Institutions Individuals. This table presents total ownership concentration of all large shareholders and of the largest shareholder. The ownership classes which hold (cumulatively) the largest percentage of equity in the average listed company are also exhibited. Ownership data capture both direct and indirect (ultimate) shareholdings: all voting rights controlled directly and indirectly possibly via a cascade of intermediate holdings are added. In other words, alliances based on share stakes are taken into account. The companies in these studies are listed and exclude financial institutions. All studies (a.o.) forthcoming in Barca, F. and M. Becht (2001) : Ownership and Control: A European perspective, Oxford Univ. Press. Note : (1) for all 680 French listed firms, the largest owner controls an average of 56% of voting rights. Companies which are part of an index have to assure sufficient Liquidity; hence, the high free float and smaller blockholdings. For comparison; the median largest voting block of a DAX30 company amounts to 11.0%. (2) random sample of all non-financial firms listed on the LSE. (3) all listed from the official market...
(23) Corporate control measurement and firm performance. 21. Table 2: Ownership and Voting Power: Structure and Consequences Panel A : Dispersed Ownership and Dispersed Voting Power - where : US, UK. - advantages : a. portfolio diversification and liquidity; b. take over possibility - disadvantages : insufficient monitoring : free riding problem - agency conflicts : management vs shareholders Panel B : Dispersed Ownership and Concentrated Voting Power - where : countries where a stake holder can collect proxy votes and shareholder coalitions are allowed. - advantages : a. monitoring of management, b. portfolio diversification and liquidity; - disadvantages : a. violation of one-share-one-vote b. reduced take over possibility - agency conflicts : controlling block holders vs small shareholders Panel C : Concentrated Ownership and Dispersed Voting Power - where : any company with voting right restrictions - advantages : protection of minority rights - disadvantages : a. violation of one-share-one-vote b. low monitoring incentives, c. low portfolio diversification possibilities and low liquidity d. higher cost of capital e. reduced take over possibilities - agency conflicts : management vs shareholders Panel D : Concentrated Ownership and Concentrated Voting Power - where : Continental Europe, Japan, in any company after take over. - advantages : high monitoring incentives - disadvantages : a. low portfolio diversification possibilities and low liquidity b. reduced take over possibilities - agency conflicts : controlling block holders vs small shareholders..
(24) 22. Corporate control measurement and firm performance. Table 3: Computation of Z Indices - An illustration Panel A String #. Possible voting choices (A1) (A2) Y Y Y N N Y N N. 1 2 3 4 Results. Number of possible strings = Number of swings for (A1) = Number of swings for (A2) = Total number of swings = Z Index (A1) = Z Index (A2) =. Outcome (T) Y Y N N. (= 2/2) (=0/2). 4 2 0 2 1 0. Panel B String # 1 2 3 4 5 6 7 8. Possible voting choices (A1) (A2) Y Y Y Y Y N Y N N Y N Y N N N N. (A3) Y N Y N Y N Y N. Outcome (T) Y Y Y N Y N N N. Results Number of possible strings = Number of swings for (A1) = Number of swings for (A2) = Number of swings for (A3) = Total number of swings = Z Index (A1) = Z Index (A2) = Z Index (A2) =. (= 2/6) (= 2/6) (= 2/6). 8 2 2 2 6 0.333 0.333 0.333.
(25) 23. Corporate control measurement and firm performance. Panel C String # 1 2 3 4 5 6 7 8 9 10 11 12 13 14 15 16. Possible voting choices (A1) (A2) Y Y Y Y Y Y Y Y Y N Y N Y N Y N N Y N Y N Y N Y N N N N N N N N. (A3) Y Y N N Y Y N N Y Y N N Y Y N N. (A4) Y N Y N Y N Y N Y N Y N Y N Y N. Outcome (T) Y Y Y Y Y Y Y N Y N N N N N N N. Results Number of possible strings = Number of swings for (A1) = Number of swings for (A2), (A3), (A4) = Total number of swings = Z Index (A1) = Z Index (A2), (A3), (A4) =. 16 6 2. (= 6/12) (= 2/12). 12 0.5 0.166.
(26) 24. Corporate control measurement and firm performance. Table 4: Ownership distribution by category of owner Panel A : Ownership concentration and voting power of large shareholders by shareholder category. Average based on total number of co’s with a Average based on total number of sample shareholding for this category of owner companies 1992 1 Banks 2 Investment and Pension funds 3 Insurance co’s Total Institutions 4 Industrial cos 5 Families and individuals 6 Government 7 Executive directors 8 Non-executive directors Total directors. Numb. of co's with large owners % equity Shapley Herfindahl Largest 62 5.7% 0.16 Sum 6.2% 0.18 0.04 Largest 139 6.0% 0.20 Sum 8.9% 0.27 0.08 Largest 173 8.4% 0.26 Sum 17.1% 0.46 0.11 Largest 187 8.4% 0.32 Sum 24.4% 0.68 0.18 Largest 86 12.8% 0.34 Sum 14.3% 0.36 0.13 Largest 31 10.7% 0.19 Sum 16.4% 0.27 0.07 Largest 6 5.7% 0.03 Sum 5.7% 0.03 0.04 Largest 103 8.1% 0.16 Sum 11.6% 0.21 0.07 Largest 58 10.3% 0.21 Sum 14.5% 0.26 0.08 Largest 118 10.3% 0.21 Sum 17.3% 0.31 0.10. All sample companies 204 204 204 204 204 204 204 204 204 204. % equity 1.7% 1.9% 4.1% 6.1% 7.2% 14.5% 7.2% 22.4% 5.4% 6.0% 1.6% 2.5% 0.2% 0.2% 4.1% 5.9% 2.9% 4.1% 4.1% 10.0%. Shapley 0.05 0.05 0.14 0.18 0.22 0.39 0.29 0.62 0.14 0.15 0.03 0.04 0.00 0.00 0.08 0.11 0.06 0.07 0.12 0.18. Herfindahl 0.01 0.06 0.09 0.16 0.06 0.01 0.00 0.04 0.02 0.06. Panel B : Ownership distribution by category of owner. 250 firms. [3%,10%] [10%,25%] [25%,50%] [50%,75%] [75%,100%] Mean Mean #. of Mean Mean #. of Mean Mean #. of Mean Mean #. of Mean Mean #. of (Tot.) (Cat.) Invest. (Tot.) (Cat.) Invest (Tot.) (Cat.) Invest (Tot.) (Cat.) Invest (Tot.) (Cat.) Inve st Banks 0.29 1.11 60 0.02 1.00 4 0.00 1.00 1 0.00 0.00 0 0.00 0.00 0 Investment funds 1.06 1.63 219 0.04 1.00 9 0.00 0.00 0 0.00 0.00 0 0.00 0.00 0 Insurance co’s 2.01 2.57 414 0.22 1.21 46 0.02 1.00 4 0.00 0.00 0 0.00 0.00 0 Total Institutions 3.35 3.76 691 0.29 1.26 59 0.02 1.00 5 0.00 0.00 0 0.00 0.00 0 Industrial co’s Families/indiv.. 0.31 0.22. 1.14 1.84. 64 46. 0.11 0.03. 1.05 1.40. 22 7. 0.04 0.02. 1.00 1.00. 9 4. 0.01 0.00. 1.00 0.00. 2 0. 0.00 0.00. 1.00 0.00. 1 0. Executive dir. Non-exec. dir. Total directors. 0.24 0.26 0.50. 1.40 1.71 1.85. 49 53 102. 0.14 0.08 0.22. 1.38 1.23 1.55. 29 16 45. 0.04 0.02 0.06. 1.14 1.00 1.30. 8 5 13. 0.00 0.00 0.01. 1.00 1.00 1.00. 1 1 2. 0.00 0.00 0.00. 0.00 0.00 0.00. 0 0 0. All shareholders. 4.42. 4.69. 910. 0.65. 1.51. 133. 0.15. 1.11. 31. 0.02. 1.00. 4. 0.00. 1.00. 1. Note: Panel A shows the sum of the large ownership stakes by category of owner and the largest shareholding. Panel B shows the average number of large shareholders by shareholder category and by size of equity stake. Mean (tot.) and Mean (cat.) stand for the average stake by class of shareholder whereby the denominator is, respectively, the total number of companies and the total number of companies with a shareholder of this category. # of invest. stands for the number of investors in this category. Source: Annual reports..
(27) Corporate control measurement and firm performance. 25. Table 5: Impact of ownership dynamics on the risk and financial performance of a stock Dependent variable :. Returnt. Returnt. Returnt. Betat. Betat. Betat. -. -7.0417*** (4.55) -. -. 0.1184*** (19.341) -. Herf1t-1. -3.3510*** (2.51) 24.3068*** (11.31) -. Herf5t-1. -. Explanatory Variables Z1t-1 Z2t-1. Control variables Emplt-1 Mcapt-1 PE ratiot-1 Betat-1 Sectort # of observations Adjusted R2. 0.0088 (1.688) -0.1131** (2.299). -. 0.1222*** (22.414) 0.1019*** (18.783) -. -. -. 0.0007*** (24.010) -0.0226*** (46.392) 0.3415*** (15.081) 39.0118*** (17.096) 0.8963*** (4.9894). 0.0006*** (21.378) -0.0214*** (45.108) 0.1806*** (7.550) 34.388*** (8.803) 0.9661*** (2.258). 0.0007*** (34.77) -0.0218*** (12.71) 0.2813*** (12.71) 37.8001*** (15.96) 0.8734*** (4.890). 767 0.16. 767 0.16. 767 0.16. -. -0.00003 (1.509) 0.00005*** (3.215). -. 0.000004*** (13.108) -0.00005*** (65.050) -0.0010*** (21.215) -. 0.000004*** (15.281) -0.00005*** (32.671) -0.0009*** (12.458) -. 0.000004*** (17.3118) -0.00005*** (60.459) -0.0008*** (18.074) -. -0.0003 (0.456). -0.0009 (1.144). 0.0002 (0.236). 782 0.78. 782 0.76. 782 0.78. -. Notes: Z1 denotes the Z index of the largest shareholder; Z2 denotes the Z index of the second largest shareholder; Herf1 denotes the square of the percentage of shares detained by the largest shareholder; Herf5 denotes the sum of squared percentages of shares detained by the five largest shareholders. Given the presence of missing observations for some years and/or firms in the sample, the models (fixed effects models with time/year specific dummies, not reported in this Table) were estimated from an unbalanced panel by feasible GLS using estimated cross-section residual variances. Heteroskedasticity robust t-test statistics (in absolute value) are reported in parentheses. The higher the t-test statistics, the more significant the variable is..
(28) Corporate control measurement and firm performance. Figure 1: Ownership concentration indices in insider and outsider systems.. Exhibit 1a. Exhibit 1b. Exhibit 2. Exhibit 1c. 26.
(29) Corporate control measurement and firm performance. 27. Figure 2 : Control vs ownership for a sample of French companies. Shares. Shareholder < 50%: control (Z index) by ultimate main sharehodler vs shares held by largest direct shareholder 60 50 40 30 20 10 0 0. 0.2. 0.4. 0.6. 0.8. 1. Control. Note. In the graph below, firms are ranked according to the amount of control held by their largest ultimate shareholder (control is on the vertical axis while firms are numbered on the horizontal axis.. Shareholder > 50%: control (Z index) detained by ultimate main shareholder 1.2 1 0.8 0.6 0.4 0.2 67. 61. 55. 49. 43. 37. 31. 25. 19. 13. 7. 1. 0.
(30) Corporate control measurement and firm performance. 28. Endnotes 1. The following countries adopted the disclosure regulations: Belgium in 1989; Spain in 1989, France in 1989, Italy in 1974 with adaptation in 1992, Netherlands in 1992, Germany in 1995. 2 For instance, shareholdings exceeding 2% of the equity capital (voting rights) are to be disclosed in Italy whereas, in most other European countries the notification threshold is at 5%. Furthermore, disclosure frequency in e.g. Belgium and the UK differs: in the former changes in ownership need to be reported as soon as the new threshold transgresses any subsequent threshold of 5% (5%, 10%, 15% etc) of equity whereas in the UK, a change of 1% in a large shareholding (of more than 3%) triggers disclosure. 3 The European Corporate Governance Network consists of researchers from, among others: Banque Nationale de Paris, Banca d’Italia, University of Oxford, Princeton University, Tilburg University, Free University of Brussels (ECARE), Catholic University of Leuven, University of Vienna, Autonomous University of Barcelona, University of Groningen, Humboldt University Berlin, University of Manchester, Stockholm School of Economics, University of Milan. The ECGN is financed by the European Union and Fondazione E. Mattei (Milan). The Network consists of about 25 researchers at 18 universities and National Banks in 9 European countries. 4 In France, total ownership concentration in CAC40 or DAX30 companies is lower because relatively high free float is required. 5 This example illustrates the major difference between voting rights and cash flow rights. Through control leverage, it is possible to detain control over a large number of entities while only investing little money (and being entitled to a small portion of the cash flows). 6 Wenger and Kaserer (1997) mention that in a 1992 survey of the 24 largest German companies, banks controlled over 80 percent of the votes. 7 Usually, the board of directors can only install voting caps after prior consent of the annual general meeting. This authority can be delegated for a limited amount of time. In addition, the installation of voting caps can only happen under specific conditions e.g. when the company is threatened by a hostile take over. In the only 3 hostile take over attempts since WWII, voting caps were used in each case (Franks and Mayer, 2001). 8 With prior consent of the shareholders at an annual meeting, the board of directors can issue new equity, place it with ‘friendly’ shareholders and thus dilute the share stakes of other shareholders. 9 For a theoretical discussion of the free riding problem of dispersed shareholdings. See for example, Shleifer and Vishny (1986), Hart (1995b). 10 Low monitoring resulting from voting rights dispersion might be compensated by increased bank monitoring. In spite of the close connections between banks and industry in Germany, which include ownership states, positions on the supervisory board and proxy votes, several studies show that German banks have provided less finance to industry than in UK banks (Edwards and Fisher, 1994 and Edwards and Ogilvie, 1996). Furthermore, Edwards and Nibler (2000) do not find a positive effect of bank ownership of equity on the profitability of German firms. 11 The hostile take over market in the US has been considered as a disciplinary device to correct managerial failure. Empirical research supports this view for the US (Martin and McConnel, 1991). In contrast, the targets of hostile take-overs in the 1980s were not poorly performing, but mostly average or good performers (e.g. Franks and Mayer, 1996). 12 Pioneered by Coase in the 30s and further developed by e.g. Williamson (1983). 13 See for example: Jensen and Meckling (1976), Milgrom and Roberts (1992). 14 The theory of implicit contracting is well described in by Grossman and Hart (1982, 1986) Hart and Holmstrom (1987), Hart and Moore (1988), Hart (1995a). 15 See e.g. Alchian and Demsetz (1972). 16 In countries with the common law system, La Porta et al (1997,1998) build an index which captures shareholder protection and increases when: shareholders are not required to deposit their shares prior to annual meetings; shareholders can mail proxy votes; cumulative voting is allowed; minority protection legislation is strong; and small shareholders can call extra-ordinary meetings. Regarding creditor protection, this index increases when the rule of absolute priority is followed in case of financial distress. However, Franks et al. (2001) conjecture that even within the Anglo-American countries there are substantial differences in corporate control regulation. Essentially, this would be because the relative cost of control is higher in the UK than in the US because of stronger minority protection legislation than in the US, where the reliance on courts is higher. 17 Because any two shareholders jointly detain a majority of shares..
(31) Corporate control measurement and firm performance. 18. 29. Because when the main shareholder colludes with any other shareholder, they jointly detain a majority, whereas all three small shareholders should collude in order to counter A1, a clearly more difficult task. 19 Although this example may appear overly simplified, we have been able to identify a number of realworld cases where control over companies behaves as described here. 20 Leaving aside the issue of the possible existence of a blocking minority. 21 Note that one should be careful before drawing definitive conclusions given the potential pitfalls that apply to this type of standard cross-sectional studies of stock returns (see inter alia, Kan and Zhang, 1999; Kim, 1995). 22 Note that the regressions are not suffering from multicollinearity as the correlations between Zindices and Herfindahl indices, as well as among the control variables is low and not statistically significant..
(32)
Figure

+3


Documents relatifs
This study examines the causal relationships between the various dimensions of corporate social responsibility (human resources, human rights in the workplace, societal
Abstract: The aim of this paper is to carry out a study on the limits of the concept of Corporate Social Performance (CSP) and its instrumentation in the
Table 5. reports the Pearson correlations between the model variables. Pearson correlations vary between 1 and -1 and measure the linear relationship between two
Although both young and elderly humans show an increase in some muscle factors associated with proliferation and differentiation, and a reduction in myostatin gene expression
In particular, the fully dimpled surface of the spec- imen tested at 330°C – without any occurrence of channel fracture - indicate that, for 304(L) materials irradiated in
We can prove that the equilibrium existence may fail even when (1) the utility function of the remaining agent is convex and (2) the good 2 endowment of the agent B is very high...
For this, we base the composition process on the selection, extraction and placement of the existing application's UI as elementary composition actions to
Les acteurs impliqués dans ces groupes se sont réunis de manière conjoncturelle autour de certains enjeux conflictuels, mais peu à peu leurs thématiques d’intérêt
