Concrete surface treatments quantification by
means of mechanical profilometry
Courard, L.
1; Garbacz, A.
2; Górka, M.
21
) University of Liege1, Belgium
2
) Warsaw University of Technology, Poland
Abstract:
Existing concrete surfaces need to be roughened to a profile necessary to achieve mechanical interlock with repair material. Surface mechanical morphometry is based on the measurement of surface profile - profilometry - which can be extended to 3D representation with surfometry by means of a stylus registering the profile.
Profilometry and surfometry analysis were realized on concrete after different surface treatments (grinding, sandblasting, shotblasting, hand- and mechanical milling). The profile has been quantified by means of statistical and amplitude parameters
calculated from the waviness (lower frequencies) and the roughness (higher frequencies) profiles of the surface. Bearing ratio and Abbott's curve observations are also very useful to characterise surface profiles.
Keywords: roughness, waviness, surface preparation, statistical and amplitude
parameters, Abbott’s curve
Introduction
Some doubts still exist on the real influence of the roughness on the adhesion of PC, PCC or CC repair mortars on concrete substrate [1,2]. The diversity of the
parameters influencing the creation and the stability of the interface [3] makes difficult to exactly point out which is the more predominant. Concrete profile is in relation with the technique used for the surface preparation. Some authors and guidelines [4,5] recommend techniques and procedures, but are not able to explain the gain or loss of adhesion in terms of roughness, exclusively; these can be indeed due too secondary effects of surface preparation, such as superficial cracking of the concrete substrate [6,7].
Results presented here are relative to the quantification of the concrete surface profiles obtained after different surface treatments. The technique used for the parametrization of the surface is the mechanical profilometry, previously developed by Courard [8,9]. This technique is accurate for investigations in laboratory; for investigations on site, other procedures should be followed [10], in order to analyse larger surfaces.
Depending on local conditions of the specific building, surface roughness is obtained after sandblasting, milling, grinding, hydro-jetting or shot blasting; the technique and
the energy chosen induce many different shapes and configurations that are quantified by means of amplitude and statistic parameters [9].
Evaluation of the profile roughness with profilometry
In the profilometry technique a stylus is walked along the surface to be analysed and the profile is continuously registered. The originality in the signal treatment is coming from the possibility of distinguishing the effect of high and low frequencies,
corresponding to the roughness and the waviness of the profile, respectively. Profile filters separate the roughness profile from the long wave profile components and the waviness profile from the roughness. Profile filters provide a mean line to the actual profile. They are the basis for calculation of parameters for roughness and waviness. The most commonly used for concrete surface [9] are given in table 1.
Table 1. Comonnly used profile parameters
Parameter Definition
amplitude profile parameters Xt total height of the profile
Xv maximum depth of the profile (holes)
Xp maximum height of the profile (peaks)
statistical profile parameters
Xa arithmetic mean of the deviation of the profile from the mean line
Xq quadratic mean of the deviation of the profile from the mean line
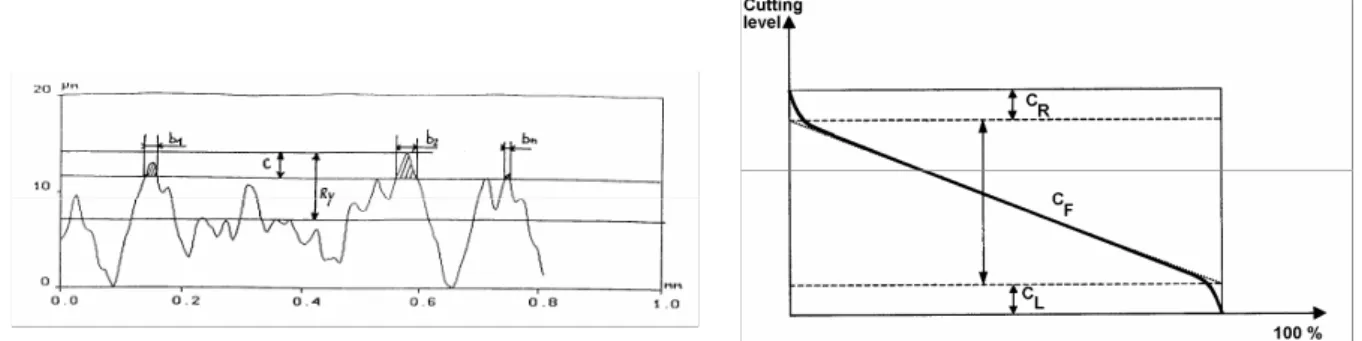
Another useful information from surface analysis gives the bearing ratio (Fig. 1a), defined as the percentage of profile intercepted by a reference line "c" of "l" length. If the bearing ratio is determined on the total height of the profile in a number of interception planes as large as possible, and represented on a graphic, Abbott's curve is obtained (Fig. 1b). The shape of Abbott’s curve is characterized by three parameters:
CR - relative height of the peaks;
CF - depth of the profile, excluding high peaks and holes;
CL - relative height of the holes.
(a) Bearing length of the profile - np (b) Abbott's curve (curve of bearing ratio)
Description of materials
The concrete substrates (30x30x5cm) of C20/25 class were made from the concrete mix: CEM I 32,5, 2/8 limestone, 0/2 quartz sand. The concrete substrates were prepared by the following types of the mechanical treatment:
- grinding,
- sandblasting,
- shotblasting (treatment time: 20, 35, 45 s),
- milling (hand and mechanical).
Additionally, the concrete samples without treatment were tested as the reference ones.
Results and discussions
The basic issue with implementation of profilometry to the concrete surfaces after various treatments was high difference in their roughness (Table 2).
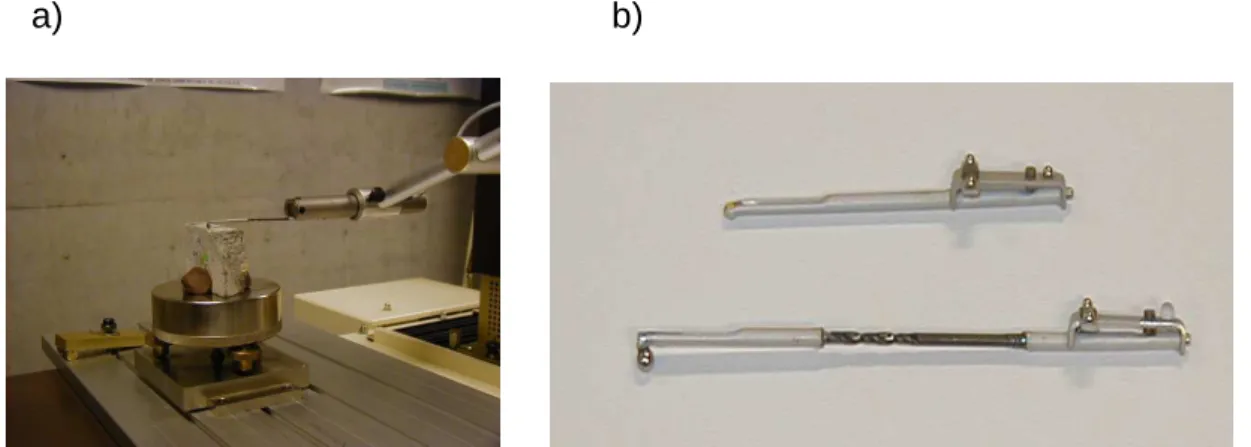
A evaluation of concrete surface roughness has been realized by means of commercial profilometer (Fig.2a). At the first step roughness of the profile was analyzed. In this case a stylus with diamond sphere radius of 6 µm (Fig.2b upper) was used. The length of measurement was 8 mm and the filter used to separate roughness from the profile was fixed to 0.8 mm. As the diamond diameter and measurement length was very little the total profile has been filtered in order to point out the parameters of roughness. The measurement of waviness was made with another stylus of 79 mm long and a diamond of 1.5 mm radius (Fig.2b bottom). The length of the measurement was enlarged to 30mm or more. The filter to separate roughness from the total profile was classically chosen at 0.8mm. The Abbott’s curve was deduced from total profile. In all cases three profiles were registered on one sample of each kind of preparation; each profile on the sample was made in different directions.
a) b)
Fig. 2. General view of the profilometry device used (a) and (b) types of stylus with diamond sphere radius of 6 µm (upper) and diamond of 1,5 mm radius
(at the bottom)
Surfometry analyses realized in the same conditions on a series of profiles measured each 300 µm gives a 3D representation of the surfaces (Table 2).
Table 2. Examples of the 3D visualization with surfometry and waviness and roughness profile after different surface treatments
3D visualization with surfometry
waviness profile *) roughness profile *) (a) without treatment (NT)
(b) grinding (GR) (c) sandblasting (SB) d) shot blasting 20s (SHB20) 35s (SHB35) 45s (SHB45) (e) milling “hand” (HM) mechanical (MM)
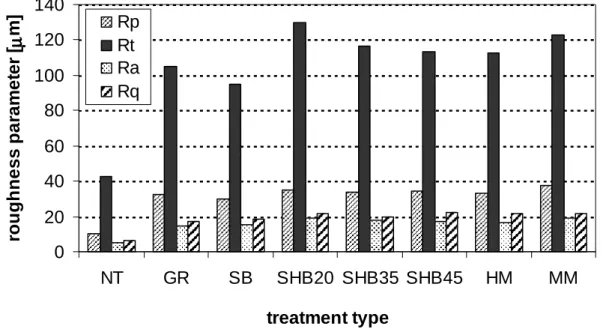
The values of the calculated roughness amplitude parameters (Fig.3) showed that parameters Ra and Rp were 3 to 4 times smaller for the formworked concrete profile
than for the other kinds of treatment and the parameters Rq and Rt were 2.5 to 3
times smaller. There was no significant difference for roughness parameters between grinding, sandblasting, milling and shot blasting . The results shows that the time of shot blasting or the use of hand or mechanical milling does not change the
parameters of roughness significantly. This behaviour was already observed for the comparison between sandblasted and polished concrete surfaces [8]. Moreover, roughness parameters for sanblasted surface obtained in this work were very closed to those determined by Courard [8] with the same stylus for quite different concrete, eg. Ra equals 15 and 16 µm respectively The results obtained confirmed that the
surface treatment technique has no major influence on the micro-roughness (“high frequencies waves”) of the profile.
0 20 40 60 80 100 120 140 NT GR SB SHB20 SHB35 SHB45 HM MM treatment type ro u g h n e s s p a ra m e te r [µµµµ m ] Rp Rt Ra Rq
Fig. 3 Roughness profile amplitude (Rp, Rt) and statistical (Ra, Rq) parameters
Observation of the values of the waviness amplitude and statistical parameters (Table 3) clearly shows that Wa parameter for shot blasting 45s is about 80 times
higher than for concrete without preparation, the values are about the same for sandblasting and grinding. The value is increasing with the time of shot blasting and when hand is replaced by mechanical milling.
All others parameters (Xp, Xq, Xv, Xt) are rising from the “soft” method of preparation
to the more “aggressive”, that means from “without treatment” to “shotblasting 45s”, by grinding, sandblasting, hand milling, mechanical milling, shot blasting 20s and shot blasting 35s, respectively. The waviness parameters are about 5% smaller than corresponding ones deduced from the total profile parameters for all types of
treatment. This confirmed that the heights and holes of the total profile have not been too much “cut” and the global shape of the profile has been preserved trough the waviness.
Table 3. Total (P) and waviness (W) profiles and Abbott’s curve parameters. Treatment type Parameter NT GR SB SHB20 SHB35 SHB45 HM MM Pa 6 36 53 186 220 432 72 183 Pp 16 122 133 516 586 1244 217 465 Pt 61 273 506 1204 1177 2417 523 967 Wp 13 111 117 500 570 1249 188 448 Wv 26 108 317 536 516 1112 269 419 Wt 39 219 434 1036 1086 2362 473 867 Wa 5 32 49 180 215 424 70 179 Wq 7 42 69 227 260 557 94 215 CR 6 57 50 291 289 743 116 188 CF 9 55 77 318 406 688 107 351 CL 19 69 144 316 291 776 196 248
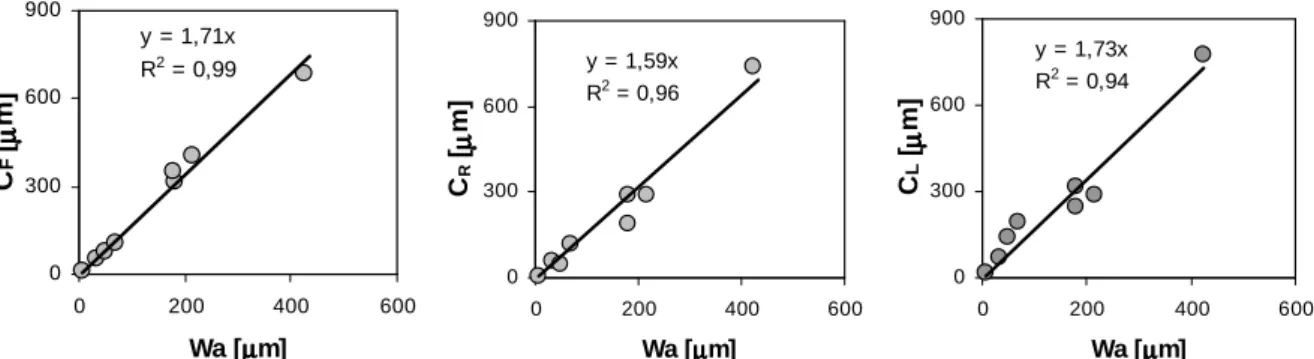
The parameters of Abbott’s curve are rising in the same order than the waviness parameters (Fig.4). It means that the more aggressive method of concrete treatment makes the profile more rough, the relative height of the peaks is larger (CR) as well
as the depth of the profile (CF), the same as the relative height of the holes (CL) (Fig.
5). Abbott’s curves shows that the surfaces after grinding, sanblasting as well as hand milling have similar geometry to the surface of the formworked concrete with relatively low roughness. The surfaces after shotblasting 20, 35s and after
mechanical milling belong to the second group of surface geometry with medium roughness. Significantly rougher surface with large peaks and holes was obtained after shotblasting 45s. y = 1,71x R2 = 0,99 0 300 600 900 0 200 400 600 Wa [µµµµm] CF [µµµµ m ] y = 1,59x R2 = 0,96 0 300 600 900 0 200 400 600 Wa [µµµµm] CR [µµµµ m ] y = 1,73x R2 = 0,94 0 300 600 900 0 200 400 600 Wa [µµµµm] CL [µµµµ m ]
Fig. 4. Relationship between arithmetic mean of the deviation of the profile Wa and
the parameters CF, CR, CL determined for the surfaces after different treatments
Analyzing all results obtained it seems that the most efficient parameters to characterize the surfaces are Pa, Wa and Cr; those parameters are very helpful to
classify the surfaces from the smoother to the rougher and to appreciate the efficiency of the surface treatment.
0 500 1000 1500 2000 2500 3000 0 20 40 60 80 100 bearing ratio [%] c u tt in g d e p th [µµµµ m ] NT GR SB SHB20 SHB35 SHB45 HM MM 3 1 2
Fig. 5 Abbott’s curve of the profiles after different surface treatments
Conclusions
The following conclusions may be reached from the present investigations concerning roughness evaluation of concrete surfaces:
• profilometry and surfometry parameters need to be adapted for the analysis of concrete surface, taking into account the scale of the profile amplitude;
• statistical and amplitude parameters are able to quantitatively characterise the profile by analysing holes, peaks, frequencies and amplitudes of the irregularities; the difference between the profiles is more effective at the level of waviness than roughness: on its own waviness profile, roughness amplitude is not statistically different for the different profiles;
• Xa parameter (arithmetic mean of the departure of the profile from the mean line)
is the more discriminating parameter for the comparison of surface preparation techniques;
• the classification of surface treatments from the point of view of the increasing of waviness is: “without treatment”, grinding, sandblasting, hand milling, mechanical milling, shot blasting 20s, shot blasting 35s and shotblasting 45s;
• the value of Xa is increasing with the time of shot blasting and when hand is
replaced by mechanical milling;
• surface parameters CR, CF and CL deduced from the Abbott's curve give
interesting information about the flatness of the profile (CF) and can also
discriminate the surface preparation of concrete;
The results of this work shows also needs for improvement of the profilometry device used to test rough concrete surface by developing new type of stylus or a use of non-contact indicator.
The real benefit of this technique lies in the potential correlation with results based on mechanical evaluation of surface (e.g., pull-off test). This is of course the “practical” interest of these investigations.
Acknowledgements
The authors express their sincere appreciation to Professor J. Bozet, Head of the Mechanical Engineering and Tribology Department and M. Nélis, Research
Engineer, for the opportunity to use the SURFASCAN test device. The authors are also thankful to Professor L.Czarnecki, Head of the Building Materials Engineering Division at the Technical University of Warsaw and Professor R. Degeimbre, Head of the Building Materials Laboratory at the University of Liege, for their assistance in preparing this paper. The research project was financially supported by the Government of Poland (KBN) and the Regional Government of Wallonia (DRI), Belgium.
References
1. Pretorius, J. and Kruger, D.: The influence of surface roughness on the bond strength of concrete repairs, Proc. of the Xth International Congress on
Polymers in Concrete - ICPIC 2001, USA, Honolulu, 2001, Ed. D.Fowler, pap. 13
2. Fukuzawa, K., Mitsui, M. and Numao, T.: Surface roughness indexes for evaluation of bond strengths between CRFP sheet and concrete, Proc. of the Xth International Congress on Polymers in Concrete - ICPIC 2001, USA, Honolulu, Ed. D.Fowler, pap. 12
3. Courard, L.: Parametric Study for the Creation of the Interface between Concrete and Repairs Products”, Mater. Struct., 33 (225), 2000, 65-72. 4. ACI Manual of Concrete Practice, Part 4 (1998) Concrete Repair Guide, ACI
Committee 546, 41p.
5. Slater, A.: (2001) Simple guidelines to better surface preparation, Concrete Repair Bulletin, Jan./Feb., pp. 4-5.
6. Courard, L. and Bissonnette, B.: (sent for publication) “Quantification of the influence of concrete removal techniques upon residual cracking”, Concrete International.
7. Garbacz, A. Gorka, M. and Courard, L. (sent for publication) “On the effect of concrete surface treatments on adhesion in repair systems”.
8. Courard, L. (1998). “Parametric Definition of sandblasted and polished Concrete Surfaces”, IXth International Congress on Polymers in Concrete, Bologna, Italy (ICPIC , Ed. P. Sandrolini,) 771-778.
9. Courard, L. et Nélis, M. (2003) “Surface analysis of mineral substrates for repair works: roughness evaluation by profilometry and surfometry analysis”, Magazine of Concrete Research, 55(4) 355-366.
10. Perez, F., Bissonnette, B. et Courard, L. (2003) « Outils de caractérisation paramétrique de la rugosité des surfaces en béton : nouveaux
développements », Journées scientifiques du RF²B, 25-26 août, Sherbrooke, Canada.
11. Sherrington, I. and Smith, E.H. (1988) “Modern measurement techniques in surface metrology - Part I: Stylus instruments, electron microscopy and non-optical comparators”, Wear, 125 pp. 271-288.