The concept of iso-inertial assessment: reproducibility analysis
and descriptive data
Jidovtseff B, Croisier JL, Lhermerout C, Serre L, Sac D, Crielaard JM*
* Department of physical medicine and rehabilitation, University of Liège, CHU, Belgium
Boris Jidovtseff
ISEPK - B21 Allée des Sports, 4, B-4000 Liège, Belgium
Tel : 0032 4 366 38 94 Fax : 0032 4 366 29 01 E-mail : [email protected]
Abstract
The purpose of this study was to investigate the reproducibility of a new iso-inertial dynamometer during bench press (BP) and squat (SQ) assessment and to provide descriptive data for recreational athletes. A position transducer and accelerometer were combined to assess velocity and power during free weight lifting exercises. Simulated movement with a pulley system revealed the excellent technological reproducibility of the dynamometer. Sixteen male subjects participated in the study in order to verify reproducibility in BP and SQ exercises. Iso-inertial tests consisted of lifting as fast as possible four different relative loads (35, 50, 70, 90% 1RM in BP and 45, 60, 75, 90% 1RM in SQ). The test was repeated one week later. Analysis of variance revealed no significant variation between sessions or trials. Reproducibility was better in velocity than in power, although it remained fairly good in both exercises (coefficients of variation [CV] never exceeding 10%), except on the time to peak power parameter. Descriptive data confirmed the classical force-velocity and force-power relationships for BP and SQ. In conclusion, this study demonstrated reliable measurements in BP and SQ iso-inertial exercises. Monitoring force-velocity and force-power relationships offers an original functional approach in strength training supervision.
Keywords: iso-inertial, dynamometer, reproducibility, muscle performance
Introduction
Muscular function significantly influences the level of performance in various high level sporting activities and therefore deserves relevant assessment. Various dynamometers are dedicated to muscular function testing. Analysis of exercise characteristics contributes to device classification: exercise modality (isometric, isokinetic or iso-inertial) and kinematic feature (close versus open kinetic chain). Current knowledge does not allow an unequivocal affirmation that one form of dynamometry is more suitable than another. Recent studies have discussed the applications of each type of dynamometry and have shown that, according to the context of muscular evaluation, the choice of dynamometer was decisive [2, 3, 5, 8]. Basically, each type of tool measurement presents specific advantages and disadvantages, referring either to the sport specificity or to the pathological context [2].
Isometric dynamometers assess strength in multi-joint static positions. They are often used in post traumatic rehabilitation when patients are limited in movement. Isometrics seems to be the favourite mode of contraction when physiological research includes intra-muscular EMG or NRM spectroscopy [20, 38]. Nevertheless, isometric conditions poorly relate to the specificity of most human movement and sporting actions that require dynamic contraction of the musculature throughout a range of movement [5, 18, 28, 32].
Isokinetics involves dynamic muscle actions for assessing torque and power through a range of motion in which the limb is moving at a constant angular velocity. This evaluation vindicates a growing interest in muscular function exploration. First of all, isokinetics allows a secured assessment of maximal muscle performance, so critical in most sporting tasks and in many
usual daily activities. Isokinetics also underlines a deficit in isolated muscle strength and allows detection of bilateral or reciprocal muscle group disorders [12, 13]. This information is useful for estimating muscle balance and for preventing the risk of injury [1, 12, 13]. However, in the context of healthy high level athletes, various authors have criticised isokinetic single-joint assessment because of a perceived lack of external validity [2, 39]. Indeed, open chain exercise and controlled velocity fail to simulate most patterns used in complex sporting tasks. This sort of evaluation may not show sufficient sensitivity for reflecting the slight changes in muscle performance induced by specific training [2].
According to current knowledge, multi-joint dynamometers (isokinetic or iso-inertial) appear more suitable to explore the force-velocity relationship in many athletic populations [4, 16, 33]. A study by Murphy et al. revealed that, when tests used similar movements, both iso-inertial and isokinetic multi-joint dynamometers were equally effective in discriminating between subjects of differing performance levels [33]. However, most movements in athletic settings involve the acceleration and deceleration of a constant mass about the associated joints or articulation. Consequently it would be more specific to measure either velocity or power performed with a constant mass, rather than measuring the torque produced at a constant velocity. Such a testing concept has been termed “iso-inertial” to reflect that the assessment involves a constant gravitational load. The conditioning tenet of specificity strongly suggests that the assessment of iso-inertial strength should be of interest in designing an appropriate strength training programme [2, 5, 30]. Usually, iso-inertial evaluation consists of one repetition maximum procedure (1RM), often used as a measure of strength for athletic profiling. This method, though representative of strength capability, gives no information about muscular velocity or the athlete’s explosivity. In order to alleviate this methodological limitation, scientists have attempted to develop instruments assessing velocity and power when
lifting a set of increasing loads in classical weightlifting exercises, such as bench press (BP) and squat (SQ). These instruments are called iso-inertial dynamometers. This concept of evaluation is of real interest in high level sports training and recent dynamometers have demonstrated encouraging results [7, 15, 32, 37]. Abernethy et al. reported its great ability to detect temporal changes in strength as a consequence of weight training [3]. Iso-inertial dynamometers are conceived to be used, in a complementary way, with any power training machine involving a vertical load displacement. Using a cable-extension transducer, accelerometer or optical devices, allows power and velocity assessment to be carried out at several growing loads [7, 14, 27, 32, 37].
However, the majority of dynamometers use only one device to appreciate all the measurements, and thus multiply the number of mathematical and smoothing operations. Accumulating these data operations can change the quality of results. In order to increase the validity of iso-inertial evaluation, we have developed an original dynamometer, which combines both accelerometer and cable–extension transducer for the assessment of power and velocity in classical strength training exercises.
The aims of our study are as follows:
1. to present the concept of iso-inertial assessment;
2. to appreciate dynamometer reproducibility when human source of error is excluded;
3. to explore the reproducibility of iso-inertial subject assessment through bench press (BP) and squat (SQ) exercises;
Material and methods
Subjects
A group of 16 male subjects, free from previous injuries, participated in this study. They all reported past experience of weight training gained through recreational sports activities. The mean age, body mass, height, and weekly sports practice were, respectively, those of 23.1 ± 2.5 years, 78.2 ± 8.6 kg, 179.5 ± 6 cm and 7.8 ± 3.6 hours. The subjects were instructed to refrain from strenuous physical activity for 48 h prior to each testing session. The whole population benefited from tests on BP and SQ exercises, as described below.
Iso-inertial dynamometer
The iso-inertial dynamometer combined an accelerometer and a cable-extension position transducer in order to assess weightlifting exercises performed on a Smith machine.
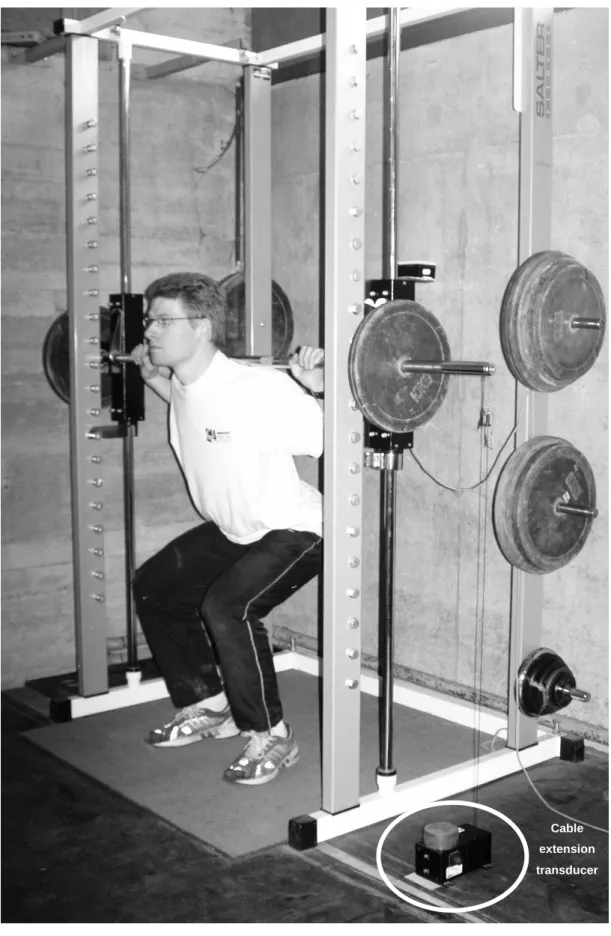
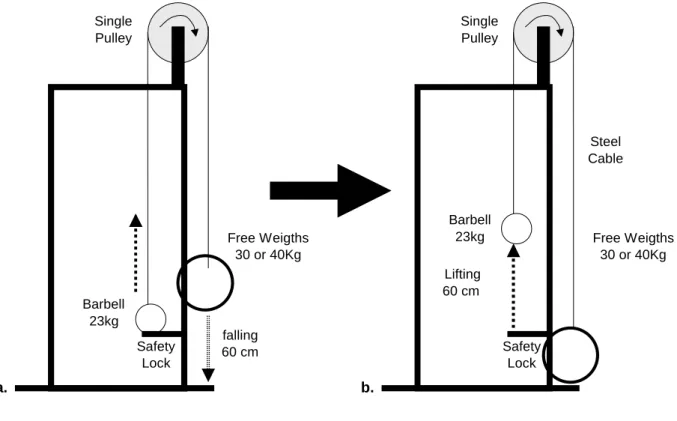
The Smith machine (Multipower M433, Salter S.A., Spain) allowed secured vertical displacement of the barbell during exercises, such as bench press and squat (Figure 1). The machine was used to ensure a vertical motion, since the assessment devices could only measure in one plane. Safety locking devices could be applied every seven centimetres and could determine, with the use of additional one centimetre pastilles, the minimal height of the bar.
Equipment used to yield measurements of iso-inertial parameters included an uniaxial piezoresistive accelerometer (model 3140, ICS Sensors, USA) and a cable-extension position transducer (model PT5DC, Celesco, USA), both positioned on the same extremity of the bar. The accelerometer consists of a semi-conductor strain gauge, bonded to a cantilever beam, which is end-loaded with a mass. When motion occurs, the beam bends, which creates a strain proportional to acceleration, and a corresponding change in voltage can then be measured. This device was horizontally fixed onto a metal block used to guide the bar (Figure 1a). A
cable-extension position transducer was held on the ground, under the bar in such a way that the cable could be attached at the extremity of the bar with a strict vertical moving (Figure 1b). The cable rolled and unrolled with the moving bar. Its constant resistance was added to the bar’s weight. A potentiometer output a voltage signal proportional to the distance at which the cable was pulled out. Fifteen minutes before testing, the cable-extension transducer and accelerometer were systematically calibrated.
An analogue-to-digital interface (Dakcard 6024E, National Instruments, USA) enabled data acquisition and transferred both accelerometer and position transducer signals to a notebook computer. Labview software (National Instruments, Texas, USA) coordinated measurements and allowed data analysis and storage. Distance and acceleration parameters were directly measured by the devices with a sampling rate of 1000Hz. Gravity was added to the acceleration measure in order to appreciate external force and power exercised against the barbell. Velocity was derived from displacement when power resulted from the product of mass, acceleration (measured acceleration + 9,81m.s-2) and velocity. A low-pass filter smoothed velocity and accelerometer data with a low cut-off frequency of 17Hz.
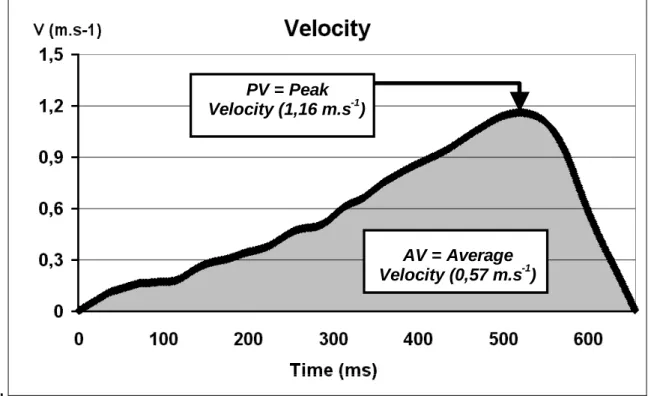
For each lift, average (AV) and peak (PV) velocity (Figure 2a), average (AP) and peak (PP) power and time to reach peak power (TPP) (Figure 2b), were collected by an iso-inertial dynamometer.
BP and SQ movements
Bench press and squat are the most popular weight training exercises used to develop upper body and lower limb strength respectively. In order to increase standardisation, BP and SQ were performed only in the concentric phase. The subject took his place under the bar, which rested on the safety blocks, and waited for the experimenter’s signal before lifting the charge.
For BP, the barbell laid three centimetres over the nipple line. Hand position on the bar corresponded to the distance measured when arm abduction and elbow flexion corresponded to 90°. During the whole movement, subjects had to keep their back on the bench and their hips flexed at 90° (Figure 1a). SQ movement was executed with the barbell resting on the shoulder. The starting position required feet to be placed under the bar, spaced in the same way as the shoulders, with knee and hip joints pre-set at 90° (Figure 1b). At the end of squatting, slight heel take-off due to movement intention was tolerated, but the subject was asked not to rise on tiptoe. The starting position was strictly reproduced during the three sessions of our study. The initial height of the barbell, distance between hands, chest (BP) and feet (SQ) positions were recorded and strictly reproduced for both exercises.
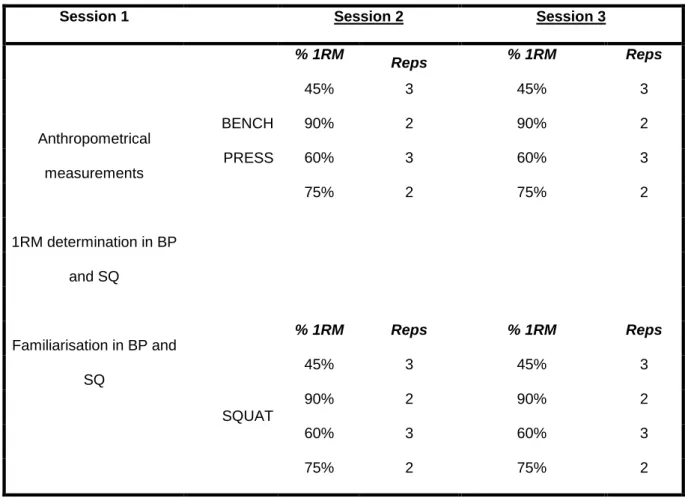
Testing procedure (Table 1)
Prior to the first iso-inertial test, subjects participated in a familiarisation session, which also included the one repetition maximum testing procedure (1-RM) and anthropometrical measurements. Familiarisation protocol was exactly the same for both exercises and consisted of BP and SQ movement practice and technical corrections. Two sets of 10 repetitions with unloaded barbells were carried out. Thereafter, subjects performed the 1-RM according to the standard methods recently outlined by Kraemer and Fry [29]. Then, two sets of 10 repetitions were performed. Standardised technical advice was given throughout each set. Exercise order was randomised. In the SQ exercise, because subjects had to lift their body up, the total load for 1RM also included upper body weight (trunk, arms and head), which corresponded to 67.8% of the total body weight [9].
After the familiarisation session, subjects were tested twice at the same time of day with an exact reproduction of the procedure. During the five to ten days separating the two repeated sessions, subjects were instructed to continue with usual daily activities. BP and SQ
standardised starting positions were strictly reproduced for each session. Exercise order, warm-up and rest intervals during testing were maintained each time. Intensive encouragement and feedback on maximal velocity results were systematically produced. The subjects received the instruction to lift the bar as fast as possible. In the BP exercise, three trials were carried out at 35% and 50% of 1RM (90 seconds rest between each trials), and two trials at 70% and 90% of 1RM (three minutes of rest). In the SQ exercise, three trials were carried out at 45% and 60% of 1RM (90 seconds rest between each trial), and two trials at 75% and 90% of 1RM (three minutes of rest).
Simulation study
To verify the reproducibility of our iso-inertial dynamometer by excluding any human source of error, a pulley system was designed to simulate standardised lifting of the barbell. A single pulley system fixed at the top of the Smith machine, facilitated the barbell lifting simulation (Figure 3). The barbell was joined to a heavier free weight via a steel cable and pulley system. The barbell was held over the safety locking devices in such a way that free weights stood about 60 centimetres above the ground (Figure 3a). Release of the bar and the falling down of free weights produced the standardised lifting simulation (Figure 3b). Figure 3 shows initial and final conditions of the lifting simulation. Lifting was simulated successively with two different free weights: 30 and 40 kg. In both conditions, twenty repeated measures were performed.
Statistical analysis
For the simulation study, CV were defined by the following formula, in order to appreciate the dynamometer reproducibility : % 100 ⋅ = χ SD CV
SD stands for the standard deviation of the twenty repeated measures, performed with a given free load, while x represented their mean value.
Measure of intra-session consistency was derived from the method described by Schabort et al. [36]. For each session, CVs were obtained by taking the square root of the average of the square of the CVs of individual subjects. Our results reported, for each parameter and each relative charge, the average value of the intra-session CVs observed during both sessions.
To investigate the agreement between the two sessions the coefficient of variation (CVSD) of the standard deviation (SD) was calculated over each pair of measurement. The best trial (highest PV) was systematically selected for analysis. In order to compare the performance of the subjects over the two different sessions in detail and in percent, the CVSD was calculated based on the following formula [17] :
% 100 2 1 1 2 ⋅ =
∑
∑
= = m j j m j j SD m x m d CVIn the numerator, d stands for the difference between the first and second measurement whereas m stands for the total number of subjects (j denotes an individual subject). In the denominator x is the mean of two measurements. The CVj SD is multiplied by 100 to express it
in % form.
For descriptive data, ordinary statistical methods were employed, including means (x) and standard deviation (SD). An analysis of variance (ANOVA) for repeated measurements was used to detect significant trial and day effects on performance while a paired t-test appreciated
significant differences between relative charges.
Results
Simulation study
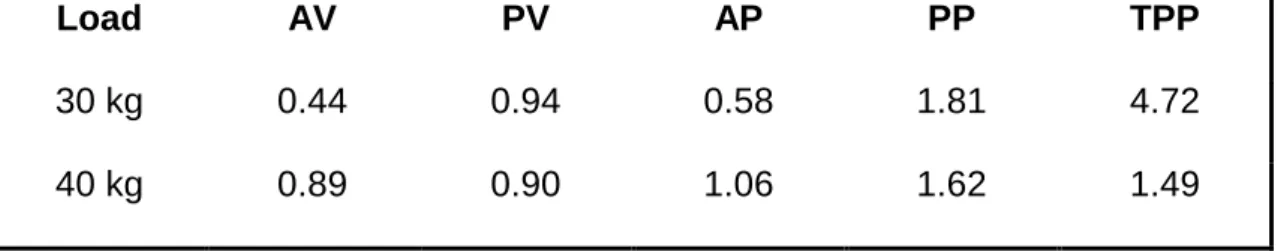
Results presented in Table 2 demonstrate excellent technological reproducibility for all settings in the two free weights conditions (CV<2%). Only the time to reach peak power (TPP) at 30 kg presented a somewhat lower reproducibility (CV = 4.72%). Average values (AV and PV) revealed better CV in comparison with corresponding maximal values.
BP and SQ reproducibility
Table 3 gives for all settings the coefficients of variation for intra- and inter-session reproducibility. In comparison with SQ movement, BP showed generally lower CV values. Peak and average velocity presented lower variability (ranging from 2.6% to 6.7% in BP and from 2.5% to 9.1% in SQ) than peak and average power (ranging from 4.2% to 9.3% in BP and from 4.9% to 9.6% in SQ). For both types of movement, time to peak power revealed the highest CV.
The ANOVA revealed that iso-inertial measurements did not significantly change from session 1 to session 2 . No systematic variation between trials was underlined.
Descriptive data
Based on the absence of significant change in performance between trials and days, an average value was calculated for each subject.
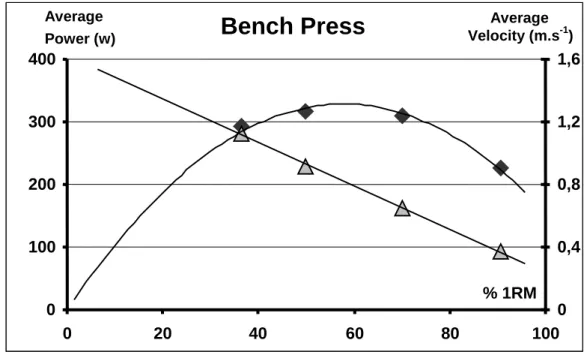
Figure 4 shows the relative load-power and load-velocity relationships in BP and SQ exercises based on average measurements. During both types of movement, velocity decreased with the relative charge increase, whereas power followed a parabolic curve profile. Maximal value for AP occurred toward 60% of 1RM in both exercises.
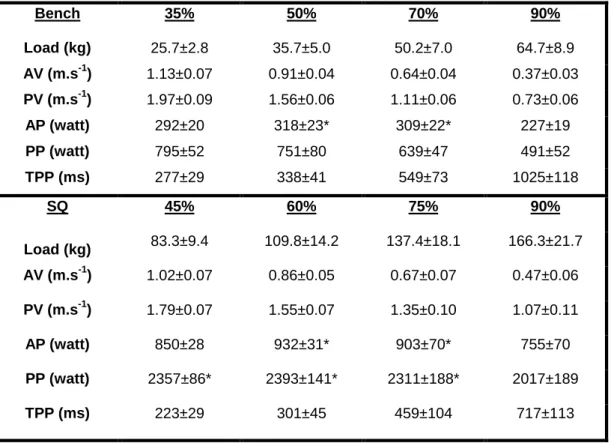
Complete descriptive data are presented in Table IV. For both exercises, velocity (AV and MV) decreased significantly, while TPP increased from the lightest to the heaviest load. In BP
movement, PP also significantly decreased with relative charge. In the squat, PP did not change from 45% to 75% of 1RM, then decreased at 95% of the 1RM. In both exercises, average power presented no significant difference between the two intermediate loads (50 and 70% for BP; 60 and 75% for SQ).
Discussion
Before application in the field, a new dynamometer has to be evaluated for reproducibility. A part of the variation in performance is coming from equipment (technological error) and notably includes device accuracy, calibration errors, data filtering operations, friction forces and system vibrations [22]. In order to assess the possible technological error of the iso-inertial dynamometer, a simulation study was performed in the conditions encountered during the BP and SQ exercises. For AV, PV, AP and PP, the coefficients of variation, ranging from 0.11% to 1.81%, were equivalent to those theoretically calculated for another iso-inertial dynamometers [7] and demonstrated the excellent reproducibility of parameters delivered by the iso-inertial dynamometer. Only the time to peak power (TPP) appeared less reproducible at the load of 30 kg (Table 2). Curve of power measurement revealed, near to the peak value, an uneven profile favouring great variations in the TPP apparition. A similar phenomenon has already been reported with the time to reach peak force in isometric assessment [35].
However, the principal variation in performance can be explained by biological error, which corresponds to human and protocol variations when reproducing SQ or BP lifting exercises in identical conditions. As protocol was strictly standardised, variations in performance can be said to be mainly human related, depending on technical, neurophysical and psychological factors. Intra- and inter-session CV have demonstrated that variability in performance appears similar when exercise is undertaken at the same time or on different days. According to Bosco et al. [7], keeping the best trial at each load for analysis, instead of taking
the mean of successive trials, can explain the highest inter-session reproducibility, in comparison with intra-session reproducibility. This phenomenon can be observed for the two heaviest loads only and not for the two lowest. We suspect the heaviest load conditions to be more influenced by slight form state variations, which would explain lower reproducibility in inter-day evaluations. The possible learning effect observed by Hortobagyi et al in BP [23] cannot justify this variability, as no significant day or trial influence was detected.
Our results indicated fairly good to excellent reproducibility for power and velocity measurements in both BP and SQ exercises. The CV ranged from 2.5 to 9.1% (Mean CV = 5.27) in the velocity and from 4.2 to 9.6% (Mean CV = 7.13) in the power measurements. Only time to peak power (TPP) presented weaker reproducibility (CV = 5.2 to 16.3%). Very little literature exists on the topic, making our study original. Moreover, published papers dealing with the iso-inertial evaluation rarely propose the same exercises and parameters as we have. Bosco et al. [7] used an iso-inertial dynamometer to assess squat exercises with a load equivalent to the subject’s body mass, and demonstrated for AV and AP coefficients of variation ranging from 2.5 to 5 % according to the variable. Comparatively, the present study focuses on a similar load (i.e. 60% of 1RM), with a slightly higher variability (4.0 to 6.6%). However, this level of reproducibility is close to the one reported in isokinetic assessment of knee flexors and extensors [11], and superior to the one observed by Jablonowsky et al. in BP and SQ isokinetic tests (CV = 8.9 and 15.6% respectively) [25]. Hopkins et al. [21] undertook a meta-analytic review in order to compare the reproducibility of many power tests. For more than one hundred studies, they calculated the standard error of measurement expressed as a coefficient of variation. Results described for iso-inertial and isokinetic tests were approximately the same as those obtained for BP and SQ exercises in the present study.
Velocity appears to be the steadiest parameter in repeated measures (see Table IV) and should be used favourably in iso-inertial follow up. Nevertheless, velocity can only be compared between the same load or the same amount of 1RM, whereas the majority of iso-inertial studies have proposed protocols with different evaluation modalities and relative loads [7, 24, 34]. An inter-individual or inter-population comparison could even so be performed by means of graphical representation or complex mathematical analysis.
Power evaluation, combining strength and velocity qualities, remains critical in several sports. Indeed, the actions of jumping, throwing, smashing and sprinting demand high power, and so justify the goal of power improvement in sport training. As strength level can compensate for velocity weakness and conversely, power appears to be the most representative parameter by which to gauge the athletic ability. Unfortunately, power measurement presented a lower reproducibility, which theoretically results from the addition of velocity and acceleration variability [7]. These findings were confirmed by other iso-inertial and isokinetic studies [7, 25, 34].
The great variability of TPP could be attributed, as suggested by Hortobagyi et al. [23], to individual inconsistency in starting to move the bar during heavy BP and SQ exercises. At lower loads, great variations in TPP could be also induced by uneven power records near PP (dips and bumps). The measure of TPP, which was expected to be representative of explosivity, did not appear to be a valid parameter. We would suggest that the time taken to reach a fixed power or velocity would be more suitable in that regard. Further research regarding explosivity appraisal in iso-inertial assessment is required.
We hypothesise that technical realisation patterns appear to be the principal source of variation. Indeed, complex multi-joint movements, like BP and SQ, require high intra- and inter-muscular coordination. Acquaintance with equipment and accurate reproduction of these movements appear more difficult than simple analytic exercises, such as
knee flexion-extension. From a biomechanical point of view, SQ exercise, which consisted of a four-joint degrees movement, may be considered to be more complex than BP, clearing up its greater variability when carrying out movement. Nevertheless, SQ movement maintained a fairly good reproducibility, with CV ranging from 2.5 to 9.6% for the majority of measurements. Learning effects already observed with complex multi-joint movements have underlined the usefulness of a pre-testing familiarisation period with exercise [23]. Seemingly, the only familiarisation session that we had planned seemed sufficient, as attested by a total absence of learning effect in both intra- and inter-session analysis of variance. We strongly recommend such a familiarisation session for non-expert subjects, even if BP and SQ are realised with a guide-bar. Particular attention must be paid to SQ movements, focusing particularly on knee flexion, pelvis position and back maintenance.
The description of our results provides information about BP and SQ load-power and load-velocity relationships among recreational sportsmen. The load-velocity relationships respected classical profile already observed in iso-inertial [6, 7, 15, 19, 24, 31] and isokinetic [3, 10, 11, 26, 33, 40] evaluations. The improvement in velocity accompanying the diminishment of loads has been attributed to an increase in the rate of cross-bridge attach-detach cycle, which equates to less time to generate tension for force production [15]. It also means greater internal resistance or viscosity, which equates to loss of force. Surprisingly, although the general profile corresponded to other studies, velocity measurements were systematically superior in our study when comparing identical relative charges [14, 15]. Except for the fact that subjects were strapped onto a bench in the Cronin et al. studies [14, 15], no major difference in the protocol design could explain these variations in performance. These findings possibly underline a lack of compatibility in devices and this point deserves further investigation.
The force-power relationship presented a similar profile in both movements, regarding a second degree polynomial equation. Other studies have confirmed this profile for BP, with the highest mean power value having been observed at between 50 to 60% of 1RM [6, 14]. Due to the lack of protocol standardisation, SQ force-power relationships have presented great variations in literature. Indeed, the loads used during assessment have been variously inspired by the subject’s body mass [7], the 1RM [24], or absolute values [34]. Moreover, some studies have introduced total, or upper body mass in SQ load, while others have used only barbell weight. Izquierdo et al. [24] confirmed our results in SQ with maximal power values observed at 60% of the 1RM.
Force-power and force-velocity relationships are perceived to be critical to the performance of many athletic tasks and, not surprisingly, their development is given high priority by many athletes and coaches [2]. Whereas isokinetic assessment should be used to explore an isolated muscle, iso-inertial evaluation is recommended to monitor global movements involving complex inter-muscular coordination. Undoubtedly, the iso-inertial concept contributes to a relevant sport-specific approach in muscular assessment. The transportability of the system allow the iso-inertial evaluation to be performed in the training venue. Moreover, this concept allows for the investigation of some specific features of exercise that cannot be explored by classical methods. For example, the iso-inertial tool is perfectly adapted to assess ballistic movements, using either projection [14, 15, 27] or the stretch-shortening cycle [14, 15]. Nevertheless, iso-inertial multi-joint protocols do have their limitations. For example, we have highlighted the difficulty involved in identifying isolated strength disorders in diagnostic tests. Thus, if a poor result is achieved through a squat test, it remains difficult to attribute the weakness specifically to the quadriceps, gluteal, hamstring or erector spinae muscle groups. Isolated tests must therefore be conducted in such instances in order to identify specific problems areas [39].
Conclusion
Undoubtedly, the iso-inertial concept offers an original approach in the assessment of multi-joint strength movements. Gestures under iso-inertial conditions appear close to those encountered during usual sports tasks, in terms of contraction mode, velocity and resistance loads to be overcome.
The newly developed iso-inertial dynamometer in the present study allowed the measurement of muscular performance in multi-joint upper and lower limbs, through BP and SQ exercises. Excellent technological reproducibility was demonstrated. Intra- and inter-session reproducibility was shown to be satisfactory for most measurements in young healthy male subjects. Differences in CV between both movements can be explained by the higher technical complexity of SQ exercise. We suggest that determination of power-charge and velocity-charge profiles would be useful in the supervision of longitudinal training and in comparison between populations.
Further investigations might be developed to appreciate the ability of this new iso-inertial dynamometer to reflect training-induced changes in performance and differences between specific sports practitioners.
References
[1] P. Aagaard, E.B. Simonsen, and P. Magnusson et al., A new concept for isokinetic hamstring:quadriceps muscle ratio. Am J Sports Med 26 (1998) 231-236.
[2] P.J. Abernethy, G. Wilson, and P. Logan, Strength and power assessment. Issues, controversies and challenges. Sports Med 19 (1995), 401-417.
[3] P.J. Abernethy and J. Jurimae, Cross-sectional and longitudinal uses of isoinertial, isometric, and isokinetic dynamometry. Med Sci Sports Exerc 28 (1996), 1180-1187.
[4] J. Augustsson and R. Thomee, Ability of closed and open kinetic chain tests of muscular strength to assess functional performance. Scand J Med Sci Sports 10 (2000), 164-168.
[5] D. Baker , G. Wilson, and B. Carlyon, Generality versus specificity: a comparison of dynamic and isometric measures of strength and speed-strength. Eur J Appl Physiol 68 (1994), 350-355.
[6] M.G. Bemben, J.L. Mayhew and D.M. Rohrs et al., Effect of resistance training on upper body strength, power and performance. J Appl Sports Sci Res 5 (1991), 162.
[7] C. Bosco, A. Belli and M. Astrua et al., A dynamometer for evaluation of dynamic muscle work. Eur J Appl Physiol 70 (1995), 379-386.
[8] U. Carlsson, K. Lind, M. Moller and J. Karlsson et al., Plantar flexor muscle function in open and closed chain. Clin Physiol 21 (2001), 1-8.
[9] C.E. Clauser, J.T. McConville, and J.W. Young, Weight, volume and center of mass of segments of the human body. Aerospace Medical Research Laboratiry (TR-69-70) 1969. [10] J.T. Cramer, T.J. Housh and J.P. Weir et al., Gender, muscle, and velocity comparison
of mechanomyographic and electromyographic response during isokinetic muscle actions. Scand J Med Sci Sports 13 (2003), 1-12.
[11] J.L. Croisier, and J.M. Crielaard, Exploration isocinétique : analyse des paramètres chiffrés. Ann Réadaptation Méd Phys 42 (1999), 538-545.
[12] J.L. Croisier and J.M. Crielaard, Hamstring muscle tear with recurrent complaints : an isokinetic profile. Isokinetics Exerc Sci 8 (2000), 175-180.
[13] J.L. Croisier, Factors associated with recurrent hamstring injuries. Sports Med 34 (2004), 681-695.
[14] J.B. Cronin, P.J. McNair, and R.N. Marshall, The role of maximal strength and load on initial power production. Med Sci Sports Exerc 32 (2000), 1763-1769.
[15] J.B. Cronin, P.J. McNair, and R.N. Marshall, Force-velocity analysis of strength-training techniques and load: implications for strength-training strategy and research. J Strength Conditioning Res 17 (2003),148-155.
[16] D.G. Dolny, M.G. Collins and T. Wilson et al., Validity of lower extremity strength and power utilizing a new closed chain dynamometer. Med Sci Sports Exerc 33 (2001),171-175.
[17] Z. Dvir, How much is necessary to indicate a real improvement in muscle function? A review of modern methods of reproducibility analysis. Isokinetics Exerc Sci 11 (2003), 49-52.
[18] A.C. Fry, W.J. Kraemer and C.A. Weseman et al., The effect of an off-season strength and conditioning program on starters and non starters in women’s intercollegiate volleyball. J Appl Sports Sci Res. 5 (1991), 174-181.
[19] K. Funato, A. Matsuo and T. Fukunaga, Measurement of specific movement power application : evaluation of weight lifters. Ergonomics 43 (2000), 40-54.
[20] M. Gorassini, J.F. Yang, M. Siu and D.J. Bennett, Intrinsic activation of human motorneurons: reduction of motor unit recruitment thresholds by repeated contractions. J Neurophysiol 87 (2002) 1859-1866.
[21] W.G. Hopkins, E.J. Schabort, and J.A. Hawley, Reliability of power in physical performance tests. Sports Med 31 (2001), 211-234.
[22] W.G. Hopkins, Measures of reliability in sports medicine and science. Sports Med 30 (2000),1-15.
[23] T. Hortobagyi and F. Katch, Reliability of muscle mechanical characteristics for isokinetic and isotonic squat and bench press exercise using a multifunction computerized dynamometer. Res Quat Exerc Sports 61 (1990), 191-195.
[24] M. Izquierdo, J. Ibanez and E. Gorostiaga et al., Maximal strength and power characteristics in isometric and dynamic actions of the upper and lower extremities in middle-aged and old men. Acta Physiol Scand 167 (1999) 57-68.
[25] R. Jablonowsky, O. Inbar and A. Rotstein et al., Evaluation of anaerobic performance capacity by the isokinetics ariel computerized exercise system-reliability and validity. J Sports Med Phys Fitness 32 (1992) 262-270.
[26] I. Jacobs, and J. Pope, A computerized system for muscle strength evaluation : measurement reproducibility, validity and some normative data. National Strength Conditioning J 8 (1986), 28-33.
[27] B. Jidovtseff and JM. Crielaard, Musculation fonctionnelle : influence du travail avec ou sans projection. Arch Physiol Biochem 111 (2003) Suppl Sept p45.
[28] P.V. Komi, H. Suominen and E. Heikkinen et al., Effect of heavy resistance training and explosive type strength training methods on mechanical, functional and metabolic
aspects of performance, in: Exercise and sport biology, P.V. Komi, ed., Human Kinetics, Champaingn, 1982, pp. 90-102.
[29] W.J. Kraemer and A.C. Fry, Strength testing: development and evaluation of methodology, in: Physiological assessment of human fitness, P.J. Maud, C. Foster, ed., Human Kinetics, Champaign, 1995, pp. 115-138.
[30] P. Logan, Fornasiero D, Abernethy P and Lynch K, Protocols for the assessment of isoinertiel strength, in: Physiological tests for elite athletes, C.J. Gore, ed., Australian sports commission, 2000, pp. 200-220.
[31] J.A. Mastropaolo, A test of the maximum-power stimulus theory for strength. Eur J Appl Physiol 65 (1992), 415-420.
[32] A.J. Murphy, G.J. Wilson, and J.F. Pryor, Use of the iso-inertial force mass relationship in the prediction of dynamic human performance. Eur J Appl Physiol 69 (1994), 250-257.
[33] A.J. Murphy and G.J. Wilson, The assessment of human dynamic muscular function : A comparison of isoinertial and isokinetic tests. J Sports Med Phys Fitness. 36 (1996), 169-177.
[34] A. Rahmani, G. Dalleau and F. Viale et al., Validity and reliability of a kinematic device for measuring the force developed during squatting. J Appl Biomechanics 16 (2000), 26-35.
[35] D.G. Sale, Testing strength and power, in: Physiological testing of the high-performance athlete, J.D. MacDougall, H.A. Wenger and H.J. Green, eds., Human Kinetics, Champaign, 1991 pp. 21-103.
[36] E.J. Schabort, W.G. Hopkins and J.A. Hawley, Reproducibility of self-paced treadmill performance of trained endurance runners. Int J Sports Med 19 (1998),48-51.
[37] C.J. Thompson, and M.G. Bemben, Reliability and comparability of the accelerometer as a measure of muscular power. Med Sci Sports Exerc 31 (1999), 897-902.
[38] M. Vanderthommen , S. Duteil and C. Wary et al., A comparison of voluntary and electrically induced contractions by interleaved 1H- and 31P-NMRS in humans. J Appl Physiol 94 (2003), 1012-1024.
[39] G.J. Wilson, A.D. Walshe and M.R. Fischer, The development of an isokinetic squat device: reliability and relationship to functional performance. Eur J Appl Physiol 75 (1997), 455-461.
[40] T. Wrigley, and G. Strauss, Strength assessment by isokinetics dynamometry, in: Physiological tests for elite athletes, C.J. Gore, ed., Australian sports commission, 2000, pp. 155-199.
Table 1 – Study design
Session 1 Session 2 Session 3
% 1RM Reps % 1RM Reps 45% 3 45% 3 90% 2 90% 2 60% 3 60% 3 BENCH PRESS 75% 2 75% 2 % 1RM Reps % 1RM Reps 45% 3 45% 3 90% 2 90% 2 60% 3 60% 3 Anthropometrical measurements 1RM determination in BP and SQ Familiarisation in BP and SQ SQUAT 75% 2 75% 2
Table 2 – Coefficients of variation (CV) (%) for the parameters AV, PV, AP, PP, and TPP in a standardised lifting simulation using 30 and 40 kg free weights
Load AV PV AP PP TPP
30 kg 0.44 0.94 0.58 1.81 4.72
Table 3 – Coefficients of variation (CV) (%) related to inter-trial and inter-session BP and SQ performance parameters AV, PV, AP, PP and TPP at each relative charge
BP inter-trial CV (%) BP inter-session CV (%) AV PV AP PP TPP AV PV AP PP TPP 35% 4.2 4.0 6.2 9.3 10.3 4.0 3.4 4.9 4.7 7.2 50% 3.3 3.4 4.2 8.4 9.8 3.4 2.6 4.9 7.6 8.3 70% 3.9 4.1 4.7 6.8 5.2 4.5 4.5 5.1 5.1 9.2 90% 5.8 5.8 5.8 6.6 7.0 6.7 6.1 6.1 7.3 8.5 SQ inter-trial CV (%) SQ inter-session CV (%) AV PV AP PP TPP AV PV AP PP TPP 45% 7.2 5.8 7.1 9.1 14.4 5.0 2.5 6.9 7.1 9.1 60% 6.5 5.8 6.6 9.4 8.4 4.0 3.3 4.9 7.9 10.4 75% 7.9 5.9 7.7 8.0 8.5 7.6 5.4 9.1 9.4 16.3 90% 8.8 6.9 8.7 9.3 10.1 9.1 7.1 9.6 9.6 11.3
Table 4 – Mean and standard deviation of the muscular performance profile of the subjects in BP and SQ exercises For a given feature, differences between charges are systematically significant for all features, except between *, which represents an absence of difference (p>0.05)
Bench 35% 50% 70% 90% Load (kg) 25.7±2.8 35.7±5.0 50.2±7.0 64.7±8.9 AV (m.s-1) 1.13±0.07 0.91±0.04 0.64±0.04 0.37±0.03 PV (m.s-1) 1.97±0.09 1.56±0.06 1.11±0.06 0.73±0.06 AP (watt) 292±20 318±23* 309±22* 227±19 PP (watt) 795±52 751±80 639±47 491±52 TPP (ms) 277±29 338±41 549±73 1025±118 SQ 45% 60% 75% 90% Load (kg) 83.3±9.4 109.8±14.2 137.4±18.1 166.3±21.7 AV (m.s-1) 1.02±0.07 0.86±0.05 0.67±0.07 0.47±0.06 PV (m.s-1) 1.79±0.07 1.55±0.07 1.35±0.10 1.07±0.11 AP (watt) 850±28 932±31* 903±70* 755±70 PP (watt) 2357±86* 2393±141* 2311±188* 2017±189 TPP (ms) 223±29 301±45 459±104 717±113
Figure 1 – Starting position in both BP and SQ exercises
Cable extension transducer
a. -1 ) -1 ) Velocity (0,57 m.s-1) AV = Average Velocity (1,16 m.s-1) PV = Peak b. PP = Peak Power (1993 w) AP = Average Power (847 w) TPP = Time Peak Power (486ms)
Figure 2 – Graphical representation of velocity and power measurements: AV and PV (a); AP,
a. Barbell 23kg Free Weigths 30 or 40Kg falling 60 cm Single Pulley Safety Lock b. Barbell 23kg Free Weigths 30 or 40Kg Lifting 60 cm Single Pulley Safety Lock Steel Cable
Figure 3 – Schematic representation of the lifting simulation before (a) and after (b) barbell
a.