HAL Id: hal-02349499
https://hal.archives-ouvertes.fr/hal-02349499
Submitted on 5 Nov 2019
HAL is a multi-disciplinary open access
archive for the deposit and dissemination of
sci-entific research documents, whether they are
pub-lished or not. The documents may come from
teaching and research institutions in France or
abroad, or from public or private research centers.
L’archive ouverte pluridisciplinaire HAL, est
destinée au dépôt et à la diffusion de documents
scientifiques de niveau recherche, publiés ou non,
émanant des établissements d’enseignement et de
recherche français ou étrangers, des laboratoires
publics ou privés.
Neurogenic decisions require a cell cycle independent
function of the CDC25B phosphatase
Frédéric Bonnet, Angie Molina, Mélanie Roussat, Manon Azais, Sophie
Bel-Vialar, Jacques Gautrais, Fabienne Pituello, Eric Agius
To cite this version:
Frédéric Bonnet, Angie Molina, Mélanie Roussat, Manon Azais, Sophie Bel-Vialar, et al.. Neurogenic
decisions require a cell cycle independent function of the CDC25B phosphatase. eLife, eLife Sciences
Publication, 2018, 7, �10.7554/eLife.32937�. �hal-02349499�
*For correspondence: [email protected] (FP);
[email protected] (EA)
†These authors contributed
equally to this work Competing interests: The authors declare that no competing interests exist. Funding:See page 25 Received: 18 October 2017 Accepted: 08 June 2018 Published: 03 July 2018 Reviewing editor: Constance L Cepko, Harvard Medical School, United States
Copyright Bonnet et al. This article is distributed under the terms of theCreative Commons Attribution License,which permits unrestricted use and redistribution provided that the original author and source are credited.
Neurogenic decisions require a cell cycle
independent function of the CDC25B
phosphatase
Fre´de´ric Bonnet
1†, Angie Molina
1†, Me´lanie Roussat
1, Manon Azais
2,
Sophie Bel-Vialar
1, Jacques Gautrais
2, Fabienne Pituello
1*, Eric Agius
1*
1
Centre de Biologie du De´veloppement, Centre de Biologie Inte´grative, Universite´
de Toulouse, CNRS, UPS, Toulouse, France;
2Centre de Recherches sur la Cognition
Animale, Centre de Biologie Inte´grative., Universite´ de Toulouse, CNRS, UPS,
Toulouse, France
Abstract
A fundamental issue in developmental biology and in organ homeostasis isunderstanding the molecular mechanisms governing the balance between stem cell maintenance and differentiation into a specific lineage. Accumulating data suggest that cell cycle dynamics play a major role in the regulation of this balance. Here we show that the G2/M cell cycle regulator CDC25B phosphatase is required in mammals to finely tune neuronal production in the neural tube. We show that in chick neural progenitors, CDC25B activity favors fast nuclei departure from the apical surface in early G1, stimulates neurogenic divisions and promotes neuronal differentiation. We design a mathematical model showing that within a limited period of time, cell cycle length modifications cannot account for changes in the ratio of the mode of division. Using a CDC25B point mutation that cannot interact with CDK, we show that part of CDC25B activity is independent of its action on the cell cycle.
DOI: https://doi.org/10.7554/eLife.32937.001
Introduction
In multicellular organisms, managing the development, homeostasis and regeneration of tissues requires the tight control of self-renewal and differentiation of stem/progenitor cells. This issue is particularly evident in the nervous system, where generating the appropriate number of distinct clas-ses of neurons is essential to constructing functional neuronal circuits.
Steadily increasing data reveal links between the cell cycle and stem cells’ choice to proliferate or differentiate (Soufi and Dalton, 2016). The G1 phase is usually associated with the initiation of dif-ferentiation. Notably, the length of the G1 phase has been shown to play a major role in controlling cell fate decisions in neurogenesis, haematopoiesis (Lange and Calegari, 2010) and mammalian embryonic stem cells (Coronado et al., 2013;Sela et al., 2012), including human embryonic stem cells (hESCs) (Pauklin and Vallier, 2013;Sela et al., 2012). During cortical neurogenesis, a lengthen-ing of the G1 phase is associated with the transition from neural-stem-like apical progenitors (AP) to fate restricted basal progenitors (BP) (Arai et al., 2011). Reducing G1 phase length leads to an increased progenitor pool and inhibition of neuronal differentiation, while lengthening G1 phase promotes the opposite effect (Calegari et al., 2005;Pilaz et al., 2009). In developing spinal cord, G1 phase duration increases with neurogenesis (Kicheva et al., 2014;Saade et al., 2013). Interest-ingly, in hESCs and in neurogenesis it has been shown that the stem/progenitor cell uses Cyclin D, which controls G1 phase progression, to directly regulate the signaling pathways and the transcrip-tional program controlling cell fate choice (Bienvenu et al., 2010; Lukaszewicz and Anderson, 2011;Pauklin et al., 2016;Pauklin and Vallier, 2013). A transient increase of epigenetic modifiers
at developmental genes during G1 has also been reported to create ‘a window of opportunity’ for cell fate decision in hESCs (Singh et al., 2015).
Modification of other cell cycle phases has been correlated with the choice to proliferate or differ-entiate. Work on hESCs reveals that cell cycle genes involved in DNA replication and G2 phase pro-gression maintain embryonic stem cell identity (Gonzales et al., 2015), leading the authors to propose that S and G2/M mechanisms control the inhibition of pluripotency upon differentiation. In the amphibian or fish retina, the conversion of slowly dividing stem cells into fast-cycling transient amplifying progenitors with shorter G1 and G2 phases, propels them to exit the cell cycle and differ-entiate (Agathocleous et al., 2007;Locker et al., 2006). A shortening of the S phase correlates with the transition from proliferative to differentiating (neurogenic) divisions in mouse cortical pro-genitors (Arai et al., 2011). In the developing spinal cord, shorter S and G2 phases are associated with the neurogenic phase (Cayuso and Martı´, 2005;Kicheva et al., 2014;Le Dre´au et al., 2014;
Molina and Pituello, 2017;Peco et al., 2012;Saade et al., 2017,2013;Wilcock et al., 2007). Until now these links between cell cycle kinetics and cell fate were most often correlations, with the direct impact of cell cycle modifications on cell fate choice being only indirectly addressed. The strong cor-relations between the cell cycle machinery and the stem cell’s choice in different model systems, emphasize the importance of elucidating how these systems work.
Notably, in developing neuroepithelia, cell cycle is synchronized with an oscillatory nuclear move-ment called Interkinetic Nuclear Migration (INM). Nuclei of progenitor cells occupy specific positions according to cell cycle phase: nuclei migrate basally in the G1 phase, so that the S phase occurs on the basal side, and apically in the G2 phase, allowing mitosis to happen at the apical surface (Molina and Pituello, 2017;Norden et al., 2009). In mouse corticogenesis and in the chicken neural tube, it was shown that nuclei migrate apically during G2 using the dynein/microtubule motor system (Baffet et al., 2015;Spear and Erickson, 2012). It has been established that a key cell cycle regula-tor, the cyclin-dependent kinase 1 (CDK1), triggers dynein recruitment to nuclear pores leading to apical nuclear movement during G2 phase (Baffet et al., 2015). The mechanisms involved in basal-ward migration in G1 are more controversial, ranging from a passive and stochastic process driven by a crowding effect to a movement triggered by microtubule/kinesin3 or actomyosin cytoskeleton (Miyata et al., 2014;Molina and Pituello, 2017;Spear and Erickson, 2012). In the chicken spinal cord, zebrafish retina and rat neocortex, it has been proposed that progenitor nuclei position along the apico-basal axis could lead to a differential exposure to proliferative or differentiative signals that could in turn regulate progenitors cell fate (Carabalona et al., 2016;Del Bene, 2011;Del Bene et al., 2008;Murciano et al., 2002).
A link has previously been established between a regulator of the G2/M transition, the CDC25B phosphatase and neurogenesis (Gruber et al., 2011;Peco et al., 2012;Ueno et al., 2008). The cell division cycle 25 family (CDC25) is a family of dual specificity phosphatases that catalyze the dephos-phorylation of CDKs, leading to their activation and thereby cell cycle progression (Aressy and Ducommun, 2008). Three CDC25s A, B, C have been characterized in mammals, and two, CDC25s A and B have been found in chick (Agius et al., 2015;Boutros et al., 2007). As observed for numer-ous cell cycle regulators, these molecules are tightly regulated at the transcriptional and post-tran-scriptional levels (Boutros et al., 2007). The N-terminal region of CDC25B contains the regulatory domain, and the C-terminal region hosts the catalytic domain and the domain of interaction with known substrates, the CDKs (Sohn et al., 2004). In Xenopus, CDC25B loss-of-function reduces the expression of neuronal differentiation markers (Ueno et al., 2008). An upregulation of CDC25B activity associated with precocious neurogenesis has been observed in an animal model of micro-cephaly (Gruber et al., 2011). Using the developing spinal cord as a paradigm, we previously reported that CDC25B expression correlates remarkably well with areas where neurogenesis occurs (Agius et al., 2015;Peco et al., 2012). We showed that reducing CDC25B expression in the chicken neural tube alters both cell cycle kinetics, by increasing G2-phase length, and neuron production (Agius et al., 2015;Peco et al., 2012). However, it is not clear whether the change in cell cycle kinetics is instrumental in cell fate change.
The aim of the present study is to further understand the mechanisms by which CDC25B pro-motes neurogenesis. First, we use a neural specific loss-of-function in mice to show that Cdc25b is also required for efficient neuron production in mammals. Second, we use gain- and loss-of-function in chicken to show that CDC25B is necessary and sufficient to promote neuron production by con-trolling the mode of division. We directly measured CDC25B effects upon modes of division, using
recently developed biomarkers that allow differentiating with single-cell resolution proliferative ver-sus neurogenic divisions in the developing spinal cord (Le Dre´au et al., 2014;Saade et al., 2017;
Saade et al., 2013). We also carried out a clonal analysis using the Brainbow strategy (Loulier et al., 2014). Both approaches show that CDC25B decreases proliferative divisions and promotes neuro-genic divisions. In addition, we show that CDC25B controls the switch from slow to fast nuclei depar-ture to the basal side during early G1 in the proliferative population. A mathematical model of these dynamics suggests that the cell cycle duration is not instrumental in the observed evolution of the mode of division.
Furthermore, to directly address the putative role of cell cycle kinetics on the mode of division, we use a point mutated form of CDC25B, CDC25BDCDKunable to interact with CyclinB/CDK1
com-plex. We show that this molecule affects basal G1 movement, neurogenic divisions and neuronal dif-ferentiation, even though it does not affect the duration of the G2 phase.
Results
Genetic Cdc25b invalidation induces a G2-phase lengthening and
impedes neuron production in the mouse developing spinal cord
We previously showed that downregulating CDC25B levels using RNAi in the chicken neural tube results in a G2 phase lengthening and a reduction of the number of neurons (Peco et al., 2012). Here we used a genetic approach to question whether both functions are conserved in mammals, using a floxed allele of Cdc25b and a NestinCre;Cdc25bþ=" mouse line to specifically ablate the
phosphatase in the developing nervous system (Figure 1A). In the mouse embryo, Cdc25b is detected in the neural tube from E8.5 onward and remains strongly expressed in areas where neuro-genesis occurs, as illustrated in the E11.5 neural tube (Figure 1B). Loss of Cdc25b mRNA was observed from E10.5 onward in NestinCre;Cdc25bfl="embryos (Cdc25bnesKO,Figure 1B). We
there-fore determined the consequences of the Cre-mediated deletion of the floxed Cdc25b allele on cell cycle parameters and neurogenesis starting at E11.5.
The proliferation capacity of the neural progenitors in NestinCre;Cdc25bfl=" embryos, was
deter-mined by quantification of EdU labelled replicating neural progenitors. The proliferative index in the dorsal spinal cord (number of EdU+ cells among total number of neural progenitors labelled with Pax7 antibody) was similar between NestinCre;Cdc25bfl=" and control embryos (NestinCre;
Cdc25bfl=þ or Cdc25bfl=þ or Cdc25bfl=") (Figure 1C). Similarly, the fraction of mitotic cells assessed
by quantifying the number of Phospho-Histone 3 (PH3) mitotic cells in the Pax7+ cells displayed a slight and non-significant reduction in the mitotic index of mutant embryos (Figure 1D). Since down-regulating CDC25B in the chicken neural tube resulted in a lengthening of the G2 phase, we next compared the length of the G2 phase in the dorsal spinal cord of NestinCre;Cdc25bfl="versus
con-trol embryos using the percentage of labeled mitosis (PLM) (Quastler and Sherman, 1959). Embryos were injected with EdU and allowed to recover for 1 hr, 2 hr or 3 hr before fixation and staining with EdU and PH3 antibodies. We found that the percentage of PH3/EdU positive cells was consistently lower in the dorsal domain of NestinCre;Cdc25bfl="versus control embryos (Figure 1E).
The average G2-lengths extracted from the curve were 2 hr 19 min in mutants compared to 1 hr 49 min in controls (Figure 1E). This indicates that Cdc25b loss-of-function in dorsal neural progenitors results in a G2 phase lengthening.
The question is then whether Cdc25b loss-of-function affects spinal neurogenesis. Neuron pro-duction occurs in two phases in the dorsal spinal cord, an early neurogenic phase (between E9.5 and E11.5) and a late neurogenic phase (between E11.5 and E13.5) (Hernandez-Miranda et al., 2017). Neurons emerging from the dorsal spinal cord express numerous transcription factors including Pax2 and Tlx3 that label distinct neuron types and when combined, identify different subtypes of early (Pax2: dl4, dI6; Tlx3: dI3, dI5) and late born neurons (Pax2: dILA; Tlx3: dILB). The use of a Nes-tinCre mouse line allows us to accurately ablate the phosphatase at the time of late neuron produc-tion (Hernandez-Miranda et al., 2017). We hence analyze the impact of the deletion at E11.5 and E12.5. At E11.5, the number of Tlx3+ cells is reduced in the NestinCre;Cdc25bfl="compared to
con-trol embryos. Pax2+ neurons are also reduced yet non-significantly (Figure 1F,G). One day later, a clear and significant reduction of 25.7% and 28% in the number of Pax2+ and Tlx3+ neurons,
Figure 1. Cdc25b conditional genetic loss-of-function increases the G2-phase length and impairs dorsal spinal neurogenesis. (A) Scheme of the genetic construction for Cdc25b conditional loss-of-function. (B) Cdc25b in situ hybridization at E11.5 in control (Cdc25bCTL) and conditional nesKO
(Cdc25bnesKO) conditions. (C–D) Box plots (5/95 percentile) comparing the proliferative index: distribution of the percentage of EdUþ/Pax7þcells
indicative of the rate of S-phase cells at E11.5 in control and nesKO neural tubes (C), distribution of the percentage of PH3þ/Pax7þcells indicative of
the mitotic index at E11.5 in control and nesKO neural tubes (D). The proliferative index was analyzed using 20 control and seven nesKO embryos. (E) Progression of the percentage of EdUþPH3þ/total PH3þlabeled nuclei with increasing EdU exposure time in control and nesKO conditions. The
dashed lines correspond to 50% EdUþ/PH3þcells and indicate the G2 length. (F) Cross-sections of E12.5 embryo neural tubes, stained with Pax7, Pax2
and Tlx3 immunostaining in control and nesKO conditions. (G) Box plots (5/95 percentile) comparing the distribution of the number of Pax2 and Tlx3 neurons in control and nesKO conditions at E11.5 and E12.5. The number of analyzed embryos was 15 control vs 11 nesKO for Pax2 and 15 control vs 10 nesKO for Tlx3. The cross indicates the mean value. Mixed model, ** p<0.01. Scale bar represents 100 mm.
DOI: https://doi.org/10.7554/eLife.32937.002
The following figure supplement is available for figure 1:
Figure supplement 1. Cdc25b conditional genetic loss-of-function affects the progenitor pool. DOI: https://doi.org/10.7554/eLife.32937.003
respectively, is observed following Cdc25b deletion. Progenitor domain size measured at E11.5 and E12.5 using Pax7 or Sox2 immunohistochemistry shows non-significant differences (Figure 1—figure supplement 1). Analysis of dorsal progenitor nuclear density using DAPI shows a small and constant 7.5% and 7.3% reduction at E11.5 and E12.5, respectively, in mutant versus control embryos ( Fig-ure 1—figFig-ure supplement 1), indicating that neuronal reduction is at least partly due to this small reduction in the progenitor population. Quantification of active caspase three immunostaining (E12.5) does not reveal an increase in cell death, showing that the reduction in neuron number is not due to apoptosis (not shown). The ratio of dILA to dILB neurons is similar in control (0.68) and mutant embryos (0.71), confirming that Cdc25b does not impact specific neuronal cell type but rather has a generic effect on neuron production. Together, these observations demonstrate that efficient spinal neuron production requires CDC25B in mammalian embryos and illustrate that this function is conserved among higher vertebrates.
CDC25B gain-of-function increases neuronal production
The fact that CDC25B downregulation impedes neuron production in mouse and chicken embryos, prompted us to test whether CDC25B gain-of-function is sufficient to stimulate neurogenesis. It is not possible to perform CDC25B gain-of-function using a robust ubiquitous promoter, because an unscheduled increase of the phosphatase during the cell cycle leads to mitotic catastrophe and sub-sequent apoptosis (Peco et al., 2012). To circumvent this technical impasse, we express CDC25B using the mouse cell cycle dependent CDC25B cis regulatory element (ccRE) that reproduces the cell cycle regulated transcription of CDC25B (Ko¨rner et al., 2001) and prevents apoptosis (Kieffer et al., 2007). We verify that ccRE is sufficient to drive lacZ reporter expression in the entire chicken neural tube after transfection by in ovo electroporation (Figure 2—figure supplement 1A). Under the control of ccRE, the eGFP-CDC25B fusion protein is expressed in a subset of transfected cells (Figure 2A). The level of chimeric protein detected results from the periodic expression induced by the promoter and the intrinsic instability of CDC25B actively degraded at the end of mitosis. The fusion protein can be observed both in the nucleus and cytoplasm of neuroepithelial progenitors located close to the lumen (L) and in mitotic progenitors (Figure 2A, arrowhead). The gain-of-function does not induce apoptosis, as revealed by quantification of active caspase three immunostaining (Figure 2—figure supplement 1B–D). To ascertain that the phosphatase is func-tional, we analyze its impact on G2 phase duration. As expected, ectopic expression of the phospha-tase shortens the G2 phase (Figure 2B, blue curve) without significantly modifying the mitotic index or the proliferation index (Figure 2—figure supplement 1E–F).
Quantitative analysis performed on the entire neural tube using NeuroD-reporter assay indicates that increasing CDC25B is sufficient to promote neuronal commitment (Figure 2—figure supple-ment 2). In the neural tube, development of the ventral progenitor population is usually considered more advanced than its dorsal counterpart (Kicheva et al., 2014;Saade et al., 2013). Accordingly, the temporality of neuron production progresses from ventral to dorsal (Kicheva et al., 2014;
Saade et al., 2013) and correlates with endogenous CDC25B expression (Peco et al., 2012). We therefore analyze separately the fraction of neurons generated following CDC25B gain-of-function in the ventral and dorsal halves of this structure. In the ventral neural tube, CDC25B gain-of-function increases the percentage of HuC/Dþ GFPþ cells from 61.6 #1.5% to 76.5 # 0.9%. Similarly, in the
dorsal spinal cord, the proportion increases from 30.7 #1.34% to 41.8 # 2.64% with the CDC25B gain-of-function (Figure 2F,G). A significant increase in neurogenesis is also observed using Pax2 immunostaining, from 11.4 #1% to 20 # 1.8% (Figure 2C,D). Conversely, CDC25B gain-of-function reduces the proportion of cells expressing the progenitor marker Sox2 (Figure 2E). Together, these results indicate that CDC25B is sufficient to stimulate neuron production.
CDC25B has no effect on mitotic spindle parameters
An increase in CDC25B activity has been shown to induce a shifted cleavage plane and precocious neurogenesis during corticogenesis in mouse (Gruber et al., 2011). We therefore tested the effect of CDC25B gain-of-function on spindle orientation in spinal neural precursors. We measured the angle of the mitotic spindle as previously described (Saadaoui et al., 2014), and we did not observe a significant change in spindle orientation (Figure 3A,B). Another element implicated in asymmetric cell fate in neural progenitors is the spindle-size asymmetry (SSA), that is, the difference in size
Figure 2. CDC25B speeds up neuronal production. (A) Cross section of E2.5 chick spinal cord 24 hr after electroporation of pCAG::H2B-RFP vector and pccRE::GFP-CDC25B vector, followed by an anti-GFP
immunolocalisation. Note that the protein is expressed in the dorsal neuroepithelium in cells exhibiting a nucleus close to the lumen side (L) or undergoing mitosis (arrowhead). Scale bar indicates 50 mm. (B) Curves representing the percentage of electroporated GFPþEdUþPH3þover the total GFPþEdUþcells with increasing EdU exposure
times: control (black), CDC25B gain of function (blue). Note that the curve corresponding to the CDC25B condition (blue) is shifted to the left, showing a reduction in G2 phase length. (C) Representative sections of E3.5 chick spinal cord 48 hr after co-electroporation of a pCAG::H2B-GFP with either a pccRE::lacZ (control) or a pccRE::CDC25B expression vector and processed for Pax2 (red) and HuC/D (blue) immunostaining. The red box illustrates the quantified domain. Scale bars indicate 100 mm. (D) Box plots (5/95 percentile) comparing the percentage of Pax2þcells within the electroporated population in the control and CDC25B gain-of-function
experiments in the dorsal neural tube. Data from three different experiments with eight embryos for the control, and five embryos for the CDC25B gain-of-function. (E) Representative sections of E3.5 chick spinal cord 48 hr after Figure 2 continued on next page
between the two sides of the spindle (Delaunay et al., 2014). Our CDC25B gain-of-function experi-ments did not induce a significant modification of the SSA in chick spinal neural progenitors (Figure 3C–D). In summary, our analyses did not reveal an effect of CDC25B activity on the orienta-tion or the size of the mitotic spindle.
CDC25B downregulation maintains proliferative divisions and hinders
neurogenic divisions
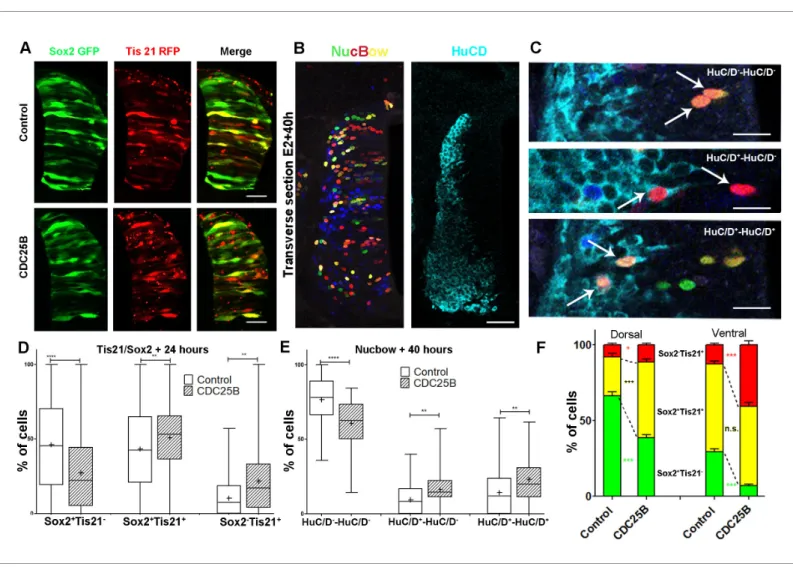
To elucidate CDC25B function, we investigate whether it promotes neurogenesis by controlling the division mode of neural progenitors. We take advantage of a strategy recently developed by E. Marti and colleagues, described to distinguish the three modes of division, PP, PN and NN, occur-ring in the developing chicken spinal cord (Le Dre´au et al., 2014;Saade et al., 2017;Saade et al., 2013). Briefly, the neural tube is electroporated with Sox2::GFP and Tis21::RFP reporters, and 24 hr later the number of neural progenitors expressing these markers is quantified at mitosis. Thus, Sox2þTis21" cells expressing only Sox2::GFP correspond to PP divisions, Sox2"Tis21þ cells
corre-spond to NN divisions, while cells co-expressing both biosensors Sox2þTis21þcorrespond mostly to
asymmetric neurogenic divisions, PN (Figure 4A). Using these biomarkers in the dorsal neural tube, we obtained comparable results to the ones previously described (Figure 2B in Le Dre´au et al., 2014). Because the number of electroporated cells in mitosis is very small, we determine whether counting neural progenitors displaying green, yellow or red fluorescence is equivalent to counting only mitotic cells in the dorsal spinal cord 24 hr post electroporation. We do not detect a significant difference in the distribution of cells in total neuroepithelial progenitors (55.4 ± 6.2% Sox2þTis21"
cells, 29.3 ± 3.9% Sox2þTis21þ cells and 15.2 ± 2.9% Sox2"Tis21þ cells) and during mitosis
(57.9 ± 9.3% Sox2þTis21" cells, 23.2 ± 8.5% Sox2þTis21þ cells and 19 ± 7.3% Sox2"Tis21þ cells)
(Figure 4B). Because of reporter stability, the temporal window of analysis of Sox2/Tis21 reporters is restricted to 24 hr (Saade et al., 2013). Recent data indicate that Sox2 mRNA expression can be sus-tained in some neurogenic progenitors (Albert et al., 2017). A fraction of the Sox2þTis21þ cells
might therefore correspond to NN rather than PN divisions, suggesting that the use of these bio-markers is not sufficient to separate PN and NN divisions in our experimental conditions. Therefore, even if we quantified separately the three populations, we considered the Sox2þTis21þ and the
Sox2"Tis21þ progeny as a whole, producing neurogenic divisions, and compared it to the
Sox2þTis21"cells performing proliferative divisions.
CDC25B RNAi electroporation leads to a consistent and strong downregulation in CDC25B tran-scripts located in the intermediate neural tube (Figure 4C, bracket). We therefore determine the impact of CDC25B downregulation on the mode of division in progenitors located in this domain. We co-electroporate the biomarkers with either the CDC25B-RNAi plasmid, or the control scram-bled plasmid at stage HH11, and quantify the distribution of Sox2þTis21", Sox2þTis21þ and
Sox2"Tis21þ cells 24 hr later at stage HH17 (Figure 4D–E). When compared to the control
scram-bled RNAi, the CDC25B RNAi induces a massive increase in Sox2þTis21" progeny (13.4 ± 1.3% to
35.1 ± 1.8%), and a decrease in Sox2þTis21þ progeny (from 72.1 ± 1.85% to 56.2 ± 1.70% and to
some extent, in Sox2"Tis21þ progeny (from 14.6 ± 1.43% to 8.74 ± 0.8%, Figure 4E). Therefore
Figure 2 continued
co-electroporation of pCAG::H2B-GFP with either a control or a CDC25B expression vector and processed for Sox2 (red) and HuC/D (blue) immunostaining. Scale bars indicate 100 mm. (F) Box plots (5/95 percentile) comparing the percentage of electroporated HuC/Dþcells in the ventral and dorsal neural tube. Data represent
three different experiments with a total of 13 dorsal and six ventral embryos for the control, and 6 dorsal and seven ventral embryos for the CDC25B gain-of-function. The cross represents the mean value. (G) Box plots (5/95 percentile) comparing the percentage of Sox2þcells within the electroporated dorsal or ventral neural tube in the
control, and CDC25B gain-of-function. Same conditions as in F. DOI: https://doi.org/10.7554/eLife.32937.004
The following figure supplements are available for figure 2:
Figure supplement 1. CDC25B gain-of-function does not increase apoptosis, S or M cell cycle phase lengths. DOI: https://doi.org/10.7554/eLife.32937.005
Figure supplement 2. Effects of various CDC25B constructs on NeuroD promoter activity. DOI: https://doi.org/10.7554/eLife.32937.006
Figure 3. CDC25B gain-of-function does not affect mitotic spindle orientation or spindle-size asymmetry (SSA). (A) Representative Z plane image of an anaphase cell expressing H2B-GFP that decorates chromosomes (green) and immunostained with anti g tubulin antibody to label centrosomes (red). Aligned interphase centrosomes labelled as one and mitotic spindle poles labelled as 2 (middle image) were used to measure mitotic spindle angle a (lower image). (B) Quantification of mitotic spindle angle a, 24 hr after electroporation in control and CDC25B gain-of-function experiments. (C) Representative image of a symmetric metaphase cell: H2B-GFP and DAPI stain the nuclei, and a-Tubulin stains the mitotic spindle (left and middle images). Right image, 3D reconstruction of the symmetric spindle using Imaris software. (D, E) Distribution of the Spindle-Size Asymmetry (SSA) difference between the two sides of the spindle 24 hr after electroporation in control and CDC25B gain-of-function: Histogram of SSA distribution (D) and scatter plot of SSA distribution (E). Scale bars represent 5 mm.
CDC25B RNAi increases proliferative divisions from 13.4 ± 1.3% to 35.1 ± 1.8% and decreases neurogenic divisions from 86.6 ± 1.3% to 63.9 ± 1.8% (P-value < 0,0001). This observation indi-cates that CDC25B downregulation hinders neu-ron production by maintaining proliferative divisions and reducing neurogenic divisions.
CDC25B Gain-of-function promotes
neurogenic divisions
We then tested how CDC25B gain-of-function affects the mode of division using two different approaches: the Tis21/Sox2 assay (Saade et al., 2013) (Figure 5A,D,F), and a clonal analysis using the Brainbow technique (Tozer et al., 2017) (Figure 5B,C,E). Analyzing the distribution of the mode of division with the Tis21/Sox2 strat-egy in the entire neuroepithelium at 24 hr after electroporation, showed that CDC25B leads to a decrease in Sox2þTis21" progeny (from 46.1
#2.1% to 27.3 # 1.8%), an increase in Sox2þTis21þ progeny (from 43.4 #1.9% to 50.9
# 1.6%), and Sox2"Tis21þ progeny (from 10.5
#0.8% to 21.8 # 1.5%,Figure 5A,D). This shows that CDC25B gain-of-function reduces prolifer-ative divisions from 46.1 ± 2.1% to 27.3 ± 1.8% and increases neurogenic divisions from 53.8 ± 2.1% to 72.7 ± 1.8% (P-value < 0,0001). Embryos co-transfected with the Nucbow vector (Loulier et al., 2014), limiting amounts of Cre recombinase (Morin et al., 2007) and the various gain-of-function constructions, were harvested after 40 hr at stage HH21 and labelled using HuC/D immunostaining (Figure 5B,C). Two cells clones located in low electroporated density area were selected on the basis of color identity (Tozer et al., 2017) and categorized as prolifer-ative divisions: HuC/D"-HuC/D" (upper panel in
Figure 5C), and neurogenic divisions either HuC/ Dþ-HuC/D"(middle panel inFigure 5C) or HuC/
Dþ-HuC/Dþ(lower panel inFigure 5C).
Using this alternative strategy, we showed that the expression of CDC25B leads to a decrease in HuC/D"-HuC/D" cells (from 76.5
#2.6% to 60.7 # 2.3%) and to an increase in HuC/D"-HuC/Dþ cells (from 9.4 #1.5% to 16.3 #
1.7%) and HuC/Dþ-HuC/Dþ (from 14.1 #2.3% to
23.0 # 2.1%,Figure 5E). We observe a decrease in proliferative divisions from 76.5 ± 2.6% to 60.7 ± 2.3% and an increase of neurogenic divi-sions from 23.8 ± 2.5% to 39.4 ± 2.3% (P-value < 0.001). While the mode of division repartitions were probably different due to inherent differen-ces in the two strategies, CDC25B gain-of-func-tion results in consistent modificagain-of-func-tions in both Figure 4. CDC25B downregulation reduces neurogenic
divisions. (A) Schematic representation of the Sox2:: GFP Tis21::RFP labelling strategy. A GFP expressing cell (green cell) corresponds to a PP division, a cell expressing both GFP and RFP (yellow cell) corresponds to a PN division, and a RFP expressing cell (red cell) corresponds to a NN division. (B) Bar plot representing the percentage of cells expressing the reporters Sox2:: GFP and Tis21::RFP at HH17 in the entire progenitor population, or in progenitors performing mitosis identified with phospho-histone-3 (PH3) immunostaining. Note that these results are not significantly different. These data are obtained from three different experiments, seven embryos, 365 progenitors, and 79 mitoses. (C) In situ hybridization for CDC25B on HH17 spinal cord, 24 hr post
electroporation of Control RNAi (left panel) and CDC25B RNAi (right panel). The reduction of CDC25B expression in the intermediate region is indicated by a bracket. Cells were electroporated on the right side of the neural tube (not shown). Scale bars indicate 100 mm. (D) Cross-sections of chick spinal cord at HH17, 24 Figure 4 continued on next page
assays : a reduction of 15.8 percentage-points (pp) (from 76.5% to 60.6%) and 18.8 pp (from 46.1% to 27.3%) in proliferative divisions and a corollary increase of 15.8 pp (from 23.7% to 36.4%) and 18.8 pp (from 53.8% to 72.7%) in neurogenic divisions in the Nucbow and the Tis21/Sox2 assays, respectively (Figure 5D,E). These results indicate that CDC25B gain-of-function in spinal neural progenitors reduces Figure 4 continued
hr after co-electroporation of Sox2::GFP and Tis21::RFP reporter, plus a control RNAi vector or the CDC25B-RNAi vector. Scale bars indicate 50 mm. (E) Bar plot representing the percentage of progenitors expressing Sox2::GFP and Tis21::RFP 24 hr after co-electroporation of a control vector or a CDC25B RNAi vector. 4 experiments include seven control embryos and 15 CDC25B RNAi embryos.
DOI: https://doi.org/10.7554/eLife.32937.008
Figure 5. CDC25B gain-of-function promotes neurogenic divisions. (A) Representative cross-sections of HH17 chick spinal cord, 24 hr after electroporating Sox2::GFP and Tis21::RFP reporters, plus a control vector pccRE::lacZ, or a pccRE::CDC25B vector. Scale bars indicate 50 mm. (B) Representative cross-sections of HH21 chick spinal cord, 40 hr after electroporation of Nucbow and pCX CRE vectors, and immunostaining with HuC/D antibody. Scale bar indicates 50 mm. (C) Specific two cell clone examples, 40 hr after transfection of Nucbow and immunostaining with HuC/D antibody. Scale bars indicate 10 mm. (D) Box plots (5/95 percentile) comparing the percentage of progenitors expressing Sox2::GFP and Tis21::RFP 24 hr after co-electroporation with control or CDC25B vectors in the entire spinal cord. Data represent the means # SEM of 3 different experiments with 5 control and 6 CDC25B gain-of-function embryos. (E) Box plots (5/95 percentile) comparing the percentage of two cell clones expressing Nucbow and pCX CRE vectors, 40 hr after co-electroporation with control or CDC25B vectors in the entire spinal cord. Data represent the means # SEM of 3 different experiments with 387 clones in 12 control embryos, and 659 clones in 11 CDC25B gain-of-function embryos. (F) Bar plot representing the percentage of progenitors expressing Sox2::GFP and Tis21::RFP 24 hr after co-electroporation with control or CDC25B vectors in the dorsal and ventral spinal cord. Data represent the means # SEM. Data represent three different experiments with 5 dorsal and 10 ventral neural tubes in the control, and 5 dorsal and six ventral neural tubes in the CDC25B gain-of-function.
proliferative divisions and promotes neurogenic divisions.
As previously described, neurogenesis progresses from ventral to dorsal in the developing spinal cord. Accordingly, at the electroporation time (stage HH11), the neural tube contains essentially self-expanding progenitors (Le Dre´au et al., 2014;Saade et al., 2013). 24 hr later, (stage HH17), the repartition of the modes of division is not the same in dorsal and ventral control conditions. Dorsal neural tube contains mainly self-expanding progenitors (66.3% Sox2þTis21" cells, Figure 5A,F)
Figure 6. Mathematical model linking the mode of division to the fraction of neurons generated. (A) Scheme of the experimental time course. Neural tubes are electroporated at stage HH11. 24 hr (HH17) and 48 hr (HH22) post electroporation, cell cycle parameters, mode of division and progenitor/neuronal markers are analyzed. (B) Illustration of our mathematical model. We consider P(t) a pool of progenitors at a given time with a mitotic rate h. These mitoses lead to three modes of division: a fraction appproducing symmetric proliferative divisions yielding
two progenitors, a fraction apnproducing asymmetric divisions yielding one progenitor and one neuron (a
precursor of), and a fraction annproducing symmetric neurogenic divisions yielding two neurons. The equations
display the dynamics governing the pools of progenitors P(t) and neurons N(t) at any time t. These dynamics are solved for a given initial condition P(0), N(0), and we obtain the state of the system any time later (Solution, details in Appendix 2 and Appendix 4). (C) Kinetic predictions of the neuronal fraction between stages HH17 and HH22 in the different conditions, compared to the mean #95% confidence interval (in red) of the experimental data at stages HH17 and HH22 (from FiguresFigure 2FandFigure 7E).
(Le Dre´au et al., 2014), whereas ventral neural tube encloses essentially neurogenic progeny (58% of Sox2þTis21þcells and 12.7% of Sox2"Tis21þcells,Figure 5A,F) (Saade et al., 2013). Because of
this difference, we analyze the effects of CDC25B on the dorsal and ventral neural tube separately. In the dorsal neural tube, CDC25B gain-of-function leads to a reduction in the percentage of Sox2þTis21" progeny (from 66.3 ± 2.6% to 38.6 ± 2.1%) and a concomitant increase in the
percent-age of Sox2þTis21þ progeny (from 25.9 ± 2.1% to 50.1 ± 1.9%). In this tissue, the percentage of
Sox2"Tis21þprogeny progresses only slightly (from 7.8 ± 1.2 to 11.3 ± 1%,Figure 5F). This
observa-tion indicates that CDC25B gain-of-funcobserva-tion in early steps of neurogenesis reduces proliferative Sox2þTis21" progeny and increases Sox2þTis21þ neurogenic progeny. In the ventral neural tube,
CDC25B gain-of-function induces a massive reduction in Sox2þTis21" progeny (from 29.3 #1.3% to
6.9 # 1%) and leads to an increase in Sox2"Tis21þprogeny (from 12.7 #1.1% to 40.7 # 2.7%),
with-out significantly modifying the percentage of Sox2þTis21þ progeny (from 58 #2% to 52.3 # 2.8%,
Figure 5F). Thus, CDC25B ectopic expression in a more advanced neural tissue reduces proliferative divisions and increases Sox2"Tis21þneurogenic progeny.
Together, these results suggest that CDC25B activity in neural progenitors reduces proliferative divisions and promotes neurogenic divisions, depending on the receiving neural tissue.
Mathematical modelling reveals that cell cycle duration is not
instrumental in controlling the mode of division
To test quantitatively data from a dynamical point of view (Mı´guez, 2015; Saade et al., 2013 ; Appendix Neurogenic decisions require a cell cycle independent function of the CDC25B phospha-tase), we formalized in mathematical terms our current understanding of what happens in this bio-logical system (Figure 6A). Despite the fact that a fraction of the Sox2þTis21þ cells might
correspond to NN rather than PN divisions, in the modeling part below, we assumed that the Sox2/ Tis21 reporter expression is indicative of PP, PN and NN as described in (Saade et al., 2013).
We consider a population of progenitors at time t0, Pðt0Þ, and we assumed that their different
modes of division result in expanding either the pool of progenitors PðtÞ through proliferative divi-sions (PP dividivi-sions), or the pool of neurons NðtÞ by neurogenic dividivi-sions (PN and NN dividivi-sions). Denoting h the rate at which P cells undergo divisions per unit time (which depends only on the cell cycle duration), the growth rates of the two pools only depend on the relative magnitude of each mode of division.
Denoting app, apnand annthe corresponding proportions of the modes of division (their sum is 1),
the growth rates of the two pools (i.e. their time derivatives _PðtÞ and _NðtÞ for Progenitors and Neu-rons respectively) can then be directly formalized as:
_PðtÞ ¼ "hPðtÞ þ2apphPðtÞ þ 1apnhPðtÞ
_
NðtÞ ¼ þ2annhPðtÞ þ 1apnhPðtÞ
(
(1) In this model, the evolution of the pool of progenitors is governed by app and ann (because apn
does not affect the pool of progenitors, only the pool of neurons). Denoting g ¼ app" annthe
differ-ence between the two proportions, we then have g ¼ 1 when app¼ 1, ann¼ 0, corresponding to
purely self-expanding progenitors and g ¼ "1 when app¼ 0, ann¼ 1, corresponding to fully
self-con-suming progenitors. Hence g is a good indicator of the balance between proliferation and differenti-ation of the progenitors (Mı´guez, 2015). Using g, the model can be rewritten more simply as:
_PðtÞ ¼ ghPðtÞ _
NðtÞ ¼ ð1 " gÞhPðtÞ (
An explicit solution, for g 6¼ 0, is:
PðtÞ ¼ Pð0Þeght
NðtÞ ¼ Nð0Þ þ Pð0Þ1"gg ðehgt" 1Þ
(
(3) This equation means that if the quantities of progenitors and neurons are determined at a given time (Pð0Þ, Nð0Þ), for example at HH17, we can compute the expected number of progenitors and neurons at any time later, for example at HH22, provided that the modes of division and cell cycle
Figure 7. CDC25B gain-of-function promotes neurogenesis independently of CDK interaction. (A) Curves representing the percentage of electroporated GFPþEdUþPH3þover the total GFPþEdUþcells with increasing
EdU exposure times: control (black), CDC25BDCDK(red). Note that the curve for the CDC25BDCDKcondition is
similar to the control, indicating an absence of effect on G2 length. (B) Box plots (5/95 percentile) comparing the percentage of progenitors expressing Sox2::GFP and Tis21::RFP 24 hr after co-electroporation with control or CDC25BDCDKvectors in the entire spinal cord. Data represent the means # SEM of 3 different experiments with 6
control and 6 CDC25BDCDKgain-of-function embryos. (C) Box plots (5/95 percentile) comparing the percentage of
two cell clones expressing Nucbow and pCX CRE vectors, 40 hr after co-electroporation with control or CDC25BDCDKvectors in the entire spinal cord. Data represent the means # SEM of 3 different experiments with
387 clones in 12 control embryos, and 692 clones in 10 CDC25BDCDKgain-of-function embryos. (D) Bar plot
representing the percentage of cells expressing Sox2::GFP and Tis21::RFP 24 hr after co-electroporation with control or CDC25BDCDKvectors, in the dorsal or ventral spinal cord. Data represent the means # SEM. Data
represent three different experiments with a total of 5 dorsal and 10 ventral neural tubes under control conditions, and 4 dorsal and 9 ventral neural tubes in CDC25BDCDKgain-of-function. (E) Box plots (5/95 percentile) comparing
the percentage of HuC/Dþcells within the electroporated population in control or CDC25BDCDKgain-of-function
experiments, in the dorsal or ventral neural tube at HH22. Data represent three different experiments with 13 dorsal and 6 ventral neural tubes in the control and 6 dorsal and 3 ventral neural tubes in the CDC25BDCDK
gain-of-function. (F) Box plots (5/95 percentile) comparing the percentage of Pax2þcells in the dorsal neural tube at
HH22. Data from three different experiments with 8 control embryos, and 11 CDC25BDCDKgain-of-function
embryos. (G) Bar plot representing the percentage of progenitors expressing Sox2::GFP and Tis21::RFP at HH17, 24 hr after electroporation of a control or CDC25BDPDCDKexpressing vector in the dorsal half of the spinal cord.
Data from three different experiments with 6 control embryos, and 9 CDC25BDPDCDKembryos. (H) Box plots (5/95
percentile) comparing the percentage of Sox2þor HuC/Dþcells within the electroporated population in the
control or CDC25BDPDCDKgain-of-function experiments, in the dorsal spinal cord at HH17. Data from three
times can be considered constant over the considered period. Full details of the mathematical work and statistics are given in Appendix 2. We then compare quantitatively the experimental data to the predictions based on our current hypotheses. This comparison is surprisingly auspicious for the con-trol and gain-of-function experiments in the ventral zone (Figure 6C, left). In this zone, considering the ratio between the two pools at HH17 (e.g. the measured fractions of neurons), the measured cell cycle duration (12 hr), the set of modes of division measured at HH17, and the hypothesis that those modes of divisions stay unmodified during 24 hr, the model predicts with good accuracy the ratios between the two pools at HH22. In the dorsal zone, the model correctly predicts the control condi-tion, and it confirms the tendency of CDC25B gain-of-function to promote a greater neuron fraccondi-tion, albeit with some quantitative discrepancy (the model overestimates the fraction of neurons). This suggests that, notwithstanding biological complexity, the general picture of a pool of progenitors among which cells undergo stochastic modes of division, appears relevant.
Our model is built on the assumption that all cells undergo asynchronous mitosis at the same rate, and that the fate of any mitosis is stochastic and probabilistically distributed according to the fraction of dividing cells undergoing PP, PN or NN divisions, namely a common division rate for all progenitors associated with probabilistic fates (Appendix 3). In this picture, the proportion of mode of division controls directly the numbers of progenitors and neurons that are generated. However, the model is compatible with an extreme alternative interpretation, in which the three modes of divi-sion correspond to specific dividivi-sion rates associated with deterministic fates (Appendix 3). In this case, each population of progenitors has a specific mean cycling time and the cell cycle time is instrumental to the mode of division. Namely, cycling at rate apph would result in a PP division,
cycling at rate apnhwould result in a PN division, and cycling at rate annhwould result in a NN
divi-sion. Therefore, the numbers and proportions of progenitors/neurons at HH22 would result from the difference between cell cycle times associated with modes of division. We compute these putative cell cycle times based on the data obtained in the three conditions and the two zones (Table 1). The wide range of specific cycle times, that is, from 17 to 172.7 hr, is incompatible with data usually recorded (reviewed in Molina and Pituello, 2017). This suggests that, in the time window of our analyses, the observed evolution of progenitors and neurons cannot be exhaustively explained by pure differences in cell cycle durations among the three modes of division.
CDC25B promotes neurogenesis independently of CDK interaction
One prediction of our model is that neurogenesis might be affected independently of cell cycle length modification. To test whether the CDC25B-induced G2 phase modification is instrumental in promoting neurogenesis, we use a mutated form of CDC25B that was shown not to affect cell cycle kinetics. The mutation prevents CDC25B-CDK1 interactions without affecting CDC25B phosphatase activity (Sohn et al., 2004). Accordingly, expressing this mutated form of the phosphatase called CDC25BDCDK, does not modify G2 phase length in neuroepithelial progenitors (Figure 7A, red
curve). The effects of CDC25BDCDK on the division mode are then compared in the entire
neuroepi-thelium using the Tis21/Sox2 approach, 24 hr after electroporation, and the Nucbow technique, 40 hr after electroporation.
In the Tis21/Sox2 strategy, CDC25BDCDKdecreases Sox2þTis21"progeny (from 46.1 #2.1% to 28
# 1.6%) and increases Sox2þTis21þ progeny (from 43.4 #1.9% to 61.2 # 1.5%). The percentage of
Sox2"Tis21þ progeny is not modified in that experimental context (from 10.5 #0.8% to 10.8 #
0.8%,Figure 7B). These data show that CDC25BDCDKgain of function reduces proliferative divisions
from 46.1 ± 2.1% to 28 ± 1.6% and increases neurogenic divisions from 53.8 ± 2.1% to 72 ± 1.6% (P-value < 0,0001). Analyzes using the Nucbow strategy, show a decrease in HuC/D"-HuC/D" cells
(from 76.5 ± 2.6% to 61 ± 2.4%), an increase in HuC/D"-HuC/Dþ cells (from 9.4 ± 1.5% to 17.1 ±
2.5%) and in HuC/Dþ-HuC/Dþ cells (from 14.1 ± 2.3% to 21.9 ± 2.1%, Figure 7C) following
CDC25BDCDK expression. Therefore, CDC25BDCDK gain of function reduces proliferative divisions
Figure 7 continued
different experiments with 11 control embryos, and 6 CDC25BDPDCDKembryos. The cross indicates the mean
value.
from 76.5 ± 2.6% to 61 ± 2.4% and increases neurogenic divisions from 23.8 ± 2.5% to 39 ± 2.4% (P value < 0,001). CDC25BDCDKgain-of-function results in an equivalent reduction of 15.8 and 18.1
per-centage-point for proliferative and a corollary increase in neurogenic divisions in the Nucbow and Sox2/Tis21 strategies respectively (Figure 7B,C).
Together these data show that a mutated form of CDC25B unable to interact with CDKs, still pro-motes neurogenic divisions.
We then analyze the effects of CDC25BDCDK on the dorsal and ventral progenitors 24 hr after
electroporation. CDC25BDCDKgain-of-function in the dorsal neural tube, reduces Sox2þTis21"
prog-eny (from 66.3 #2.7% to 40.2 # 2.5%), increases Sox2þTis21þprogeny (from 25.9 #2.1% to 51.1 #
2.2%), and has no effect in Sox2"Tis21þprogeny (from 7.8 #1.2% to 8.0 # 1.1%,Figure 7D). In this
context, the fraction of HuC/Dþ neurons generated 40 hr following CDC25BDCDK expression
increases from 30.7 # 1.3% to 40.4 # 2.5%. (Figure 7E). Similarly, the percentage of Pax2+ neurons is increased from 11.3 # 1% to 18.3 # 1.3% (Figure 7F). In the ventral neural tube, CDC25BDCDK
overexpression leads to a reduction in Sox2þTis21" progeny (29.3 #2.1% vs 16.6 # 1.2%), an
increase in Sox2þTis21þ progeny (58 # 2% vs 70.7 # 1.4%) and no effect on Sox2"Tis21þ progeny
(12.7 # 1.1% vs 12.7 # 1.1%,Figure 7D). In the ventral neural tube, CDC25BDCDK induces a slight
but non-significant increase in HuC/D expression (Figure 7E). We examined our mathematical model to determine whether this slight increase in neuron production is coherent with the fact that the mutated form does not promote Sox2"Tis21þ progeny, and the number of neurons predicted is in
agreement with the experimental data (Figure 6C).
To determine whether CDC25BDCDKfunction on neurogenic divisions and neuronal differentiation
requires phosphatase activity, we use a form of the protein containing an additional point mutation inactivating the catalytic domain (CDC25BDP DCDK). This construct does not affect the mode of
divi-sion at 24 hr (Figure 7G). 48 hr post electroporation this mutated form does not modify NeuroD reporter expression (Figure 2—figure supplement 2), the percentage of HuC/D + neurons or the percentage of Sox2+ progenitor’s populations (Figure 7H), indicating that the phosphatase activity is required for the neurogenic function of CDC25B.
Altogether, these results show that CDC25BDCDK stimulates neurogenic divisions and neuronal
differentiation without affecting the duration of the G2 phase. This opens the possibility that the phosphatase possesses a function in addition to its canonical role in cell cycle regulation.
Table 1. Putative time it would take to achieve the three kinds of division under a model which assumes that only cycle time determines the fate output.
Full consequences derived from this assumption are given in Appendix 3. Basically, such an assump-tion implies that cycling rates associated with each mode of division are proporassump-tional to the observed fraction of that mode. If we observe, for instance, 60% PP-divisions and 10% NN-divisions (like it is in the Control dorsal), then a NN-division should take six times as long as a PP-division. If we exclude such a possibility, then fate distribution cannot be exclusively determined by differences in fate-based cycle times. It does not exclude that a given kind of fate (e.g. proliferative divisions PP) could require a longer time to be achieved than others; it excludes that such differences would suffice per se to explain the differences between the fractions of fates.
Zone and condition Tpp(hours) Tpn(hours) Tnn(hours) Tc(hours)
Control dorsal neural tube 18.1 46.3 154.1 12.0
CDC25B dorsal neural tube 31.1 23.9 106.0 12.0
CDC25BDCDKdorsal neural tube 29.8 23.5 150.0 12.1
Control ventral neural tube 41.0 20.7 94.5 12.0
CDC25B ventral neural tube 172.7 22.9 29.5 12.0
CDC25BDCDKventral neural tube 72.2 17.0 94.7 12.0
CDC25B promotes fast nuclei apical departure in early G1
independently of CDK interaction
To go further in our understanding of this cell cycle independent role of CDC25B, we set up a high resolution time-lapse imaging technique that allows real-time tracking of the behaviour of single neural progenitor nuclei during G2/M/G1 phases. To perform live imaging, E2 embryo neural tubes are electroporated with a GFP-tagged version of PCNA (Leonhardt et al., 2000), then slice cultures of neural tube explants are performed 6 hr after electroporation and analyzed in live experiments starting 12 hr later. Using this approach, nuclear movements are tracked in time and space during G2, M and G1 phase (Figure 8). As previously described (Spear and Erickson, 2012), we observe that mitosis initiates away from the apical side and gets completed against the lumen (Figure 8A–B). Interestingly, nuclei in G1 display two types of behaviours: either a newly formed nucleus remains close to the lumen (Ap) or it rapidly migrates away from the apical side towards the basal side (Bs), giving rise to three mitotic patterns Ap/Ap, Ap/Bs, Bs/Bs (Figure 8A–C and Video 1, Video 2,
Video 3). Based on the position of the nuclei 20 min after mitosis (Bs being defined as more than 10 mm away from the apical side at that time), the occurrences of their behaviour were quantified in control and gain-of-function conditions (Figure 8D). Under control conditions, Ap represents 50.6 #6.9% of the post mitotic behavior, and Bs 49.4 #6,9%. CDC25B and CDC25BDCDKgain-of-function
decrease Ap (to 24.1 #5.3% and 30.9 # 4.5%, respectively) and increase Bs (to 75.8 #5.3% and 69.1 # 4.5%, respectively).
It is possible that the Bs migratory behavior precedes the apical process withdrawal associated with the onset of neuronal differentiation (Das and Storey, 2014; Tozer et al., 2017). We took advantage of our time-lapse set up to identify cells re-entering S phase, by the appearance of a dot-like staining within the nuclei corresponding to the recruitment of PCNA into the DNA replication foci (Figure 8—figure supplement 1,Leonhardt et al., 2000). For all the nuclei whose cell cycle sta-tus was identified (Table 2), we quantify 9/16, 32/37 and 40/40 Bs nuclei re-entering S phase in Con-trol, CDC25B and CDC25BDCDKgain-of-function, respectively. A majority of Ap nuclei also re-enter S
phase in control (30/36), CDC25B (15/21) and CDC25BDCDK (16/20) gain-of-function experiments
(Table 2). Thus, a majority of Bs and Ap nuclei re-enter S phase in gain-of-function experiments sug-gesting that the change in migratory behavior is not the consequence of a neurogenic division and of neuronal commitment, but either is upstream or is independent of it.
To analyze more profoundly how CDC25B activity affects nuclei migration in G1, we determined the nuclei motion using a statistical measure of the average distance a nucleus travels over time: the mean squared displacement, MSD (Norden et al., 2009). We calculated MSD profiles for the Ap and Bs nuclei under control, CDC25B and CDC25BDCDK gain-of-function conditions (Figure 8E). In
both cases, the profile clearly exhibits 2 types of motion: Ap nuclei displaying slow motion (diffusion) and Bs nuclei exhibiting directed movements (advection). In addition, we determined the average speed of the nuclei over the first 20 min after mitosis (Figure 8F). We observed speeds of 0.26 #0.03 mm/min (n = 16), 0.27 # 0,03 mm/min (n = 17) and 0.27 # 0,04 mm/min (n = 11) for the Ap nuclei and 1.10 #0.17 mm/min (n = 14), 0.98 # 0.1 mm/min (n = 25) of and 0.80 # 0.1 mm/min (n = 19) for Bs nuclei in control, CDC25B and CDC25BDCDK, respectively.
Together these data suggest that the non-cell cycle dependent activity of CDC25B does not modify much the departure speed of the nuclei, but rather controls the switch from slow to fast nuclei departures from the apical surface.
Altogether, these results show that in the neuroepithelium, the CDC25B phosphatase affects early G1 nuclear behavior, and also is necessary and sufficient to promote neurogenic divisions and neurogenesis. Importantly, CDC25BDCDKwithout affecting the duration of the G2 phase, still affects
early G1 nuclear behavior and stimulates neurogenic divisions and neuronal differentiation. Our results open then the possibility that the phosphatase possesses cell cycle independent and neuro-genic functions.
Discussion
An important issue in the field of neurogenesis concerns the implication of cell cycle function during neuron production (Agius et al., 2015). Here, we confirm in mammals our previous observations in birds, that the G2/M cell cycle regulator CDC25B phosphatase is required to finely tune neuronal
Figure 8. CDC25B affects G1 nuclei movement independently of CDK interaction. (A) Time-lapse series of the different daughter cell nuclear behaviors. Yellow dashed lines indicate the lumen; grey dashed lines represent 10% of the apico-basal length. Scale bars: 10 mm. (B) Quantitative tracking of nuclear movement in embryonic chicken neural tube. Daughter cell nuclei can display three different behaviors after cytokinesis: both nuclei migrate immediately after mitosis (Bs/Bs) (upper panel); one of the nuclei remains at the apical side and the sister nucleus migrates to the basal side (Ap/Bs) (middle panel) or both nuclei remain at the apical side for at least 20 min before starting basal migration (Ap/Ap) (lower panel). Nuclei were labelled by NLS-EGFP-L2-PCNA (Leonhardt et al., 2000) that allows the distinction between G2/M/G1 phases, and their movements were tracked by time-lapse microscopy and Imaris software. The end of mitosis (cytokinesis) showed the most apical localization and was defined as zero. Cell cycle phases (S, G2, M, G1) are indicated above the tracks. (C) Scheme representing nuclear behavior during G1. (D) Quantification of the repartition of post mitotic behavior, that is, Ap or Bs positioning after mitosis in WT, CDC25B and CDC25BDCDKgain-of-function. 156, 174 and 212 cells in 16, 9 and 20 explants of 10, 5
and 8 experiments in WT, CDC25B and CDC25BDCDKgain-of-function, respectively. (E) Mean squared
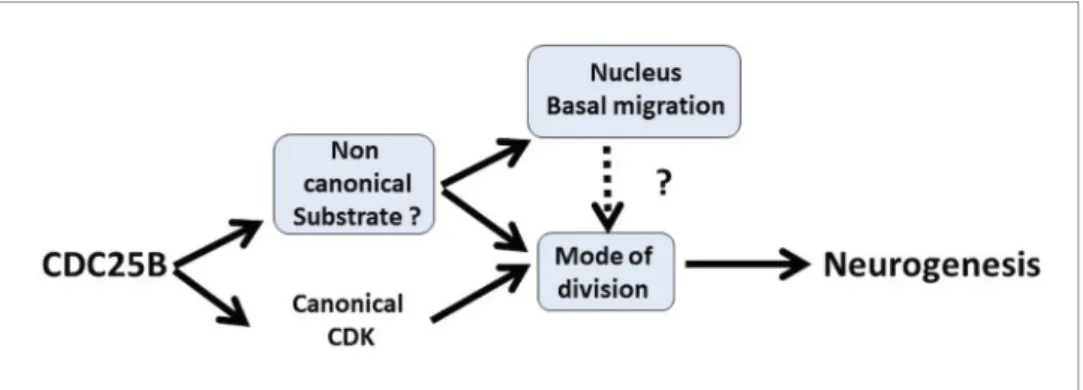
production in the neural tube. Gain-of-function experiments performed in the chick neural tube reveal that CDC25B activity is sufficient to modify the mode of division of neural progenitors and to promote neuronal differentiation concomitantly with a shortening of the G2 phase length. We dem-onstrate that CDC25B expression in neural progenitors induces a shift from proliferative to neuro-genic divisions and promotes neuronal differentiation independently of any CDK interaction, indicating that it involves a new substrate of the phosphatase (Figure 9). Finally, analyses in real time of INM reveal that wild type CDC25B and mutated CDC25BDCDKproteins increase the number
of nuclei performing fast basalward movement in early G1, giving us a track to follow in order to elu-cidate the non-cell cycle function of CDC25B.
CDC25B is required for efficient
neuron production in vertebrates
In mammals three CDC25s (A, B, C) have been characterized, whereas only two CDC25s (A and B) have been found in chicken (Agius et al., 2015). In mouse, Cdc25a loss-of-function is embryonic lethal, whereas loss-of-function of Cdc25b or Cdc25c or both has no apparent phe-notype except female sterility (Boutros et al., 2007). Crossing our floxed mice to ubiquitous Cre:PGK-Crem(Lallemand et al., 1998) also
results in female sterility (data not shown). Cdc25a has been described as playing a major role in the G1-S transition and is capable of com-pensating the loss-of-function of the other Cdc25 members. In the mouse embryonic neural tube, both Cdc25a and Cdc25c display a broad expres-sion pattern, while Cdc25b is mainly expressed in
domains where neurogenesis occurs
(Agius et al., 2015 and Figure 1). The condi-tional loss-of-function in the mouse CNS, shows for the first time that Cdc25b is involved simulta-neously in the control of G2 phase length and spinal neurogenesis. In the mouse, at least part of the reduction in the number of neurons is probably due to the slight reduction in progeni-tor population. This observation substantiates our data showing that CDC25B downregulation, per-formed using RNAi in chicken embryo, induces a reduction in neurogenesis (Peco et al., 2012). Two other studies link CDC25B and neurogene-sis. First in Xenopus, FoxM1 and CDC25B loss-of-function has been shown to reduce expression of Figure 8 continued
displacement (MSD) profile (error bars show 95% confidence interval) of Ap nuclei (green line) and Bs nuclei (red line) in the control, CDC25B and CDC25BDCDKgain-of-function. Under all conditions, Ap nuclei display slow
motion (linear trend), while Bs nuclei display a persistent apico-basal motion (parabolic trend). (F) Box plots (5/95 percentile) comparing the mean speed over the first 20 min post mitosis of Ap and Bs nuclei. Number of nuclei tracked are 16, 17, and 11 Ap nuclei, and 14, 25, and 19 Bs nuclei, in control and CDC25B and CDC25BDCDK
gain-of-function, respectively for E and F. DOI: https://doi.org/10.7554/eLife.32937.013
The following figure supplement is available for figure 8:
Figure supplement 1. Time-lapse series of neural progenitor cell electroporated with GFP-PCNA. DOI: https://doi.org/10.7554/eLife.32937.014
Video 1. Time-lapse imaging of neural tube daughter nuclei performing apical movements (Ap/Ap). Mother and daughter cells expressing GFP-PCNA can be followed over time and interkinetic nuclear movement of cells is observed. Images were taken every 5 min at 63X magnification and are played at 12 frames per second (fps).
Video 2. Time-lapse imaging of neural tube daughter nuclei performing apical and basal movements (Ap/Bs). Mother and daughter cells expressing GFP-PCNA can be followed over time and interkinetic nuclear movement of cells is observed. Images were taken every 5 min at 63X magnification and are played at 12 fps.
DOI: https://doi.org/10.7554/eLife.32937.016
Video 3. Time-lapse imaging of neural tube daughter nuclei performing basal movements (Bs/Bs). Mother and daughter cells expressing GFP-PCNA can be followed over time and interkinetic nuclear movement of cells is observed. Images were taken every 5 min at 63X magnification and are played at 12 fps.
DOI: https://doi.org/10.7554/eLife.32937.017
Table 2. Distribution of post-mitotic Basal and Apical nuclei performing a new cell division (S-phase) or remaining in G1-phase (Long G1).
n: number of cells counted. S-Phase: cell that re-enters S phase during the time lapse. Long G1: cell that performs a G1 longer that 10 h hours and that does not re-enter S phase during the time lapse. ND: not determined because the time lapse conditions did not allow to follow the cell long enough.
S-phase Long G1 ND Total
n % n % n % n Basal WT 9 11.8 7 9.2 60 79.0 76 CDC25B 32 25.6 5 4.0 88 70.4 125 CDC25BDCDK 40 27.2 0 0.0 107 72.8 147 Apical WT 30 37.5 6 7.5 44 55.0 80 CDC25B 15 30.6 6 12.3 28 57.1 49 CDC25BDCDK 16 24.6 4 6.2 45 69.2 65 DOI: https://doi.org/10.7554/eLife.32937.018
neuronal differentiation markers, but not early neuroectoderm markers (Ueno et al., 2008). In this context, epistasic analysis shows that FoxM1 loss-of-function can be rescued by CDC25B gain-of-function (Ueno et al., 2008). Second, MCPH1 knock out mice display a microcephalic phenotype due to an alteration of the Chk1-Cdc25-Cdk1 pathway. Indeed, MCPH1 mutants display a decreased level of the inhibitory Chk1 kinase localized to centrosomes, leading to increased Cdc25b and Cdk1 activities. A premature activation of Cdk1 leads to an asynchrony between mitotic entry and centro-some cycle. This disturbs mitotic spindle alignment, promoting oblique orientation and precocious neurogenic asymmetric divisions (Gruber et al., 2011). Moreover, the reduced neurogenic produc-tion in the MCPH1 loss-of-funcproduc-tion can be restored by a concomitant Cdc25B loss-of-funcproduc-tion, dem-onstrating the phosphatase’s pivotal role in the neurogenic phenotype. Altogether, these observations indicate that Cdc25b activity is broadly used during nervous system development among vertebrate species.
CDC25B promotes neurogenic divisions independently of CDK
interaction
CDC25B downregulation reduces the transition from proliferative to neurogenic divisions. To be able to clarify the role of CDC25B on both types of division, we use the cell cycle cis-regulatory ele-ment combined with the rapid degradation of CDC25B at the end of M phase, to reproduce the endogenous cyclic expression of the phosphatase (Ko¨rner et al., 2001). Using Sox2/Tis21 bio-markers and Nucbow clonal analyses, we observe differences in the repartition of the mode of divi-sion, probably due to intrinsic methodological differences. This discrepancy may be linked to the differences in the method used: one possibility being that one analysis is performed at 24 hr after electroporation, while the other is performed 40 hr after. Nevertheless, CDC25B gain-of-function reduces proliferative and promotes neurogenic divisions independently of the method used. Gain-of-function of the CDC25B mutated form inactive during the cell cycle, also diminishes proliferative divisions. Using the Sox2/Tis21 biomarkers, we observe different results depending on the popula-tion of progenitors targeted.
In the dorsal neural tube, CDC25B gain-of-function increases Sox2þTis21þ compared to control
conditions. In the ventral neural tube, gain-of-function leads to an increase in Sox2"Tis21þ, the
per-centage of Sox2þTis21þ progeny being unchanged. We propose that ectopic expression of the
phosphatase can be interpreted in different ways depending on the context: CDC25B would have the capacity to convert Sox2þTis21" into Sox2þTis21þ in a young tissue, while in an older tissue
CDC25B could convert Sox2þTis21" into either Sox2þTis21þ or Sox2"Tis21þ. With respect to what
occurs in an older tissue, either the phosphatase converts Sox2þTis21" into Sox2þTis21þ or
Sox2"Tis21þ, or the phosphatase initially promotes Sox2þTis21" into Sox2þTis21þ and
Figure 9. Schematic of CDC25B modes of action. CDC25B activity on an unknown substrate changes G1 nucleus basalward movement during Interkinetic Nuclear Migration (INM), and also acts on the mode of division leading to increased neurogenesis. It remains to be determined whether a link exists between these two activities. In addition to this new pathway, the data obtained in mice and using the Tis21/Sox2 assay suggest that the activity of CDC25B on CDK might account for part of its activity on the mode of division and neurogenesis. DOI: https://doi.org/10.7554/eLife.32937.019