Ž .
Journal of Marine Systems 19 1999 251–266
Daily and seasonal variations of the partial pressure of CO in
2surface seawater along Belgian and southern Dutch coastal areas
A.V. Borges
), M. Frankignoulle
( )
UniÕersite de Liege, Mecanique des Fluides Geophysiques, Unite d’Oceanographie Chimique, Institut de Physique B5 , B4000 Sart Tilman,´ ` ´ ´ ´ ´
Belgium
Received 5 January 1998; accepted 19 August 1998
Abstract
Ž .
The variations of the partial pressure of CO2 pCO2 and related parameters were determined in surface seawater along the Belgian coast, from January 1995 to June 1996, at both daily and seasonal time scales. The distribution of pCO in this2
area is regulated by river input from the Scheldt, biological activity and hydrodynamics. The contribution of each of these
Ž .
processes varies as a function of the considered time scale: i the daily variation of pCO depends on the tide although2
Ž .
modulated by the biological diel cycle; ii the seasonal variation of pCO depends on the input from the Scheldt and the2
seasonal variations of phytoplanktonic biomass. During winter, the plume of the river Scheldt is oversaturated in pCO with2 respect to the atmosphere. During spring and summer, phytoplankton blooms occur both in the lower Scheldt estuary and in the river plume and may lead to undersaturation of pCO2 in the easternmost area of the river plume. However, the degradation of phytoplankton induces oversaturation of pCO , in the westernmost area of the plume. Furthermore, the2
inter-annual variation of pCO depends partly on the fluctuations of the discharge of the Scheldt. Our preliminary results2 strongly suggest that, on an annual basis, the Scheldt plume behaves as a net source of CO to the atmosphere. q 19992
Elsevier Science B.V. All rights reserved.
Keywords: pCO ; Belgian and Dutch coasts; Scheldt river plume; daily and seasonal variations2
1. Introduction
The lack of in situ measurements of inorganic carbon in continental shelf seas is at the base of the controversy concerning their role in the global car-bon cycle. The estimations of the exchange of CO2
across the air–sea interface are in these regions mostly based on calculations and they yield from one
Ž
author to another opposite conclusions Walsh, 1991;
.
Smith and Hollibaugh, 1993 . Continental shelf seas
)
Corresponding author. Fax: q32-4-3662355; E-mail: alberto.borges@ulg.ac.be
are complex systems characterized by a wide range of specific processes such as: upwelling, tidal fronts, river inputs, exchange with sediments and intense
Ž
biological processes Walsh, 1988; Mackenzie, 1991;
.
Wollast, 1991 . Large deviations in the partial pres-sure of CO2 from the atmospheric equilibrium are expected to occur from these processes, which can furthermore have antagonistic effects. For instance, rivers and upwelling bring to the shelf significant quantities of inorganic carbon, inducing oversatura-tion of pCO with respect to the atmosphere. Also,2
rivers bring organic carbon that will be reminer-alised. On another hand, upwelling and rivers also 0924-7963r99r$ - see front matter q 1999 Elsevier Science B.V. All rights reserved.
Ž .
bring large quantities of nutrients that favour primary production, which is also enhanced by physical struc-tures such as tidal and river plume fronts and induce undersaturation of the partial pressure of CO2 ŽpCO2. with respect to the atmosphere. To clarify the role of continental shelf seas in the global carbon cycle, more field data of CO air–sea fluxes are then2
Ž
needed Mackenzie, 1991; Sarmiento and Sundquist,
.
1992 . One approach is to measure pCO in surface2 seawater, with an adequate spatial and temporal reso-lution to meet the small scale variations of pCO .2
The net CO air–sea flux can then be estimated from2
the measurements of pCO , salinity, water tempera-2 Ž
ture and wind speed Liss and Merlivat, 1986;
Wan-.
ninkhof, 1992 .
Ž .
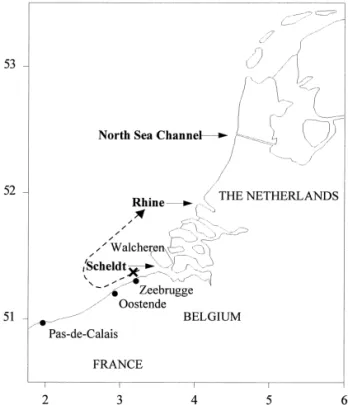
The Belgian and Dutch coasts Fig. 1 have been intensely studied from the physical, chemical and biological point of views but pCO2 data are very sparse. The main features of these regions are the fresh water inputs from the river Scheldt, the river
Ž
Rhine and the North Sea Channel Southern
IJs-.
selmeer . Along the Belgian coast, the only set of pCO2 data available so far has been reported by
Fig. 1. Map showing the study site. The direction of the residual current along the Belgium coast is schematized by a dotted arrow. The position of the Zeebrugge Station is indicated by a cross.
Ž .
Frankignoulle et al. 1996a,b,c and values are be-tween 115 and 665 matm. Along the Dutch coast,
Ž
pCO data have been reported by Hoppema 1991,2
. Ž .
1993 , Kempe and Pegler 1991 and Bakker et al.
Ž1996 and values range between 200 and 800 matm..
These authors concluded that in both regions the distribution of pCO is controlled by the fresh water2
Ž
inputs and by biological activity photosynthesis and
.
mineralisation of organic matter . Yet, more field data are needed to further clarify the seasonal varia-tions of pCO2 and classify the Belgian and Dutch coastal regions, in the sourcersink context. To as-sess these issues we have performed a seasonal monitoring of pCO2 in surface seawater of these areas.
2. Material and methods
Data presented in this paper were obtained in 1996, on board the R.V. Belgica, during eight cruises:
Ž .
30 January–2 February Belgica cruise 96r01 , 6–9
Ž .
February Belgica cruise 96r02 , 22–29 February
ŽBelgica cruise 96r04 , 4–8 March Belgica cruise. Ž
. Ž .
96r05 , 18–29 March Belgica cruise 96r07 , 15–26
Ž . Ž
April Belgica cruise 96r11 , 20–24 May Belgica
. Ž .
cruise 96r12 and 3–14 June Belgica cruise 96r14 . A reference station was selected off Zeebrugge, where samples were collected at the start and the end of all the cruises carried out by the University of
Ž
Liege on board the R.V. Belgica results are avail-
`
.able since early 1995 .
Ž w
.
An IR spectrophotometer LI-COR , LI-6252 is used to measure pCO2 in dry air which is equili-brated with seawater. The LI-CORw
spectrophotom-eter is calibrated using two gas standards of 0 and
Ž .
350 "1 matm, from Air Liquide Belgium. The
Ž
equilibrator consists of a Plexiglas cylinder height:
.
80 cm, diameter: 10 cm filled with marbles to
Ž
increase the exchange surface area. Seawater runs 3
y1
.
l min from the top to the bottom of the
equilibra-Ž y1. Ž
tor and air is pumped upwards 3 l min for
.
further details: Frankignoulle et al., submitted . The pCO values are corrected for the temperature differ-2
ence between in situ seawater and water in the equilibrator, using the algorithm proposed by
Ž .
( )
A.V. Borges, M. Frankignouller Journal of Marine Systems 19 1999 251–266 253
The measurement of pH is obtained using a Ross
Ž w
.
combination electrode ORION , calibrated on the total proton scale, using the TRIS and AMP buffers
Ž .
proposed by Dickson 1993 . The reproducibility of pH measurement is estimated to be 0.004 pH units.
Ž .
Total Alkalinity TAlk is determined using the clas-sical Gran electro-titration method, on 100 ml GFrC filtered samples. The reproducibility of TAlk mea-surements performed on board is 4 meq kgy1
. The pCO data computed from pH and TAlk are calcu-2 lated using the CO acidity and borate acidity con-2
Ž .
stants from Roy et al. 1993 , the CO2 solubility
Ž .
coefficient from Weiss 1974 and the borate
molal-Ž .
ity obtained from the Culkin 1965 ratio to salinity. The error on the pCO calculation is estimated to be2
less than 8 matm.
Dissolved oxygen is measured using a
polaro-Ž w
.
graphic electrode ORBISPHERE , calibrated ev-ery 12 h, from discrete samples, using the Winkler method. The O saturation level is calculated using2 Ž .
the algorithm proposed by Benson and Krause 1984 . Salinity and temperature are measured using a SEABIRDw
thermosalinograph. Chlorophyll a and phaeopigments concentrations are measured, using the spectrophotometer method described by
Loren-Ž .
zen and Jeffrey 1978 .
Ž
Underway parameters pCO , pH, dissolved O ,2 2 .
salinity, temperature were measured with a sam-pling frequency of 1 min, using a fully computerised acquisition system, connected to the non-toxic
sea-Ž
water supply of the ship pump inlet at a depth of
.
y2 m . Samples for TAlk, chlorophyll a and
phaeopigments concentrations were collected with a frequency of 3 h. The isopleth charts were obtained using SURFERw
6.0 package with the Kriging inter-polation method. The tide was calculated using the WORLDTIDEe package.
3. Results and discussion
3.1. Seasonal Õariation of pCO2 at the Zeebrugge station
To describe the seasonal variability in the Belgian coastal area of pCO and its controlling factors, the2
monitoring of pCO2 and related parameters was
started, in 1995, at a reference station off Zeebrugge
Ž3.188E, 51.378N , situated in the Scheldt plume..
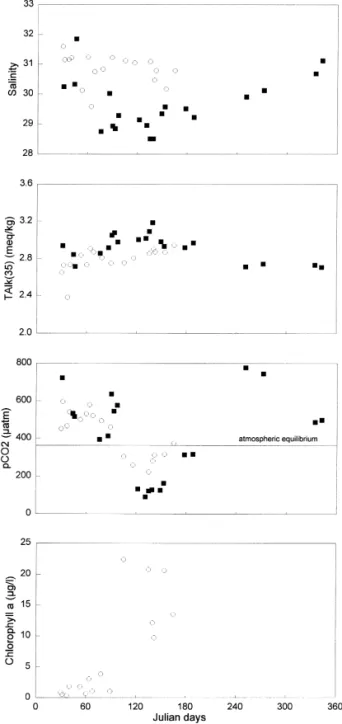
Fig. 2 shows that salinity at the Zeebrugge Station
Ž .
is low mean value of 29.5 in 1995 and 30.9 in 1996
Ž
and normalised alkalinity i.e., TAlk normalised to a
Ž .. Ž
salinity of 35, abbreviated TAlk 35 is high
aver-Ž . Ž . Ž
Fig. 2. Variations of pCO2 matm , salinity, TAlk 35 meq
y1. Ž y1.
kg and chlorophyll a concentration mg l , at the Zeebrugge
Ž . Ž .
Station 3.188E, 51.378N in 1995 black squares and early 1996
age values of 2.9 meq kgy1
in 1995 and 2.8 meq
y1 .
kg in 1996 . These two parameters show only slight seasonal variations, so the Zeebrugge Station is, all year round, under the influence of the Scheldt water, characterised by Total Alkalinity higher than
Ž Ž .
the average value for seawater TAlk 35 ; 2.3 meq kgy1
, Hoppema, 1990; Frankignoulle et al.,
.
1996a,b,c . During winter, the highest observed pCO value was 722 matm in 1995 and 596 matm in2 1996. This corresponds to an oversaturation of pCO2
of 200% and 165%, respectively, calculated using
Ž
the annual mean of atmospheric pCO2 361.1 matm
.
in 1995 and 362.5 matm in 1996 reported, at Barrow
Ž .
Point, by Keeling and Whorf 1996 . During spring, pCO values dropped to 90 matm in 1995 and to 2232 matm in 1996. In summer 1995, the pCO values2
increased and attained during fall, a yearly maximum of 778 matm. To discuss such seasonal variation of
Ž .
pCO , three major processes can be envisaged: i2 Ž .
the river input from the Scheldt, ii the biological activity in the water column andror in the sediment;
Žiii the variation of temperature. Frankignoulle et al.. Ž1996b, 1998 showed that important CO. 2 produc-tion occurs in the Scheldt estuary, induced by intense
Ž
heterotrophic processes pCO of 5700 matm at the2 turbidity maximum and 600 matm at the mouth,
.
March 1993 . These are related to a high loading of
Ž
organic matter and a long residence time 1 to 2
.
months of the water within the upper part of the
Ž .
estuary Wollast, 1988 . We can conclude that the observed oversaturation of pCO2 in the Scheldt plume results from the river input of pCO oversat-2
urated water.
During spring, the pronounced undersaturation of pCO results from phytoplankton blooms and related2
photosynthetic assimilation of CO . Indeed, Fig. 22 shows, in 1996, a correlation between the rise of the
Ž
chlorophyll concentration and the drop of pCO2 no
.
chlorophyll data available for 1995 . Our data allow to compute that, on the average, oversaturation of pCO is 150% during 9.5 months, while undersatu-2
ration is 60% during 2.5 months.
It is apparent from Fig. 2 that parameters display inter-annual variations: salinity was lower in 1995
Ž .
than in 1996 and TAlk 35 was higher in 1995 than in 1996. This suggests that the discharge of the Scheldt was higher in 1995 than in 1996. Data from the Ministerie van de Vlaamse Gemeenschap-Ante-rwerpen Zeehavendiesnt show that, except in Jan-uary, the Scheldt discharge was on average 10% higher in early 1995 than 1996. Also, the undersatu-ration of pCO was more pronounced in spring 19952 than in spring 1996. Again, this can be related to the
Ž .
higher Scheldt discharge in 1995 for two reasons: i a higher nutrient input that induces a higher
phyto-Ž .
planktonic biomass; ii the higher input of pCO2 Ž
undersaturated water the lower Scheldt estuary be-comes undersaturated in pCO2 during the spring phytoplankton bloom, as discussed below in Section
.
3.3 .
3.2. Daily Õariations of pCO near Zeebrugge2 Fig. 3 gives the variation of pCO2 and related
Ž
parameters, during 32 h from 1700 h on the 13r05
.
to 0100 h on the 15r05r96 , at a mooring site
Ž3.258E, 51.388N , near Zeebrugge, during a spring.
phytoplankton bloom. The variation of seawater level is also given, showing the semi-diurnal signal of the
Ž
tide, characteristic of this region Nihoul and
Ron-.
day, 1975 . The daily variation of chemical
parame-Ž
ters must be discussed in relation to physical tide
. Ž
and wind andror biological processes diel
biologi-.
cal cycle acting at the same time scale. Salinity, TAlk and temperature evolve in a cyclic manner that clearly follows the tidal cycle. The minimum of salinity and the maximum of TAlk and temperature correspond to low tide. As discussed previously, high TAlk is characteristic of Scheldt water and, in May, the plume water is warmer than the offshore
Ž .
water see below, in Section 3.3 . During ebb, the tidal current is south-west bound, transporting Scheldt
Ž .
water Nihoul and Ronday, 1975 . During flood, the tidal current is reversed and transports water with
Ž . Ž y1. Ž . Ž .
Fig. 3. Variations of pCO2 matm; direct measurement , salinity, TAlk meq kg , temperature 8C , sea surface level cm , pH, oxygen
Ž . Ž y1. Ž .
saturation level % and chlorophyll a concentration mg l , during a 32 h measurement cycle, at a mooring point 3.258E, 51.388N , near Zeebrugge, from 1700 h on the 13r05 to 0100 h on the 15r05r96.
( )
Ž
more offshore characteristics cooler and with lower
.
TAlk .
To discuss the daily variations of pCO and O2 2
saturation level, the biological diel cycle must be taken into account. Fig. 3 shows that the variations of pCO and chlorophyll depend on the tidal cycle:2 the highest pCO2 and chlorophyll values coincide with low tide. This is in agreement with the fact that the Scheldt water displays higher pCO and chloro-2 phyll values than offshore water, even during the
Ž .
phytoplankton bloom see below, Section 3.3 . How-ever, the diel cycle of primary productionrrespira-tion strongly affects the variaproductionrrespira-tion of dissolved O as2
shown by the comparison of two low tide situations:
Ž .
at 0430 h before sunrise O2 saturation level was
Ž .
much lower than at 1710 h before nightfall . This can be explained by the fact that O saturation level2
drops during the night in relation to respiration and rises during the day in relation to net primary pro-duction. To a lesser extent, this is also shown by the fact that the pCO values observed at low tide are2 higher at 0430 h than at 1710 h. When we compare the O2 saturation level at the three high tide situa-tions, the variations due to the biological diel cycle are relatively small: 107.0%, 106.9% and 106.4%,
Ž .
respectively at 2300 h on the 13th , 1100 h and
Ž .
2300 h on the 14th . The important impact of the diel biological cycle on dissolved O2 in the water mass observed at low tide compared to the water mass at high tide can be related to their respective phytoplanktonic biomass, as shown by the
chloro-Ž .
phyll concentration. Billen et al. 1990 have shown that along the Belgian coast, the bacterial biomass is positively correlated to the phytoplanktonic biomass, so the contribution of bacteria to the total respiration will also be higher in the water mass observed at low tide.
3.3. Seasonal Õariations of pCO2 and related pa-rameters along Belgian and Dutch coasts
The spatial distribution of pCO and related pa-2
rameters was established, in 1996, from seven cruises
Ž .
that cover five periods: early February Fig. 4 , early
Ž . Ž . Ž .
March Fig. 5 , late March Fig. 6 , late May Fig. 7
Ž .
and early June Fig. 8 .
3.3.1. Salinity, TAlk and temperature
Figs. 4–8 show that salinity and TAlk are simi-larly distributed along a gradient perpendicular to the coast. Temperature often displays the same pattern. The tongue of low salinity, ranging from 30 to 34, and high TAlk, ranging from 2.4 to 2.5 meq kgy1
, corresponds to the river Scheldt plume. The position and the extent of the plume is related to a south-bound coastal residual current, that turns west roughly at Oostende to merge, offshore, with the north-bound
Ž
flow of the North Atlantic current Nihoul and
Ron-. Ž .
day, 1975 . Our offshore salinity data around 35
Ž y1.
and TAlk around 2.3 meq kg are typical values
Ž
for the English Channel Water Hoppema, 1990;
.
Frankignoulle et al., 1996a,c . In Figs. 5 and 8, the salinity and TAlk gradients show the transport of Scheldt water north of Walcheren, due to the north-bound residual current. Figs. 4–8 show that tempera-ture gradients display important seasonal variations. From early February to late March, the plume water is cooler than offshore water, while from late May to early June, the plume water becomes warmer than offshore water.
3.3.2. pCO , pH, O2 2 saturation, chlorophyll and phaeopigments concentrations
Figs. 4–6 show that from early February to late March, the distribution of pCO2 is quite
heteroge-Ž .
neous but the Scheldt plume salinity lower than 34 is clearly oversaturated in pCO with respect to the2
atmosphere. The distribution of pH is similar to that of O saturation and opposite to that of pCO . Such2 2
correlation show that along the Belgian coast, the distribution of pCO2 is strongly affected by the heterotrophic processes taking place in the Scheldt
Ž .
estuary Frankignoulle et al., 1998 . During the cruise carried out in early February, we measured a higher
Ž .
pCO value in the plume 477 matm at salinity 322
Ž .
compared to the mouth 470 matm at salinity 30 .
Ž . Ž y1. Ž .
Fig. 4. Distribution of pCO2 matm; direct measurement , salinity, TAlk meq kg , temperature 8C , pH, chlorophyll a concentration
Žmg ly1., phaeopigments concentration mg lŽ y1.and oxygen saturation level % , in surface water, along the Belgian coast, from 30r01 toŽ .
( )
The temperature of the Scheldt water changes during
Ž .
its transit from the mouth 0.88C to the plume
Ž1.58C , in relation to the mixing with offshore water.
andror to heat exchange with the atmosphere. This process affects the equilibrium constants of the inor-ganic carbon species and the CO solubility coeffi-2 cient resulting in the variation of the original pCO2 value. This can explain the slight rise of pCO2 in the river plume: a variation of temperature from 0.88C to 1.58C induces a variation of pCO2 from 470 to 486 matm, for a salinity of 30. We can conclude that river input and the effect of tempera-ture control the distribution of pCO2 in the river plume in early February.
In early March, the water masses situated outside
Ž .
the plume salinity ) 34 are undersaturated in pCO . The correlation between pH, O2 2 saturation level and chlorophyll concentration suggest that, in these areas, the observed undersaturation of pCO is2
induced by phytoplanktonic activity. Light could then be the limiting factor for primary production within the plume, which is known to be very turbid.
During the late March cruise, again we measured
Ž
a higher pCO2 value in the plume 544 matm at
. Ž
salinity 32 compared to the mouth 463 matm at
.
salinity 30 . In this case, the effect of the variation temperature accounts for a rise in pCO of 9 matm.2
To discuss the distribution of pCO2 in the river plume in late March, we must then consider other processes such as organic matter degradation or ex-change with the sediments taking place within the river plume itself. Fig. 6 shows that the chlorophyll concentration, in the river plume, is non-negligible. Furthermore, the highest value of chlorophyll
con-y1 Ž
centration in the river plume was 6.7 mg l for
. y1
salinities - 33 but only 2.9 mg l at salinity 30. This shows that the high phytoplanktonic biomass in the river plume were only in part exported from the Scheldt estuary. However, in spite of the high chlorophyll concentration, oversaturation of pCO is2 still observed. Finally, the phaeopigments distribu-tion is also clearly different from the two periods previously discussed. In February and early March,
high phaeopigments concentrations were correlated to low salinities, then suggesting import from the Scheldt. In late March, a peak of phaeopigments that shows the degradation of phytoplankton is observed
Ž .
within the plume itself salinity 32 and coincides with the pCO maximum observed. Thus, such or-2
ganic matter degradation results in the rise of pCO2
and a decrease of O . Future research is needed to2 determine when this process starts to affect signifi-cantly the distribution of pCO in the river plume.2 Figs. 7 and 8 give the distribution of pCO , in2 late May and early June. The easternmost area of the
Ž
plume is undersaturated in pCO2 on average: 70%
.
in late May and 95% in early June . Yet, the west-ernmost area of the plume remains oversaturated in
Ž
pCO2 highest value of 130% in late May and in
.
early June . In late May, in the easternmost area of the plume, high chlorophyll concentrations show the presence of an important phytoplankton bloom that induces undersaturation of pCO in this area. How-2
ever, we must address the question of the possible contribution to this undersaturation by primary pro-duction occurring within the Scheldt estuary itself. During the cruise in late May the lower Scheldt was
Ž .
sampled data not shown and undersaturation of pCO2 was observed between salinities 30 and 26
Žrespectively 82% and 100% but the higher estuary.
was oversaturated in pCO . In the river plume, at2
salinities 32, 33 and 34 the lowest values of under-saturation of pCO2 were respectively: 61%, 55% and 50%. The effect of the variation of temperature
Ž
accounts for a diminution of less than 20 matm 6%
.
of level of saturation . This shows, that during the spring phytoplankton bloom, while the water is al-ready undersaturated in pCO at the Scheldt mouth,2
the primary production within the plume itself also largely contributes to the observed undersaturation of pCO . It should be pointed out that undersaturation2
of pCO in the lower Scheldt estuary is a very brief2
Ž .
event Frankignoulle et al., 1998 . Primary produc-tion affects the pCO distribuproduc-tion to a lesser extent,2 in early June than in late May as shown by the respective levels of undersaturation of pCO , as the2
Ž . Ž y1. Ž .
Fig. 5. Distribution of pCO2 matm; direct measurement , salinity, TAlk meq kg , temperature 8C , pH, chlorophyll a concentration
Žmg ly1., phaeopigments concentration mg lŽ y1.and oxygen saturation level % , in surface water, along the Belgian coast, from 22r02 toŽ .
( )
phytoplanktonic biomass declines. This is corrob-orated by the diminution in early June of the
chloro-Ž y1
phyll concentrations highest value of 27 mg l in
y1 .
late May and 15 mg l in early June .
The distributions of pH, O2 saturation level and pCO , in late May and early June, show that in the2 westernmost area of the plume, respiration dominates primary production. The distribution of the concen-tration of phaeopigments shows that the oversatura-tion of pCO is related to the degradaoversatura-tion of phyto-2
planktonic cells. These observations are in agreement with the ecohydrodynamical model of Nihoul and
Ž .
Hecq 1984 . These authors attribute the patch of maximum of concentration of phaeopigments to the bacterial degradation of the phytoplanktonic cells, transported from the mouth of the Scheldt by the south-bound residual current.
Finally, Figs. 4–8 show that the reference station off Zeebrugge is quite well representative of the behaviour of the plume in terms of sourcersink, i.e., undersaturation during a few weeks in spring and oversaturation for the rest of the year.
Fig. 8 shows the distribution of pCO and associ-2 ated parameters, along the Dutch coast, in early June. The distribution of salinity shows the extent along the Dutch coast of the Scheldt plume, de-flected by the north-bound residual current, as far as 51.88N. The tongue of low salinity, between 51.88N and 52.28N, suggests the input from the Rhine. How-ever, from the distribution of TAlk we cannot dis-criminate the Scheldt and Rhine plumes. Between 52.28N and 52.68N, a distinct tongue of low salinity and high TAlk shows the input from the North Sea Channel, that drains the southern IJsselmeer. This distribution of salinity and TAlk in the North Sea Channel plume, given in Fig. 8, is in agreement with
Ž .
the data of Hoppema 1990 . Our TAlk values are, on average, 0.08 meq kgy1 higher than the ‘typical’
Ž .
values reported by Hoppema 1990 for this region. However, this difference is close to the range of the seasonal and short-term variations of TAlk described by this author. Fig. 8 shows that the Scheldt plume influences the pCO2 distribution along the Dutch
coast as far as 51.88N. The undersaturation of pCO2
of the North Sea Channel plume is induced by a phytoplankton bloom, as shown by the chlorophyll concentration distribution.
3.3.3. Relationships of pCO Õersus chlorophyll2 Linear relationships between pCO2 and
chloro-Ž .
phyll have been proposed by Watson et al. 1991 for
Ž .
the North Atlantic spring 1989 , by Frankignoulle et
Ž . Ž
al. 1996a for the English Channel summer 1992
. Ž .
and spring 1993 and by Bakker et al. 1997 for the
Ž .
Southern Ocean austral spring 1992 . Watson et al.
Ž1991 obtained three kinds of linear relationships.
related to the stage of development of the phyto-plankton bloom: the ‘recent history bloom’
charac-w x Ž 2
terised by pCO s 358 y 16.8 Chla2 r s 0.624, p
.
- 0.0001 , the ‘peak stage’ of the bloom charac-w x Ž 2
terised by pCO s 332 y 10.6 Chla2 r s 0.372, p
.
- 0.0001 and the ‘late stage’ of the bloom charac-w x Ž 2
terised by pCO s 299 y 6.6 Chla2 r s 0.490, p
. Ž .
- 0.0001 . Frankignoulle et al. 1996a found in the
English Channel, two relationships that fit closely
Ž .
those of Watson et al. 1991 . The existence of various relationships in the North Atlantic is related to the fact that before the bloom pCO is relatively2 close to equilibrium and when the bloom declines chlorophyll values drop rapidly but the air–sea ex-change needed to restore equilibrium of pCO2
oc-Ž .
curs at a larger time scale Watson et al., 1991 .
Ž .
Bakker et al. 1997 show that different water masses are characterized by specific pCO –Chla relation-2
ships that depend on the combination of sea surface temperature variations, primary production rates and the pCO value before start of the bloom. Table 12
gives the relationships calculated from our data set. Only two relationships are significant: in the Scheldt plume, during spring and along the Dutch coast, in early June. As expected, the Scheldt plume relation-ship yields a quite high pCO2 value for the zero chlorophyll level. Along the Dutch coast, results are
Ž .
similar to those obtained by Watson et al. 1991 for the ‘late stage’ of the bloom. For the Belgian coast, we can then conclude that pCO2 is correlated to
Ž . Ž y1. Ž .
Fig. 6. Distribution of pCO2 matm; direct measurement , salinity, TAlk meq kg , temperature 8C , pH, chlorophyll a concentration
Žmg ly1., phaeopigments concentration mg lŽ y1.and oxygen saturation level % , in surface water, along the Belgian coast, from 18r03 toŽ .
( )
Table 1
Ž . Ž y1.
Linear relationships obtained by plotting surface pCO2 matm and chlorophyll a concentration mg l
2
w x
pCO2 s A q B Chla r n p
( )
Belgian Coast Zone A
Ž .
Scheldt plume Salinity - 33
Ž . w x From 30r01 to 29r03 502 y 13.9 "7.5 Chla 0.069 48 0.06942 Ž . w x From 20r05 to 23r05 404 y 13.2 "3.1 Chla 0.675 11 0.00191 Ž . w x From 03r06 to 14r06 376 y 2.8 "1.2 Chla 0.239 19 0.03356 Ž .
Offshore region Salinity ) 33
Ž . w x From 30r01 to 29r03 403 y 11.0 "3.1 Chla 0.165 68 0.00059 From 20r05 to 13r05 No Data Ž . w x From 03r06 to 14r06 391 y 10.5 "3.8 Chla 0.260 24 0.01089 ( )
Dutch Coast Zone B
Ž . w x
From 03r06 to 14r06 331 y 5.9 "0.88 Chla 0.725 19 0.00045
The pCO was calculated from pH and TAlk.2
The r2 is the regression coefficient and P the statistical confidence interval.
Zones A and B are defined in Fig. 8.
phytoplanktonic biomass only during the spring bloom. During the rest of the year, other processes are responsible for the distribution of pCO .2
4. Conclusions
Our study shows the high variability of the distri-bution of pCO along the Belgian and Dutch coasts2
and its multiple controlling factors. Indeed, present atmospheric pCO is, on average, 362 matm and we2
report pCO2 values in surface seawater ranging from 90 to 778 matm. Along the Belgian coast, the main forcing factor is the river input from the Scheldt. The daily variation of pCO2 is induced by the tide. During ebb, the tidal current brings Scheldt water, so highest pCO was measured at low tide.2 However, at this time scale, the variation of pCO is2 also modulated by the diel biological cycle.
The seasonal variation of pCO is induced by the2
river input from the Scheldt and the seasonal varia-tion of phytoplanktonic biomass. During winter, the river input of pCO oversaturated water is the major2
controlling factor, so the Scheldt plume is
oversatu-rated in pCO . However, in the areas adjacent to the2 Scheldt plume, undersaturation of pCO2 was ob-served in early March. In late March, the degradation of organic matter within the river plume also con-tributes to the distribution of pCO . During spring,2 favourable light and temperature conditions and high nutrient contents related to river input induce an important phytoplanktonic biomass within the river plume that is responsible for the undersaturation of pCO2 in the easternmost area of the river plume. The lower Scheldt estuary also becomes undersatu-rated in pCO contributing to the undersaturation of2
pCO2 observed in the river plume. However, the degradation of phytoplankton, induces oversaturation of pCO in the westernmost area of the river plume.2
The inter-annual variation of pCO depends, at least2 partly, on the fluctuations of the discharge of the Scheldt.
The data from the Zeebrugge reference station strongly suggest that the Scheldt plume acts yearly as a net source of atmospheric CO . The observed2
spatial distributions of pCO2 show that our refer-ence station is representative of the overall distribu-tion of pCO in the plume. On another hand, for all2
Ž . Ž y1. Ž .
Fig. 7. Distribution of pCO2 matm; direct measurement , salinity, TAlk meq kg , temperature 8C , pH, chlorophyll a concentration
Žmg ly1., phaeopigments concentration mg lŽ y1.and oxygen saturation level % , in surface water, along the Belgian coast, from 20r05 toŽ .
( )
( )
A.V. Borges, M. Frankignouller Journal of Marine Systems 19 1999 251–266 265
Ž .
cruises, the off-shore water English Channel water was undersaturated in pCO . Our data also show2
that the Dutch coastal region acts, in early summer, as a sink of atmospheric CO . Further research is2
needed to determine whether the Dutch coastal re-gion acts yearly as a source or a sink of atmospheric CO and to quantify in both areas the corresponding2 carbon flux across the air–sea interface.
Acknowledgements
The authors would like to thank BMM-MUMM
ŽBelgium , for providing thermosalinograph data,.
Ministerie van de Vlaamse Gemeenshap-Anterwer-pen Zeehavendienst for the data of the discharge of the Scheldt, officers and crew of R.V. Belgica for helpful collaboration, Renzo Biondo, Isabelle Bourge, for technical assistance, Stephane Desgain for sam-pling the Zeebrugge Station in 1995, Roland Wollast and an anonymous reviewer for helpful comments on a previous version of the manuscript. This work was funded by the Fonds National de la Recherche
Scien-Ž .
tifique Convention F.R.F.C. number 2.4519.95.F , with which Michel Frankignoulle is a research
asso-Ž
ciate and by the European Commission BIOGEST
.
project number ENV4-CT96-0213 . Alberto Vieira Borges is presently a PhD student with a grant from the Fonds pour la Formation a la Recherche dans
`
l’Industrie et l’Agriculture. This is Eloise contribu-tion number 034.
References
Bakker, D.C.E., de Barr, H.J.W., de Wilde, H.P.J., 1996. Dis-solved carbon dioxide in Dutch coastal waters. Mar. Chem. 55, 247–263.
Bakker, D.C.E., de Barr, H.J.W., Bathmann, U.V., 1997. Changes of carbon dioxide in surface waters during spring in the
Ž .
Southern Ocean. Deep-Sea Res. 44 1–2 , 91–128.
Benson, B.B., Krause, D., 1984. The concentration and isotopic fractionation of oxygen dissolved in freshwater and seawater in equilibrium with the atmosphere. Limnol. Oceanogr. 29, 620–632.
Billen, G., Joiris, C., Meyer-Reil, L., Lindeboom, H., 1990. Role of bacteria in the North Sea ecosystem. Neth. J. Sea Res. 26, 266–293.
Copin-Montegut, C., 1988. A new formula for the effect of´
temperature on the partial pressure of carbon dioxide in seawa-ter. Mar. Chem. 25, 29–37.
Culkin, F., 1965. The major constituents of seawater. In: Riley,
Ž .
J.P., Skirrow, G. Eds. , Chemical Oceanography, Vol. 2. Academic Press, London, pp. 121–161.
Dickson, A.G., 1993. pH buffers for seawater media based on the total hydrogen ion concentration scale. Deep-Sea Res. 40, 107–118.
Frankignoulle, M., Bourge, I., Canon, C., Dauby, P., 1996a. Distribution of surface seawater partial CO2 pressure in the English Channel and in the Southern Bight of the North Sea. Continent. Shelf Res. 16, 381–395.
Frankignoulle, M., Bourge, I., Wollast, R., 1996b. Atmospheric
Ž .
CO fluxes in a highly polluted estuary the Scheldt . Limnol.2
Oceanogr. 41, 365–369.
Frankignoulle, M., Elskens, M., Biondo, R., Bourge, I., Canon, C., Desgain, S., Dauby, P., 1996c. Distribution of inorganic carbon and related parameters in surface seawater of the English Channel during Spring 1994. J. Mar. Syst. 7, 427–434. Frankignoulle, M., Abril, G., Borges, A., Bourge, I., Canon, C., Dellile, B., Libert, E., Theate, J.-M., 1998. Carbon dioxide´
emission from European estuaries. Science 282, 434–436. Frankignoulle, M., Borges, A., Biondo, R., A new design of
equilibrator to monitor carbon dioxide in highly dynamic and turbid environments, submitted.
Hoppema, J.M.J., 1990. The distribution and seasonal variation of alkalinity in the Southern Bight of the North Sea and the western Wadden Sea. Neth. J. Sea Res. 26, 11–23.
Hoppema, J.M.J., 1991. The seasonal behaviour of carbon dioxide in the coastal North Sea along the Netherlands. Neth. J. Sea Res. 28, 167–179.
Hoppema, J.M.J., 1993. Carbon dioxide and oxygen
disequilib-Ž .
rium in a tidal basin Dutch Wadden Sea . Neth. J. Sea Res. 31, 221–229.
Keeling, C.D., Whorf, T.P., 1996. Atmospheric CO records from2
sites in the SIO air sampling network. In: Trends—A com-pendium of Data on Global Change. Carbon Dioxide Informa-tion Analysis Center, Oak Ridge NaInforma-tional Laboratory, Oak Ridge, USA.
Kempe, S., Pegler, K., 1991. Sinks and sources of CO in coastal2
seas: the North Sea. Tellus 43 B, 224–235.
Liss, P.S., Merlivat, L., 1986. Air–sea exchanges rates:
introduc-Ž .
tion and synthesis. In: Buat-Menard, P. Ed. , The Role of´
Air–Sea Exchange in Geochemical Cycling. NATO ASI se-ries, Reidel, Utrecht, pp. 113–128.
Lorenzen, C.J., Jeffrey, S.W., 1978. Determination of chlorophyll a in seawater. Unesco Techn. Pap. Mar. Sci. 35, 1–21. Mackenzie, F.T., 1991. What is the importance of ocean margin
processes in global change? In: Mantoura, R.F.C., Martin,
Ž . Ž y1. Ž .
Fig. 8. Distribution of pCO2 matm; direct measurement , salinity, TAlk meq kg , temperature 8C , pH, chlorophyll a concentration
Ž .
J.M., Wollast, R. Eds. , Ocean Margin Processes in Global Change, Wiley, Chichester, pp. 433–454.
Nihoul, J.C.J., Ronday, F.C., 1975. The influence of tidal stress on the residual circulation. Tellus 29, 484–490.
Nihoul, J.C., Hecq, J.H., 1984. Influence of residual circulation on the physico-chemical characteristics of water masses and the dynamic of ecosystems in the Belgian coastal zone. Continent. Shelf Res. 3, 167–174.
Roy, R.N., Roy, L.N., Vogel, K.M., Porter-Moore, C., Pearson, T., Good, E.C., Millero, F.J., Campbell, D.M., 1993. The dissociation constants of carbonic acid in seawater at salinities 5 to 45 and temperatures 0 to 458C. Mar. Chem. 44, 249–267. Sarmiento, J.L., Sundquist, E.T., 1992. Revised budget for the oceanic uptake of anthropogenic carbon dioxide. Nature 356, 589–593.
Smith, S.V., Hollibaugh, J.T., 1993. Coastal metabolism and the oceanic organic carbon balance. Rev. Geophys. 31, 75–89.
Ž .
Walsh, J.J. Ed. , 1988. On the nature of continental shelves, Academic Press, New York, 520 pp.
Walsh, J.J., 1991. Importance of continental margins in the marine biogeochemical cycling of carbon and nitrogen. Nature 350, 53–55.
Wanninkhof, R., 1992. Relationship between wind speed and gas exchange over the ocean. J. Geophys. Res. 97, 7373–7382. Watson, A.J., Robinson, C., Robertson, J.E., Williams, P.J.le B.,
Fasham, J.R., 1991. Spatial variability in the sink for atmo-spheric carbon dioxide in the North Atlantic. Nature 350, 50–53.
Weiss, R.F., 1974. Carbon dioxide in water and seawater: the solubility of a non-ideal gas. Mar. Chem. 2, 203–215. Wollast, R., 1988. The scheldt estuary. In: Salomons, W., Bayne,
Ž .
B.L., Duursma, E.K., Forstner, U. Eds. , Pollution of the North Sea, an assessment, Springer, Berlin, pp. 183–193. Wollast, R., 1991. The coastal organic carbon cycle: fluxes,
sources and sinks. In: Mantoura, R.F.C., Martin J.M., Wollast,
Ž .
R. Eds. , Ocean Margin Processes in Global Change, Wiley, Chichester, pp. 365–382.