Titre:
Title:
Effective oxygen diffusion coefficient of till and green liquor dregs (GLD) mixes used in sealing layer in mine waste covers
Auteurs:
Authors: Anna Virolainen, Christian Maurice et Thomas Pabst
Date: 2020
Type: Article de revue / Journal article
Référence:
Citation:
Virolainen, A., Maurice, C. & Pabst, T. (2020). Effective oxygen diffusion
coefficient of till and green liquor dregs (GLD) mixes used in sealing layer in mine waste covers. Water, Air, & Soil Pollution, 231(2). doi: 10.1007/s11270-020-4431-3
Document en libre accès dans PolyPublie
Open Access document in PolyPublie
URL de PolyPublie:
PolyPublie URL: https://publications.polymtl.ca/5323/
Version: Version finale avant publication / Accepted version Révisé par les pairs / Refereed Conditions d’utilisation:
Terms of Use: Tous droits réservés / All rights reserved
Document publié chez l’éditeur officiel
Document issued by the official publisher
Titre de la revue:
Journal Title: Water, Air, & Soil Pollution (vol. 231, no 2) Maison d’édition:
Publisher: Springer URL officiel:
Official URL: https://doi.org/10.1007/s11270-020-4431-3 Mention légale:
Legal notice:
This is a post-peer-review, pre-copyedit version of an article published in Water, Air, &
Soil Pollution. The final authenticated version is available online at: https://doi.org/10.1007/s11270-020-4431-3
Ce fichier a été téléchargé à partir de PolyPublie, le dépôt institutionnel de Polytechnique Montréal
This file has been downloaded from PolyPublie, the institutional repository of Polytechnique Montréal
1 Effective oxygen diffusion coefficient of till and green liquor dregs (GLD) mixes used in 1
sealing layer in mine waste covers 2
Anna Virolainen1, Christian Maurice1,2 and Thomas Pabst3,4,*
3
1Luleå University of Technology, Sweden
4
2Ramböll, Sweden
5
3Polytechnique Montreal, Canada
6
4Research Institute on Mines and Environment (RIME), Canada
7
*Corresponding author (t.pabst@polymtl.ca)
8 9
Abstract
10
Cover systems can efficiently limit acid mine drainage generation from sulfidic mine wastes by
11
controlling oxygen diffusion. Their performance relies on their high degree of saturation, as
12
oxygen diffusion is substantially reduced in water or saturated medium. However, natural soils
13
available in the mine vicinities do not necessarily have the hydrogeological properties required for
14
the construction of sealing layers. A common strategy is to improve the characteristics of local
15
soils using bentonite amendment, but this usually induces high costs and environmental footprint.
16
An alternative is to reuse (or valorize) waste materials, such as mine wastes or industrial wastes
17
like green liquor dregs (GLD). Blends of till and GLD can have advantageous properties regarding
18
water retention capacity and hydraulic conductivity. In this study, the effective oxygen diffusion
19
coefficient De of till-GLD blends was evaluated using 81 diffusion tests. Various quantities and
20
different types of GLD were tested. The diffusion coefficient was found to vary greatly depending
2
on the degree of saturation. Even though the GLD contained naturally a substantial amount of
22
water, a high water content of the till was still required to reach a low De. Measurements were also
23
compared to modified Millington-Shearer predictive model which could generally predict the
24
diffusion coefficient within an acceptable range. Results also indicated that the till-GLD mixes
25
should not be exposed to evaporation as significant performance loss may rapidly occur upon
26
drying. Main experimental results are presented in this paper together with recommendations in
27
terms of cover design using till-GLD mixes.
28
Key words
29
Oxygen diffusion, green liquor dregs (GLD), mine wastes, covers, sealing layers, acid mine
30
drainage, reclamation
3 1. Introduction
32
Sulfidic mine wastes exposed to air and water can oxidize and generate acid mine drainage (AMD)
33
characterized by low pH and high sulfate and metal concentrations (Blowes et al., 2014;
34
Nordstrom, 2015; Lindsay et al., 2015). AMD remains today one of the main environmental
35
challenges for the mining industry (Aubertin et al., 2016). One of the primary objectives of the
36
reclamation of AMD generating mine sites is to prevent oxidation reactions at the source, by
37
controlling the access of either oxygen or water to mine wastes (e.g. Aubertin et al., 1999, 2002,
38
2016). In humid climate, oxygen barrier covers can generally effectively prevent oxygen diffusion
39
(Höglund and Herbert, 2004).
40
The objective of oxygen barrier covers is to limit the oxygen flux to the underlying reactive waste
41
materials by maintaining a high degree of saturation even though they are sometimes placed well
42
above the water table (e.g. Nicholson et al., 1989; Collin, 1998; Aubertin et al., 1999; Höglund
43
and Herbert., 2004; Lottermoser, 2010). In multilayer covers, oxygen diffusion is controlled by
44
the sealing layer (or moisture retaining layer, MRL). The sealing layer is typically placed between
45
two coarser grain layers, which will develop capillary barrier effects, and prevent water loss by
46
drainage and evaporation (Aubertin et al., 1999). The top coarse grain layer also acts as a drainage
47
layer and can protect the sealing layer from root penetration, freeze-thaw action, and erosion
48
(Aubertin et al., 2002). An organic-rich layer can be added on top to promote the establishment of
49
vegetation (e.g. Guittonny-Larchevêque et al., 2017). This type of barrier is particularly suitable
50
for humid continental and boreal climates with positive groundwater recharge, such as in Sweden
51
(Lottermoser, 2010) or Canada (Aubertin et al., 2002, 2016). Current targets for sealing layers in
52
Sweden are based on results presented in the MiMi research program (Höglund and Herbert, 2004)
4
and suggest that the oxygen flux should be less than 1 mol m-2 yr-1, which is consistent with
54
recommendations in other countries (e.g. Demers et al., 2009; Pabst et al., 2018).
55
Cover systems must be designed so they remain efficient for the indefinite lifetime of a reclaimed
56
mine site (Vick, 2001), which is usually the reason for using natural mineral materials (Aubertin
57
et al., 2016). Sealing layers are commonly made of clayey till (Höglund and Herbert, 2004) or
58
other fine-grained materials (Bussière et al., 2007). However, reclamation of mine sites covering
59
sometimes hundreds of hectares requires large quantities of natural materials which could
60
significantly impact the environment if they had to be borrowed in the vicinity or transported over
61
long distances. Moreover, natural materials close to the mine can be scarce, or highly variable and
62
they sometimes do not have suitable properties for cover design. When local natural materials do
63
not meet performance criteria for a sealing layer, other options are needed.
64
The addition of a small fraction of bentonite to the till
(
3-5 % on dry weight basis) can, for example,65
contribute to decrease the hydraulic conductivity and enhance the water retention capacity (e.g.
66
Chapuis, 1990; or more recently and specifically for cover systems: Boulanger-Martel et al., 2015).
67
Green liquor dregs (GLDs), a waste from the pulp and paper industry, are another potentially
68
attractive mixing material because of their adequate hydraulic properties, their availability in some
69
regions, and their low costs (Nigéus et al., 2018). GLDs are one of the largest waste streams
70
generated by the pulp and paper mills using the sulphate production system and they are classified
71
as non-hazardous waste and dispensed from landfill taxes in Sweden. Commonly, GLDs have a
72
low hydraulic conductivity and high water retention capacity but also have a paste like consistency
73
and low shear strength. Mixed in a limited amount with granular soil such as till, an increasing
74
addition of GLDs have the capacity to improve the water retention capacity of the mixture, while
5
keeping relatively good geotechnical properties. The success of the methods relies on an efficient
76
mixing of the GLD in the matrix and a sufficient degree of compaction of the blend.
77
GLD are fine-grained and mostly inorganic wastes from sulfate pulp and paper industry (Nigéus
78
et al 2018). The use of GLD is rather novel and previous studies have focused on the chemical,
79
physical and mineralogical characterization of GLD (Martins et al., 2007; Hamberg and Maurice,
80
2013; Mäkitalo et al., 2014; 2016). Various mixtures containing GLD were tested in the laboratory
81
(Villain, 2008; Jia et al., 2013; 2014; Mäkitalo et al., 2015a; 2015b; Nigéus, 2018) and pilot scale
82
studies were carried out in the field (Chtaini et al. 2001; Ragnvaldsson et al., 2014; Jia et al., 2017).
83
Results indicated that GLD, and especially mixes of GLD and till, had good properties for the
84
construction of cover systems, including a high water retention capacity (Mäkitalo et al., 2015a;
85
2015b; Nigéus et al., 2018), thus potentially being able to efficiently reduce oxygen diffusion.
86
Moreover, such mixes could contribute to valorize (i.e. re-use) GLD and reduce the volumes that
87
need to be disposed of, thus promoting the concept of circular economy (Nigéus et al., 2018).
88
However, the effective capacity of the till-GLD mixes to control oxygen diffusion has not been
89
experimentally validated so far. The main uncertainty concerns the difficulty to homogenize the
90
mixes, particularly because of the “sticky” texture of (some) GLD which tend sometimes to
91
agglomerate and form clumps (Virolainen, 2018). Oxygen transport though mine waste cover
92
systems can occur through a combination of advective and diffusive processes in both the gas and
93
aqueous phase of the porous medium. Molecular diffusion is generally the controlling transport
94
mechanism in partly saturated fine-grained soils (e.g. Collin and Rasmusson, 1988). The oxygen
95
flux is generally dominated by diffusion in the air phase, but, when saturation exceeds 85–90%,
96
the air-filled pores becomes discontinuous, and the oxygen flux becomes controlled by the
97
diffusion through water-filled pores (Aubertin and Mbonimpa 2001; Aachib et. al., 2004).
6
The oxygen flux from one-dimensional oxygen diffusion through a non-reactive material can be
99
described by Fick’s first law (Crank, 1975):
100
F(z, t) = −De
∂C (z,t)
∂z (1)
101
and the oxygen concentration C(z,t) at depth z and time t can be described by Fick’s second law:
102 ∂ ∂t(θeqC) = ∂ ∂z(De ∂C ∂z) (2) 103
where F(z,t) is the diffusive flux at position z and time t [M L-2 T-1], D
e is the effective diffusion
104
coefficient [L-2 T-1], and C(z,t) the concentration of oxygen at position z and time t, and θ
eq is the
105
equivalent diffusion porosity [L3 L-3].
106
The effective diffusion coefficient (De) is governed by the grain size, porosity, tortuosity and
107
degree of saturation of the material (Aubertin et al., 1995). De can be determined by field (Elberling
108
et al. 1994; Dagenais et al., 2012) or laboratory measurements (Yanful, 1993; Demers et al., 2009).
109
However, as measurements can be difficult and time consuming, several empirical relationships
110
based on geotechnical properties were developed. Predictive models can be useful during
111
preliminary stages of a project, or in numerical models (once calibrated). For example, the
112
predictive model proposed by Aachib et al. (2004) was developed from earlier models proposed
113
by Millington and Quirk (1961), Millington and Shearer (1971), and Collin and Rasmusson (1988).
114
Aachib et al. (2004) model is a dual-phase diffusion models which considers diffusion through
115
both water and air. The modified Millington-Shearer model (MMS) for predicting the De can be
116 expressed as: 117 De = 1 n2(Da 0θ a pa+ HD w 0θ w pw) (3) 118
7
where H is Henry’s equilibrium constant (0.032 at 25°C), θw and θa are the volumetric water and
119
air contents respectively, Dw0 is the free diffusion coefficient in water (L2 T-1; 1.76×10⁻⁵ m2 s-1 at
120
25°C), Da0 is the free diffusion coefficient in air (L2 T-1; 2.1×10⁻⁹ m2 s-1 at 25°C), n is the porosity,
121
and pa and pw are constants related to tortuosity. Aachib et al. (2004) showed that pa and pw could
122
be approximated by the following relation:
123 pa,w = 1.201θa,w3 − 1.515θ a,w 2 + 0.987θ a,w+ 3.119 (4) 124
Authors also suggested that pa = pw = 3.4 was a good estimate (Aachib et al., 2004). MMS
125
predictive model and Aachib equations were, however, developed for natural and uniform
126
materials, and the applicability to material mixes have not been validated.
127
The aim of this study was to evaluate the effective oxygen diffusion coefficient of till-GLD blends
128
to assess their performance as a material for sealing layers. The water content, the types and
129
quantities of GLD in the blends were the variables studied in the experimental design. Both the
130
initial water content and the behaviour of the materials subjected to drying was tested in the
131
laboratory. A total of 81 diffusion tests were carried out in the laboratory on various till-GLD
132
blends. Based on laboratory results, the performance of MMS predictive model to accurately
133
determine the effective diffusion coefficient of till-GLD blends was evaluated.
134 135 2. Methodology 136 2.1. Materials 137
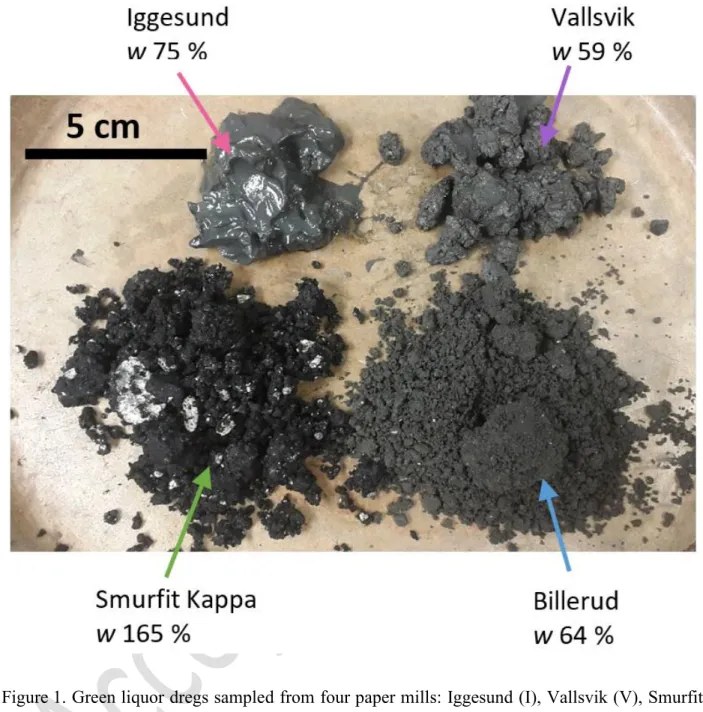
Four samples of green liquor dregs (GLD), one till, and a field blend of till and GLD were tested
138
in this study. The four GLD were selected to cover a variety of properties encountered in the
8
industry and were obtained from four pulp and paper mills located in Sweden: Billerud (B), Smurfit
140
Kappa (SK), Iggesund (I), and Vallvik (V)(Figure 1):
141
1) Smurfit Kappa: black with white fragments (mesa, calcium carbonate and hydroxide),
142
crumbles and clumps, moist and sticky.
143
2) Billerud: grey, small crumbles, perceived as relatively dry, similar to Vallsvik but with
144
smaller aggregates.
145
3) Iggesund: dark grey paste, very wet with a lot of bleeding water, very sticky.
146
4) Vallvik: grey, sharp smell, medium-coarse crumbles, perceived as relatively dry.
147
GLD properties can vary significantly depending on the process and production rate at the pulp
148
mill (Nigéus et al 2018) so these samples were not necessarily representative of the typical GLD
149
generated at these mills or elsewhere. However, they were sufficiently different to give some
150
insights about typical behaviours.
151
The till was collected from a till quarry producing material for mine waste covers. It was dried at
152
room temperature for 48 h and sieved to a maximum particle size of 2 mm. This till was actually
153
also used for reclamation on a mine site, but its saturated hydraulic conductivity exceeded sealing
154
layer requirements (i.e. 10-8 m/s) and improvement was decided. In field conditions, the till was
155
sieved to 20 mm and mixed with 6.1% (dry weight) of GLD B to produce the final sealing layer
156
material. The resulting material was sampled for this laboratory study, sieved to a maximum
157
particle size of 2 mm (like other materials tested in this study) and tested in the laboratory (Field
158
blend).
9 160
Figure 1. Green liquor dregs sampled from four paper mills: Iggesund (I), Vallsvik (V), Smurfit
161
Kappa (SK), and Billerud (B). The GLD samples had different water contents (indicated in the
162
figure), colours and textures.
163 164 165 166
10 2.2. Specific gravity and particle size distribution
167
Specific gravity of the materials was determined by gas and water pycnometers according to
168
ASTM standard D5550 and D854. Material water contents were determined according to ASTM
169
standard D2216, by drying a minimum of 20 g sample at 105°C for a minimum of 16 hours.
170
Particle size distribution (PSD) curves were determined at Lulea Technical University laboratories
171
by a combination of sieving and laser diffraction (Cilas 1064, CILAS). PSD of GLD B and SK,
172
and of the till were also measured using a combination of sieving and hydrometer test (ASTM
173
D422).
174
Characterisation of water and solid content showed that the sample from Smurfit Kappa (SK) was
175
distinctly different from the three other GLD samples (Table 1). SK had a lower solid content
176
(38%) and higher water content (165%) compared to the other three materials that were similar in
177
terms of solid contents (57–63%) and water content (59–75%; Table 1).
178
Specific gravity of till was approximately 2.67 but varied between 2.43 and 2.63 for the four GLD
179
samples (Table 1).
180
Three of the GLD samples (B, I and V) had similar grain size distribution curves with a d10 around
181
4 µm, and a d60 between 24 and 30 µm. GLD SK was slightly different from the others and
182
contained a larger coarse fraction with d10 = 7 µm, and d60 = 97 µm. The PSD of the till and the
183
field blend were similar, especially for the fine fraction. The till had the composition of a silty sand
184
with a clay content of approximately 3%.
185
The particle size distributions curves showed the presence of two distinct fractions in the GLD,
186
i.e. a finer fraction (clay and silt), and a coarser fraction (which can constitute almost half the
187
sample in the case of SK)(Figure 2). The coarser fraction partly consisted of larger GLD grains,
11
possibly agglomerates or mesa fragments (no chemical analysis was performed), and partly of
189
lithogenic grains (sand of quartz and feldspar minerals). The mineral fraction likely came from the
190
handling process. Sand is for example often used during the transport of dregs to ease loading.
191
The texture of the GLDs (Figure 1) did not seem to be related to either their water content or PSD
192
(Figure 2).
193 194
Table 1. Geotechnical properties of GLD Smurfit Kappa (SK), Billerud (B), Iggesund (I) and
195
Vallsvik (V), till and field blend. Dx: diameter corresponding to x% passing; s: specific gravity;
196
pycn.: pycnometer.
197
Green Liquor Dregs (GLD)
Kappa (SK) Smurfit Billerud (B) Iggesund (I) Vallsvik (V) Till blend Field
Clay, ≤ 2 µm (%) 3.1 5.8 6.4 6.4 3.0 2.6 Silt, 2 – 63 µm (%) 53.4 70.9 73.9 67.4 31.9 31.3 Sand, 63 – 200 µm (%) 43.5 23.3 19.7 26.2 65.2 66.0 D10 (µm) 7 4 4 4 10 10 D30 (µm) 17 12 13 13 53 52 D60 (µm) 97 25 24 30 160 265 Solid content (%) 38 61 57 63 99.7 89
Initial water content (%) 165 64 75 59 <0.3 13 s (g cm-3) – gas pycn. 2.43 2.63 2.63 ± 0.02 2.61 - -
s (g cm-3) – water pycn. 2.50 ± 0.30 2.64 ± 0.22 - - 2.67 ± 0.08 -
12 199
Figure 2. Particle size distribution curves of GLD Smurfit Kappa (SK), Billerud (B), Iggesund (I)
200
and Vallsvik (V), till and field blend. Different methods were used to determine sample PSDs (see
201
text for details). Till and field blend were sieved to a maximum particle size of 2 mm.
202 203
2.3. Oxygen diffusion tests 204
2.3.1. Principle 205
Oxygen diffusion tests were developed and largely used by Yanful (1993), Aubertin et al. (1995),
206
and Mbonimpa et al. (2003), to evaluate oxygen diffusion through tailings and various materials,
207
especially for cover systems. The protocol used in this study follows the approach initially
208
proposed by Yanful (1993) and modified by Aubertin et al. (1995, 2000), and Aachib et al. (2004).
209
In this test, a specimen (around 3 cm high and 8.5 cm in diameter) is packed in a test cell (Figure 3).
210
Empty volumes (reservoirs) are left above and below the material and the column is sealed with
211
lids. At the beginning of the test, an oxygen gradient is imposed across the material: the bottom
13
reservoir is flushed with nitrogen gas (100% N2, i.e. 0% O2) and the top reservoir is flushed with
213
air (around 20,9% O2). The cell is then hermetically closed, and the diffusion test is started. Oxygen
214
sensors are placed in each reservoir and continuously measure the oxygen concentration. Changes
215
in concentration occur as an effect of oxygen diffusing through the specimen. The test is finished
216
when equilibrium is reached in the cell. In some tests however, the diffusion is so slow that oxygen
217
concentrations do not reach equilibrium after several days. In this study, the duration of the tests
218
varied from less than an hour to more than two weeks. Based on the measurements of oxygen
219
concentration over time, the effective oxygen diffusion coefficient can be estimated using inversed
220
numerical simulations.
221
2.3.2. Specimen preparation 222
The till was first wetted to the target water content and then mixed manually with GLD. GLD
223
additions (between 2.5 and 7.5%) were expressed in dry weights to compare blends in terms of
224
solid content (GLD have different initial water contents). The mixing was performed by hand for
225
three minutes to achieve a uniform blend, after which the material was left in an airtight bag for at
226
least 12 h to let the moisture homogenise. The material was then placed and packed in one layer,
227
using a metal compactor, directly in the diffusion cell made of PVC. Diffusion cells were 8.5 cm
228
in diameters and around 12 cm in height, but the sample itself was around 2 to 3 cm thick, leaving
229
enough space to keep air reservoirs above and below the specimen (Figure 3). Depending on the
230
specimen, compaction could become more difficult when water content increased, so for high
231
degree of saturations, compaction was achieved at lower water content and additional water was
232
added on top of the specimen. In these cases, the cell was closed and left at rest for another 12 h
233
to let the moisture content homogenise in the sample. Sample dimensions and water content,
234
together with top and bottom reservoir volumes, were measured at the beginning and at the end of
14
each test. In total, 81 specimens were prepared and tested. Porosity was usually comprised between
236
0.25 and 0.35, with a few more (pure till) and less (pure GLD) dense samples.
237 238
239
Figure 3. Diffusion test setup and instrumentation (after Aachib et al., 2004).
240 241
2.3.3. Instrumentation 242
Oxygen concentrations in the top and bottom reservoirs were monitored using fiber-optic oxygen
243
sensors (dipping probes PSt3, PreSens) made of 2 mm polymer optical fibre with a polished distal
244
tip coated in an oxygen sensitive foil. These sensors have a measurement range of 0-100%
245
atmospheric O2 with a detection limit of 0.03%. Reported accuracy of the sensors is ±0.4% O2 at
246
20.9% O2, and ±0.05% O2 at 0.2% O2 (PreSens, 2016). Each sensor was calibrated individually
15
following the protocol suggested by the manufacturer. The sensors were connected to an Oxy-10
248
transmitter recording the measurements every 2 seconds (Figure 1).
249 250
2.3.4. Test interpretation 251
Oxygen concentration measurements were interpreted using numerical simulations carried out
252
with Vadose/W (Geoslope, 2016). Vadose/W is a 2D finite element code (now replaced by
253
Seep/W) which can assess the unsaturated behaviour of materials, including oxygen diffusion and
254
consumption. The experiments were modelled using the porosity and degree of saturation of each
255
specimen and experiment. A few tests showed a degree of saturation slightly above 100%
256
(probably because of uncertainties in porosity estimation) and Sr = 100% was assumed in the
257
interpretation. Boundary conditions represented temperature during the test (T = constant = 24°C),
258
atmospheric oxygen concentrations in the top reservoir, no oxygen in the bottom reservoir. An
259
iterative curve fitting procedure was set to minimise the root mean squared error (RMSE) between
260
the observed data and simulated values to obtain the best fitting model. RMSE was calculated
261
using the following equation:
262 RMSE = √1 N∑ (Pi− Oi) 2 N i=1 (5) 263
where Oi is the experimental oxygen concentration, Pi the simulated oxygen concentration with
264
Vadose/W and N the number of values compared.
265
Once the best fit had been adjusted, the corresponding parameter De was determined.
266 267
2.4. Drying tests 268
16
The effect of drying was evaluated for till, pure GLD SK, field blend and different till-GLD SK
269
blends (with 2.5, 5 and 7.5 % of SK). Specimens were prepared at a high degree of saturation
270
(Sr > 85%) and an initial diffusion test was performed before the cell was opened and the specimen
271
exposed to drying. Two approaches were used for drying, either a 3 h exposure with a fan (high
272
evaporation) or 2 h without fan (moderate evaporation). After drying, the cells were sealed again
273
and left at rest for 12 h (to let the moisture content homogenise in the sample) before a new
274
diffusion test was carried out. The new degree of saturation was estimated by weight, and assuming
275
a constant sample volume. The procedure was repeated 2 to 4 times for each test.
276 277
3. Results 278
3.1. Effective oxygen diffusion coefficient in till-GLD mixes 279
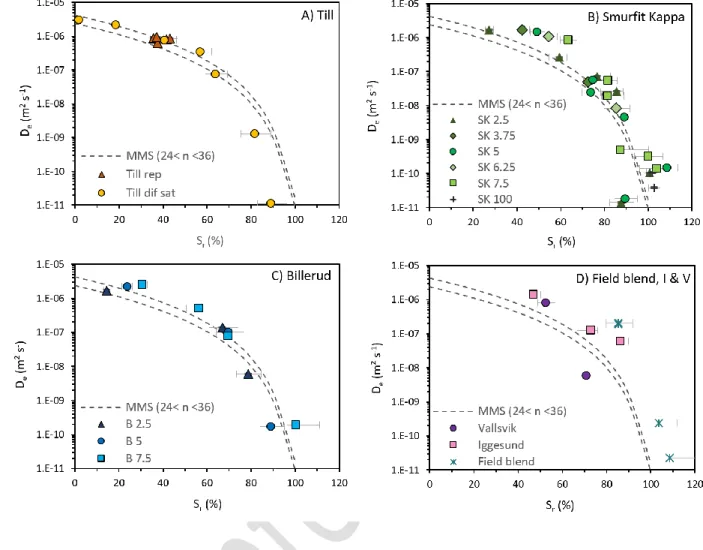
Laboratory results showed that the diffusion coefficient tended to decrease significantly with
280
increasing degree of saturations, from around 3×10⁻⁶ m2 s-1 for dry materials, to values as low as
281
1×10-11 m2 s-1 for materials close to saturation (Figure 4). The slope of the curve was steeper for
282
degrees of saturation exceeding 80%. These results had a strong impact on the duration of the tests:
283
for the driest specimens, the oxygen concentration in both reservoirs could reach an equilibrium
284
within a few minutes, while the tests ran for over 15 days for the highest degrees of saturation
285
without any significant diffusion. Some results show degrees of saturation exceeding 100% at the
286
beginning of the tests, which can be explained by measurements errors on the specimen volume or
287
the water content during the setup or dismantling of the diffusion cells.
17
The general trend of the curves is relatively similar for the different specimens, independently of
289
the nature or quantity of GLD added. The measured diffusion coefficients and the variation of De
290
with the degree of saturation were all in the same range of results (Figure 4).
291
Measured diffusion coefficients were compared to predicted values calculated with the MMS
292
model (equation 3). In general, the model was close to the measured values, especially for degrees
293
of saturation smaller than 80%. For higher degrees of saturation, the difference could however
294
reach several orders of magnitude (not taking into account the possible error on Sr). The general
295
trends, including the steeper slope for higher degrees of saturation, were nevertheless well
296
reproduced by the model, and over 75% of the measured diffusion coefficients were within one
297
order of magnitude of the predicted values. Results showed no particular trend in terms of
298
overestimation or underestimation, and measured values were indifferently on both sides of the
299
predicted curves, yet a majority of predicted values were slightly underestimated.
300
Measurement repeatability was verified by comparing results from different cells and specimen
301
size but using the same material (till) prepared at the same water content (w = 7%) and packed at
302
approximately the same porosity (n = 24-28%, i.e. Sr = 36-46%). Measured diffusion coefficients
303
were close, with an average of 8×10⁻⁷ ±1×10⁻⁷ m2 s-1 (Figure 4A – orange triangles). These results
304
were also within the range of results predicted by the MMS model.
305 306
18 307
Figure 4. Measured diffusion coefficient De as a function of the degree of saturation for the
308
different tested materials: A) Till, B) Smurfit Kappa (SK), C) Billerud (B) and D) Field blend,
309
Vallsvik (V) and Iggesund (I). Results are indicated for the different mixing ratios and compared
310
with the MMS predictive model calculated for the minimum and maximum porosity of the tests
311
(dashed lines). Error bars are also shown.
312 313 314 315 316
19 3.2. Drying tests
317
The effect of drying and wetting cycles on the diffusion coefficient was tested on till-SK blends,
318
pure till, pure SK, and on the field blend (Figure 5). Results showed similar trend for all samples:
319
a sharp increase of De after the first or second drying phase, and then a somewhat more limited
320
increase for the subsequent drying cycles. Despite uncertainties in the estimation of Sr (which
321
could explain values exceeding 100% sometimes) the increase of De following drying seemed
322
significantly more important than predicted by MMS model. For example, the degree of saturation
323
of the Field blend after two drying cycles was approximately 88%; the measured effective
324
diffusion coefficient was around 2×10⁻⁷ m2 s-1, while MMS model predicted rather a value around
325
6×10⁻⁹ m2 s-1 (Figure 5). Measured values seemed to get closer to predicted values after a few
326
additional drying cycles, when the degree of saturation became smaller than about 70 to 80%.
327
328
Figure 5. Measured diffusion coefficient De during drying tests (decreasing degree of saturation);
329
a) high evaporation and b) moderate evaporation (see section 2.4 for details). Each point
330
corresponds to a drying phase. MMS predictive model calculated for minimum and maximum
331
porosity is shown (dashed lines).
20 4. Interpretation and discussion
333
4.1. Effect of GLD mixing on diffusion 334
The effective oxygen diffusion coefficient De of till and GLD mixes followed the same general
335
trend as for natural soil: it decreased with increasing degrees of saturation, first relatively slowly
336
for low degree of saturation, and then more abruptly when Sr exceeded around 80%. The range of
337
values measured (between 3×10⁻⁶ and 1×10-11 m2s-1) was typical for partly saturated soils, tailing
338
and other fine-grained porous materials (e.g. Aachib et al., 2004). Generally, the natural water
339
content of the GLD was not enough to reach sufficiently high degrees of saturation in the blend
340
(i.e. Sr ≥ 85%), and water addition would be required in the field after compaction so the sealing
341
layer can efficiently control oxygen diffusion. It is expected that a few seasons may be required
342
for the sealing layer to reach a maximum degree of saturation (as observed for moisture retaining
343
layers in covers with capillary barrier effects or CCBE; Bussière et al., 2009).
344
The addition of more and wetter GLD in the blend contributed to increase the final degree of
345
saturation of the mix, but also resulted in lower compaction (results not shown here, see Virolainen,
346
2018). In general, GLD addition tends to increase bulk porosity without any significant increase
347
of the degree of saturation (Sirén et al., 2016; Nigéus, 2018). This could have implications for the
348
long-term performance of till-GLD covers as increased porosity could make them more sensitive
349
to drying (reduced water retention properties), frost action, and root penetration.
350 351
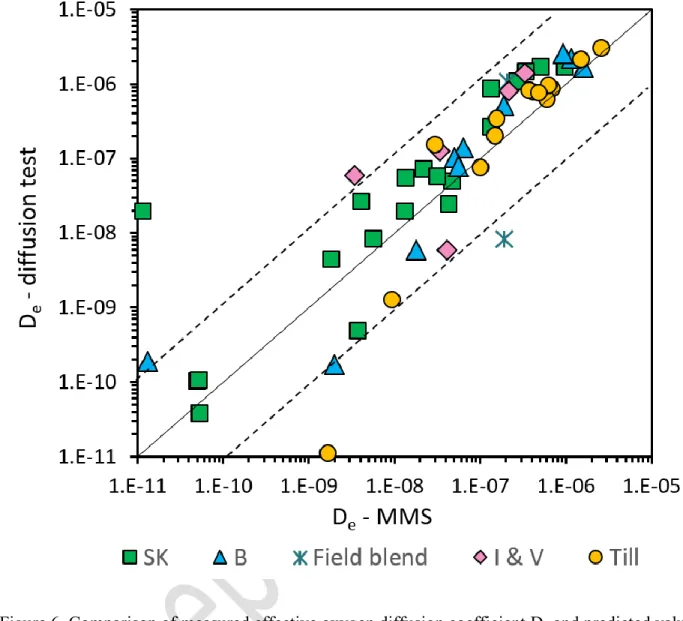
4.2. Predictive model 352
The MMS predictive model was able to predict the effective diffusion coefficient of most tests
353
with reasonable accuracy (i.e. within one order of magnitude of the measured value, and often less;
21
Figure 6). There was a slight tendency of the model to predict lower values than measured. This
355
could be an effect related to the uncertainty of Sr or some differences between measured and
356
effective Sr (also see discussion regarding mixing below). Diffusion tests for high degrees of
357
saturation are also more difficult to interpret because of a significantly lower oxygen concentration
358
decrease, resulting in greater uncertainties (Aachib et al., 2004; Toussaint, 2016). Overall, MMS
359
model seems reasonably reliable to predict the effective diffusion coefficient of till-GLD mixes,
360
independently of the amount or nature of GLD added. The model however tended to underestimate
361
the diffusion coefficient in the case of drying and wetting cycles, possibly because of some form
362
of hysteresis (see section 4.3).
363 364
22 365
Figure 6. Comparison of measured effective oxygen diffusion coefficient De and predicted values
366
calculated with MMS model (ref; see text for details). All the test results are presented for till,
367
Smurfit Kappa (SK), Billerud (B), Iggesund (I), Vallsvik (V) and field blend. Dashed lines indicate
368
the range within one order of magnitude from the 1:1 solid line.
369 370
4.3. Effect of drying 371
Drying tests showed a rapid increase of the diffusion coefficient with short (2 or 3 h) exposures to
372
the atmosphere for all nine tested materials. Within four hours of drying, De generally increased
23
by at least two orders of magnitude and the measured value was significantly higher than predicted
374
with MMS model. Also, the same trend was observed for all specimens, independently of the
375
amount of GLD added to the till. This result differed from previous studies which showed a
376
relatively good capacity of GLD to retain water at relatively high suctions (Hamberg and Maurice,
377
2013; Mäkitalo et al., 2014) and also till-GLD blends (Mäkitalo et al., 2015a; Nigéus, 2018). It is
378
expected that most of the water loss originate from the till which is more prone to desaturation.
379
Moreover, it was observed on several samples that the rather small quantity of mixed GLD (from
380
2.5 to 7.5%) was not spread evenly in all the till pores. However, the total water loss in the samples
381
during the drying tests was greater than the till initial water content or the added water, which
382
indicates that water must have been lost from the GLD as well.
383
Pure GLD was also tested in diffusion cells and some specimens were subjected to drying (results
384
not presented here). Pure GLD effective diffusion coefficient at saturation was smaller than 4×10
-385
11 m2 s-1 (equilibrium was not reached after 7 days of test). However, after one cycle of drying, the
386
diffusion occurred in only a few minutes. Shrinkage had most probably created preferential flow
387
paths between the specimen and the sides of cell. Even though this is very dependant of the
388
specimen size (thickness and diameter) and the test conditions, GLD appears to be very sensitive
389
to shrinkage. In a field application, such boundary effects would not occur, but desiccation cracks
390
may appear at the surface.
391
Shrinkage and rapid desaturation seemed therefore to significantly reduce the performance of
till-392
GLD mixes. These materials should therefore not be subjected to drying as they could lose their
393
ability to act as diffusion barriers. More tests, preferably on larger sample sizes and in field
394
conditions, also with different types of GLD, should be performed to confirm these observations.
24
The effect of rewetting should also be studied as the addition of water could contribute to swelling
396
and possible to the sealing of voids.
397 398
4.4. Considerations regarding cover design using till-GLD blends 399
Very low effective diffusion coefficients were measured in this study. For example, the diffusion
400
coefficient of the field blend (which is representative of the mixing achievable in the field site)
401
was smaller than 2×10-11 m2 s-1 when almost saturated, and hardly any diffusion occurred over
402
15 days even though the specimen was only 2.4 cm thick. In other words, a till GLD mix should
403
be able to efficiently control oxygen diffusion to reactive mine waste, as long as it remains close
404
to saturation and is not exposed to evaporation (section 4.3).
405
Previous numerical simulations showed that protection layers made of coarse till was efficient to
406
control evaporation and protect sealing layer from drying, even during extremely dry conditions
407
(Höglund and Herbert, 2004). Other results showed however, that slightly finer tills were not
408
efficient enough to prevent the exposition of sealing layer to evaporation during the summer
409
(Collin, 1998). The design of the protection layer can therefore be critical to ensure the long-term
410
performance of sealing layers made of till-GLD mixes. The design of the protective cover should
411
enhance infiltration to rapidly increase the degree of saturation of the sealing layer and act as
412
efficient protection against evaporation, drainage, erosion, freeze-thaw action, and root
413
penetration.
414 415 416
25 4.5. Experimental challenges
417
The results obtained in this study, yet promising, would need to be confirmed by other tests, on
418
other materials, and for larger scales (e.g. Demers et al., 2009). Some uncertainties remain,
419
essentially because of experimental errors. The largest uncertainty related to the diffusion tests
420
was the determination of the degree of saturation, related itself to the determination of the sample
421
volume. A relatively small error in the height measurement (±0.5 mm) could result in significant
422
variations in the determination of Sr (approximately ±10%). This sensibility, which has even more
423
effect on materials with a high degree of saturation (because of the great variations of De) was also
424
noted by Toussaint (2016) and is difficult to correct with the current design of the experiment.
425
The determination of specific gravities for GLD was also rather uncertain, because of the peculiar
426
nature of the material. Specific gravities determined in this study by gas pycnometer were
427
comparable to other values reported in the literature (Mäkitalo et al., 2014; Nigéus, 2018). Water
428
pycnometer results, however, were similar, but the standard deviation of those tests did not meet
429
quality assurance as specified in the standard. Two methods were also used for the determination
430
of GLD particle size distribution. The hydrometer test seemed, however, less suitable for GLD and
431
tended to overestimate largely the fraction of the finest particles (below 15-20 m) as the salt
432
content in the water increased. This was possibly a result of some dissolution of dregs altering the
433
density of the solution used during the tests.
434
Blending of till and GLD can also be complex. GLD tend to form small clumps in the till, because
435
of high water content and a certain “stickiness”. This could be seen both in the laboratory blends
436
that were mixed by hand and in the field blend that had been machine mixed (Nigéus et al., 2018).
437
Both methods result in small agglomerates of the GLD being evenly distributed in the material,
438
but not in every pore. Thus, when adding GLD to till, the calculated degree of saturation might be
26
relatively high, but the water will be concentrated to the GLD agglomerates, and the effective Sr
440
will be lower than the calculated Sr. Consequently, the till between agglomerates can remain drier
441
and allows for faster diffusion. This phenomenon did not have a significant effect on the results as
442
observed above, but it could influence the water retention capacity of the material and explain why
443
the diffusion increased so sharply upon drying. This would need however to be studied more
444
extensively. It is also recommended to make the distinction between the bulk degree of saturation
445
(measured as a whole) and the effective degree of saturation (which influences the diffusion of
446
oxygen). This was not possible in these tests, but could require the use of scanning techniques (e.g.
447
Salba et al., 2014). Scale effect and impact of higher compaction energy in the field (especially on
448
porosity) should also be studied by carrying out additional tests, including the sampling and testing
449 of undisturbed specimens. 450 451 5. Conclusion 452
This project evaluated the effective oxygen diffusion coefficient in blends of till and GLD, that
453
could potentially be used as sealing layer material. Results from the diffusion tests show a
454
significant variation of De with the degree of saturation and a generally good prediction by the
455
MMS model. The model was slightly less precise for high degrees of saturation (Sr > 80%). All
456
blends (2.5-7.5%) were able to reach low De, provided enough water was added to reach higher
457
degrees of saturation. The type and properties of the GLD didn’t seem to have a significant
458
influence on the effective oxygen diffusion coefficient.
27
Results also indicated that the till-GLD blends were highly sensitive to evaporation and should not
460
be exposed to drying. Therefore, in the case a till-GLD blend is used as sealing layer, it is critical
461
that the protective layer enhance water infiltration while efficiently preventing evaporation.
462
However, both GLD and till are highly variable materials and tests performed in this study should
463
not be directly extrapolated to other materials and conditions. The results still provide a first
464
attempt at evaluating the variability of the effective oxygen diffusion through these material blends
465
and at validating the precision of the MMS predictive model for blends. Further studies evaluating
466
the oxygen diffusion through till-GLD layers should include tests on larger and thicker samples
467
and use tills containing larger particle sizes to better represent field blends. Studies should also
468
focus on investigating drying of the blends with and without protection covers in natural field
469 conditions. 470 471 Acknowledgments 472
The project was financed by Mistra’s program “Closing the loop” (project GLAD), and the
473
European Union’s Horizon 2020 research and innovation program under grant agreement N°
474
730305 (project Paperchain). The internship at Polytechnique Montreal was financed by Prof.
475
Pabst personal starting grant and GeoRes Marie Skłodowska-Curie Research and Innovation Staff
476
Exchange (RISE) project (H2020-MSCA-RISE-2017) of the EC under grant agreement n. 778120.
477
The authors would also like to thank the industrial partners of the Research Institute on Mines and
478
Environment (RIME) UQAT-Polytechnique.
479 480
References 481
28 Aachib, M., Mbonimpa, M., & Aubertin, M. (2004). Measurement and prediction of the oxygen diffusion 482
coefficient in the unsaturated media, with applications to soil covers. Water, Air and Soil Pollution, 156: 483
163-193. 484
ASTM D422-63 (2007). Standard Test Method for Particle-size Analysis of Soils. ASTM International. 485
ASTM D5550-14 (2015). Standard Test Method for Specific gravity of Soils by Gas Pycnometer. ASTM 486
International. 487
ASTM D854–98 (2014). Standard Test Method for Specific Gravity of Soils. ASTM International. 488
Aubertin, M., Chapuis, R.P., Aachib, M., Bussière, B., Ricard, J.F., & Tremblay, L. (1995). Evaluation en 489
laboratoire de barrieres seches construites a partir de residus miniers. MEND Project 2.22.2a. CANMET, 490
Ottawa, 164 pp. 491
Aubertin, M., Bussière, B., Monzon, M., Joanes, A.M., Gagnon, D. Barbera, J.M., Aachib, M., Bédard, C., 492
Chapuis, R.P., & Bernier, L. (1999). Etude sur les barrières sèches construites à partir des résidus miniers. 493
Phase II , Essais en place. Rapport de Recherche, Projet CDT P1899. NEDEM/MEND 2.22.2c. 494
Aubertin, M., Aachib, M. & Authier, K. (2000). Evaluation of diffusive gas flux through covers with a 495
GCL. Geotextiles Geomembranes, 18: 215–233. 496
Aubertin, M., & Mbonimpa, M. (2001). Diffusion of oxygen through a pulp and paper residue barrier: 497
Discussion. Canadian Geotechnical Journal, 38(3): 658-660. 498
Aubertin, M., Bussière, B., & Bernier, L. (2002). Environnement et Gestion des Rejets Miniers. Published 499
by Presses Polytechnique Internationales. 500
Aubertin, M., Bussière, B., Pabst, T., James, M., & Mbonimpa, M. (2016). Review of reclamation 501
techniques for acid generating mine wastes upon closure of disposal sites. Proc. Geo-Chicago: 502
Sustainability, Energy and the Geoenvironment, Chicago, August 14-18. 503
29 Blowes, D.W., Ptacek, C.J., Jambor, J.L., Weisener, C.G., Paktunc, D., Gould, W.D., & Johnson, D.B. 504
(2014). The Geochemistry of Acid Mine Drainage. In: Treatise on Geochemistry (Second Edition), Holland 505
and Turekian (Eds), Vol. 11, 131–190. 506
Boulanger-Martel, V., Bussière, B., Côté, J., & Mbonimpa, M. (2015). Influence of freeze-thaw cycles on 507
the performance of covers with capillary barrier effects made of crushed rock-bentonite mixtures to control 508
oxygen migration. Canadian Geotechnical Journal, 53: 753–764. 509
Bussière, B. (2007). Colloquium (2004), Hydro-geotechnical properties of hard rock tailings from metal 510
mines and emerging geo-environmental disposal approaches. Canadian Geotechnical Journal, 44(9): 1019-511
1052. 512
Bussière, B., Potvin, R., Dagenais, A-M., Aubertin, M., Maqsoud, A., & Cyr, J. (2009). Restauration du 513
site minier Lorraine, Latulipe, Québec: résultats de 10 ans de suivi. Déchets, Sciences et Techniques 54: 514
49-64. 515
Chapuis, R.P. (1990). Sand–bentonite liners: predicting permeability from laboratory tests. Canadian 516
Geotechnical Journal, 27: 47-57. 517
Chtaini, A., Bellaloui, A., Ballivy, G., & Narasiah, S. (2001). Field investigation of controlling acid mine 518
drainage using alkaline paper mill waste. Water, Air and Soil Pollution, 125: 357–374. 519
Collin, M., &Rasmuson, A. (1988). A comparison of gas diffusivity models for unsaturated porous media. 520
Soil Science Society America Journal. 52: 1559-1565. 521
Collin, M. (1998). The Bersbo Pilot Project: Numerical simulation of water and oxygen transport in the soil 522
covers at the mine waste deposits. Swedish Environmental Protection Agency. Report 4763. 523
Crank, J (1975). The mathematics of diffusion. 2nd ed. Clarendon Press, Oxford. 524
30 Dagenais, A.M., Mbonimpa, M., Bussière, B., & Aubertin, M. (2012). A modified oxygen consumption 525
test to evaluate gas flux through oxygen barrier cover systems. Geotechnical Testing Journal, 35(1): 150-526
158. 527
Demers, I., Bussière, B., Mbonimpa, M., & Benzaazoua, M. (2009). Oxygen diffusion and consumption in 528
low sulphide tailings covers. Canadian Geotechnical Journal, 46: 454–469. 529
Elberling, B., Nicholson, R.V., Reardon, E.J., & Tibble, P. (1994). Evaluation of sulphide oxidation rates: 530
A laboratory study comparing oxygen fluxes and rates of oxidation product release. Canadian Geotechnical 531
Journal, 13: 375–383. 532
Guittonny-Larchevêque M., Bussière B., & Pednault C. (2016) Tree–Substrate Water Relations and Root 533
Development in Tree Plantations Used for Mine Tailings Reclamation Journal of Environmental Quality, 534
45(3): 1036-1045. 535
Hamberg, R., & Maurice, C. (2013). Karaktärisering av grönlutslam för efterbehandling av gruvavfall. 536
Luleå Tekniska Universitet. 537
Höglund, L.O., Herbert, R.B., Lövgren, L., Öhlander, B., Neretnieks, I., Moreno, L., Malmström, M., 538
Elander, P., Linvall, M., & Lindström, B. (2004). MiMi − Performance assessment: Main report. MiMi 539
Report 2003:3. Print. Luleå, Stockholm. 540
Jia, Y., Stenman, D., Mäkitalo, M., Maurice, C., & Öhlander, B. (2013). Use of amended tailings as mine 541
waste cover. Waste and Biomass Valorization, 4(4): 708–718. 542
Jia, Y., Maurice, C. & Öhlander, B. (2014). Effect of the alkaline industrial residues fly ash, green liquor 543
dregs, and lime mud on mine tailings oxidation when used as covering material. Environmental Earth 544
Science, 72: 319–334. 545
31 Jia, Y., Stahre, N., Mäkitalo, M., Maurice, C., & Öhlander, B. (2017). Element mobility in sulfidic mine 546
tailings reclaimed with paper mill by-products as sealing materials. Environmental Science and Pollution 547
Research, 24: 20372-20389. 548
Lindsay, M.B.J., Moncur, M.C., Bain, J.G., Jambor, J.L., Ptacek, C.J., & Blowes, D.W. (2015). 549
Geochemical and mineralogical aspects of sulfide mine tailings. Applied Geochemistry 57: 157–177. 550
Lottermoser, B. (2010). Mine Wastes – Characterization, treatment and Environmental Impacts. 3rd ed. 551
Springer – Verlag, Berlin Heidelberg. 552
Mäkitalo, M., Jia, Y., Maurice, C., & Öhlander, B. (2014). Characterization of green liquor dregs, 553
potentially useful for prevention of the formation of acid rock drainage. Minerals, 4: 330-344. 554
Mäkitalo, M., Mácsik, J., Maurice, C., & Öhlander, B. (2015a). Improving properties of sealing layers made 555
of till by adding Green liquor dregs to reduce oxidation of sulfidic mine waste. Journal of Geotechnical and 556
Geological Engineering, 33(4): 1047-1054. 557
Mäkitalo, M., Stenman, D., Ikumpayi, F., Maurice, C., & Öhlander, B. (2015b). An evaluation of using 558
various admixtures of green liquor dregs, a residual product, as sealing layers on reactive mine tailings. 559
Mine Water and the Environment, 35(3): 283-293. 560
Mäkitalo, M., Lu, J., Maurice, C. & Öhlander, B. (2016). Prediction of the longterm performance of green 561
liquor dregs as a sealing layer to prevent the formation of acid mine drainage. Journal of Environmental 562
Chemical Engineering, 4(2): 2121–2127. 563
Martins, F.M., Martins, J.M., Ferracin, L. C., & da Cunha, C. J. (2007). Mineral phases of green liquor 564
dregs, slaker grits, lime mud and wood ash of a Kraft pulp and paper mill. Journal of Hazardous Materials, 565
147: 610-617. 566
Mbonimpa, M., Aubertin, M., Aachib, M., & Bussière, B. (2003). Diffusion and consumption of oxygen in 567
unsaturated cover materials. Canadian Geotechnical Journal, 40: 916-932. 568
32 Millington, R.J. & Quirk, J.P. (1961). Permeability of porous solids. Transaction of the Faraday Society, 569
57: 1200-1207. 570
Millington, R.J. & Shearer, R.C. (1971). Diffusion in aggregated porous media. Soil Science, 111(6): 372-571
378. 572
Nicholson, R., Gillham, R., Cherry, J., & Reardon, E. (1989). Reduction of acid generation in mine tailings 573
through the use of moisture-retaining cover layers as oxygen barriers. Canadian Geotechnical Journal, 26: 574
1-8. 575
Nigéus, S. (2018). Green liquor dregs-amended till to cover sulfidic mine waste. Lic. thesis. Luleå 576
University of Technology. 577
Nigéus, S., Mácsik, J., Maurice, C., Eriksson, N., Odén, P., Embile, R. Jr., Lindgren, L. Rönnblom Pärsson, 578
E., & Westin, G. (2018). Paperchain- Implementation of circular case 5 D5.1 October 2018 (M17). 579
Deliverable No. 5.1. EU 2020 Research and innovation program. 580
Nordstrom, D.K., Blowes, D.W., & Ptacek, C.J. (2015). Hydrogeochemistry and microbiology of mine 581
drainage: An update. Applied Geochemistry, 57: 3-16. 582
Pabst, T., Bussière, B., Aubertin, A., & Molson, J. (2018). Comparative performance of cover systems to 583
prevent acid mine drainage from pre-oxidized tailings: A numerical hydro-geochemical assessment. Journal 584
of Contaminant Hydrology, 214: 39-53. 585
Ragnvaldsson, D., Bergknut, M., Lewis, J., Drotz, S., Lundkvist, A., Abrahamson, K., & Fernerud, S. 586
(2014). A novel method for reducing acid mine drainage using green liquor dregs. Environmental 587
Chemistry Letters, 12(3): 443-447. 588
Saba, S., Barnichon, J.D., Cui, Y.J., Tang, A.M., & Delage, P. (2014). Microstructure and anisotropic 589
swelling behaviour of compactedbentonite/sand mixture. Journal of Rock Mechanics and Geotechnical 590
Engineering, 6: 126-132. 591
33 Sirén, S., Maurice, C., and Alakangas, L. (2016) Green liquor dregs in mine waste remediation, from 592
laboratory investigations to field application. In conference proceedings: Mining meets waste, conflict and 593
solution. IMWA 2016 in Leipzig, Germany, July 11-15, 2016. p. 706-713. TU Bergakademie Freiberg, 594
Institute of mining and special civil engineering. 595
Toussaint, R. (2016). Influences des caractéristiques physico-chimiques de résidus miniers sulfureux sur 596
leur réactivité à l'oxygène. Master Thesis, Polytechnique Montréal. 597
Vick, S.G. (2001). Stability aspects of long-term closure for sulphide tailings. Proc. Safe Tailings Dams 598
Constructions, Gaellivare, Sweden, 12 p. 599
Villain, L. (2008). Pulping Wastes and Abandoned Mine Remediation – application of green liquor dregs 600
and other pulping by-products to the solidification/stabilisation of copper mine tailings. Master thesis. Luleå 601
University of Technology. 602
Virolainen, A. (2018). Evaluating the effective oxygen diffusion coefficient in blends of till and green liquor 603
dregs (GLD) used as sealing layer in mine waste covers. Master thesis. Luleå University of Technology. 604
Yanful, E. (1993). Oxygen diffusion through soil covers on sulphidic mine tailings. Journal of Geotechnical 605
Engineering, 119(8): 1207-1228. 606