HAL Id: hal-03031926
https://hal.archives-ouvertes.fr/hal-03031926
Submitted on 23 Mar 2021HAL is a multi-disciplinary open access archive for the deposit and dissemination of sci-entific research documents, whether they are pub-lished or not. The documents may come from teaching and research institutions in France or abroad, or from public or private research centers.
L’archive ouverte pluridisciplinaire HAL, est destinée au dépôt et à la diffusion de documents scientifiques de niveau recherche, publiés ou non, émanant des établissements d’enseignement et de recherche français ou étrangers, des laboratoires publics ou privés.
Effect of Fly Ash on microstructural and resistance
characteristics of dredged sediment stabilized with lime
and cement
Ana Paula Furlan, Andry Razakamanantsoa, Harifidy Ranaivomanana, Ouali
Amiri, Daniel Levacher, Dimitri Deneele
To cite this version:
Ana Paula Furlan, Andry Razakamanantsoa, Harifidy Ranaivomanana, Ouali Amiri, Daniel Levacher, et al.. Effect of Fly Ash on microstructural and resistance characteristics of dredged sediment sta-bilized with lime and cement. Construction and Building Materials, Elsevier, 2020, 272, pp.121637. �10.1016/j.conbuildmat.2020.121637�. �hal-03031926�
Construction and Building Materials
Effect of Fly Ash on microstructural and resistance characteristics of dredged sediment
stabilized with lime and cement
--Manuscript
Draft--Manuscript Number: CONBUILDMAT-D-20-06024R1 Article Type: Research Paper
Keywords: dredged sediment; Fly ash; Soil stabilization; mechanical resistance; microstructure Corresponding Author: Andry Rico RAZAKAMANANTSOA, Ph.D
IFSTTAR Site de Nantes
NANTES, BOUGUENAIS FRANCE First Author: Ana Paula FURLAN, PhD
Order of Authors: Ana Paula FURLAN, PhD
Andry Rico RAZAKAMANANTSOA, Ph.D Harifidy RANAIVOMANANA, PhD Ouali AMIRI, PhD
Daniel LEVACHER, PhD Dimitri DENEELE, PhD
Abstract: Contribution of fly ash (FA) as a complementary additive for dredged sediment (DS) stabilization was studied. The study is focused on definition of an efficient
combination(s) to raise the DS properties. FA with lime and cement with both was used. Then, micro and macroscale investigations was performed. Test results demonstrate that FA additions promoted nucleation, formation of cementitious compounds and fabric modifications in sediment. DS stabilized using FA component show lower shrinkage and higher mechanical resistance than that stabilized using conventional binders. FA is found to be efficient in sediment-lime and sediment-cement mixtures since it accelerates cementation and strength gain.
Effect of Fly Ash on microstructural and resistance characteristics of dredged
1
sediment stabilized with lime and cement
2 3
Ana Paula FURLANa,b, Andry RAZAKAMANANTSOAb, Harifidy RANAIVOMANANAc, Ouali AMIRIc,
4
Daniel LEVACHERd, Dimitri DENEELEb,e
5 6
a Dept. of Transportation Engineering, Sao Carlos School of Engineering, University of Sao Paulo, EESC, USP, Sao 7
Carlos, Brazil
8
b GERS-GIE, Université Gustave Eiffel, IFSTTAR, F-44344 Bouguenais, France 9
c GEM,UMR, CNRS 6163, IUT de Saint-Nazaire, Rue Michel Ange 44600 10
d M2C, UMR 6143, University Caen-Normandy, F-14000 Caen, France 11
e Institut des Matériaux Jean Rouxel de Nantes, Université de Nantes, CNRS, 2 chemin de la Houssinière, BP 12
32229, 44322 Nantes Cedex 3, France
13 14
Highlights 15
- FA acts as filler when incorporated with sediment at early age 16
- FA promotes nucleation, cementitious compound growth resulting in porosity refinement 17
- FA reduces shrinkage and increases strength gain of mixtures, regardless curing time 18
- The effectiveness of FA addition is confirmed when used with sediment-lime and sediment-cement 19
20
Abstract 21
This study deals with the definition of an efficient combination of fly ash (FA) with lime or cement and 22
with both, to improve the dredged sediment (DS) properties. At early age, filler and nucleation effects 23
of FA lead to a refinement of the microstructure in addition to the macro porosity reduction induced 24
by lime and cement. At long term, the microstructure becomes denser due to the pozzolanic property 25
of FA. At macroscale, DS stabilized using FA show lower shrinkage and higher mechanical resistance 26
than that stabilized without FA, with more pronounced effects when FA is mixed with cement. 27
28
Key words: dredged sediment, fly ash, soil stabilization, mechanical resistance, microstructure 29
30
1. Background 31
Selection of pavement materials is based on mechanical properties such as strength and stiffness. This 32
procedure is adequate in case of raw and inert materials are used. In stabilized materials, physical 33
changes and chemical reactions take place [1][2]. Therefore, it is important to identify modifications 34
Manuscript(For revision, upload clean version of revised paper) Click here to view linked References
1 2 3 4 5 6 7 8 9 10 11 12 13 14 15 16 17 18 19 20 21 22 23 24 25 26 27 28 29 30 31 32 33 34 35 36 37 38 39 40 41 42 43 44 45 46 47 48 49 50 51 52 53 54 55 56 57 58 59 60 61
which occur at different levels, in order to determine how the action mechanisms of different additives 35
affect soil resistance. 36
Multiscale analysis leads to a comprehensive knowledge of improvement of stabilized soil using 37
hydraulic binders. In such a way that microscale analysis provides evidences of pozzolanic reactions, 38
cementing material formation and evolution of crystalline phases, and macroscale analysis explains 39
enhances in mechanical properties resulted from previous interaction highlighted at microscale level 40
[3][4]. 41
At present time, Portland cement and lime are considered as the most convenient stabilizers for soil 42
[2]. In soils stabilized using Portland cement, soil gradation changes since cement grains may fill a little 43
portion of the soil voids [5] [6]. Hence, cement hydration is responsible for the significant strength gain 44
over time. The mechanism of interaction between the different components can be explained as 45
follows: Portland cement hydrates using available water in the soil and form a stone-like material 46
[3][7]. 47
Typical mineral components of Portland cement are calcium and silicon which are often in the form of 48
oxides, such as CaO, SiO2, Al2O3 and FeO2.The main clinker constituents are tricalcium silicate(C3S), 49
dicalcium silicate (C2S), tricalcium aluminate (C3A), and calcium ferroaluminate (C4AF). To control 50
reaction rate, gypsum (CSH2) might be added to cement. 51
It is known that the hydration of clinker constituents produces cementitious compounds such as 52
calcium silicate hydrates (C-S-H), calcium hydroxide (CH). In pre induction of hydration, cement reacts 53
with the available water and the most active phase C3S produces calcium ions and OH-, SO2-4, K+, Na+.
54
In dormant stage, C3S hydration continues and C2S begins to be hydrated. CH separates from hydrolysis 55
of C3S and C2S and may precipitate into empty voids. Ettringite (Ett) also forms due to the reaction of 56
gypsum with C3S and C4AF [8]. 57
Over time (at early stage), C-S-H crystalline phases form an acicular morphology which branch, forming 58
a honeycomb-shape structure. CH crystallizes in large crystals (~40μm), presenting hexagonal plate-59 1 2 3 4 5 6 7 8 9 10 11 12 13 14 15 16 17 18 19 20 21 22 23 24 25 26 27 28 29 30 31 32 33 34 35 36 37 38 39 40 41 42 43 44 45 46 47 48 49 50 51 52 53 54 55 56 57 58 59 60
shape, depending on the produced lime amount in early stages and the available free space. Ettringite 60
crystalizes in a needle-shape, with length up to 10μm and diameter of 0.25 μm, which does not branch. 61
All aforementioned phases and processes have been observed in cement-based materials, included in 62
soil-cement mixtures [3][7][9]. 63
At microscale level, when cement is mixed with soil, the soil-cement mixture presents a significant gain 64
of mechanical strength. Soil-cement strength results from cementation bonds and pore space 65
reduction [10][11]. Accordingly, cementitious compounds fill up the pores and connect cement grains 66
resulting in the increase in intra-aggregate pore volume [12]. 67
When lime is used in soil stabilization, soil fabric changes since lime addition induces cation exchanges 68
and generates flocculation/agglomeration mechanism, in short term. In other words, water dissolves 69
some constituents of lime (CaO, CaSO4, MgO and quartz) that react with soil and reduce double diffuse 70
layer (DDL), resulting in flocculation (agglomeration). This process reduces soil plasticity and improves 71
workability [13]. Over time, pozzolanic reactions take place at alkaline environment (pH=12), forming 72
cementitious compounds i.e. C-S-H and C-A-S-H, that are responsible for increasing of long-term 73
strength [3][10]. 74
At microscale level, soil-lime strength gain is also explained based on the formation of cementitious 75
compounds from pozzolanic reactions. However, the increase of soil resistance generated by lime 76
addition is less significant than that observed in mixtures using cement; and the use of lime is 77
preferably recommended for clayey soils, in order to improve soil fabric, plasticity and workability [1] 78
[2][13]. It is also worth noting that the mechanical properties of lime-treated soils are affected by the 79
curing temperature. By studying the stiffness evolution of a silt soil stabilized with quicklime cured at 80
30 °C, Silva et al. [14] observed two different stages on the stiffness evolution suggesting the existence 81
of two different chemical phenomena involved. Evolution in the first stage seems to be mostly related 82
to the formation of calcium aluminate hydrates (CAH). However, the evolution in the second stage can 83
be more related to a structural rearrangement of CAH and the formation of calcium silicate hydrates 84 1 2 3 4 5 6 7 8 9 10 11 12 13 14 15 16 17 18 19 20 21 22 23 24 25 26 27 28 29 30 31 32 33 34 35 36 37 38 39 40 41 42 43 44 45 46 47 48 49 50 51 52 53 54 55 56 57 58 59 60 61
(CSH). These two distinct stages involved in the evolution of elastic modulus (E) with time suggest the 85
existence of two apparent activation energies (one for each process). 86
To maximize the benefits of soil stabilization, a binary or ternary combination of hydraulic binder is 87
proposed. Most of the time, lime and cement combination is recommended. Lime-cement stabilization 88
combines workability enhancement from lime addition and resistance gain from cement addition. Both 89
additives may be mixed without disturbing their own action mechanism. However, multicomponent 90
mixed materials show differences in physical and chemical properties due to coexistence of cement 91
hydration and mineral admixtures, changing hydration kinetics process and microstructure formation 92
mechanisms [15]. According to [16] [17], the dosage of cement and the water content have a 93
significant impact on unconfined compression strength (UCS) values. By testing soil-cement mixtures 94
with dosage of cement between 10 and 13%, Ribeiro et al. [17] observed that UCS is always larger for 95
highest dosage of cement independently from the water to cement ratio, whereas independently from 96
the dosage of cement, there is a clear optimum water content providing the maximum UCS value. 97
Finally, compressive strength develops faster with time when larger water and cement ratios are 98
adopted. For treatment using lime, the effects of molding water content on UCS values seems to be 99
insignificant independently from the dosage of lime [18]. 100
For sustainable development purpose, the use of local soil, waste and industrial byproduct are 101
encouraged to supply earthwork and earthen structure [6][19][20]. Two well-known industrial 102
byproducts are often cited: bottom ash and fly ash. The benefits of use of bottom ash for road 103
construction was been recently studied by different authors [21], [22], [23]. On the other hand, the 104
use of fly ash still requires further investigation because different mechanisms of interaction need to 105
be clarified. 106
Researches in concrete technology has demonstrated that fly ash (FA) improves mechanical properties 107
of concrete, reduces the costs of production and is ecologically beneficial. FA addition may enhance 108
durability of the matrix and reduces the loss of heat energy during cement hydration [15][24]. 109 1 2 3 4 5 6 7 8 9 10 11 12 13 14 15 16 17 18 19 20 21 22 23 24 25 26 27 28 29 30 31 32 33 34 35 36 37 38 39 40 41 42 43 44 45 46 47 48 49 50 51 52 53 54 55 56 57 58 59 60
FA is a waste from coal-fired electrical power plants that is being studied as admixture in soil 110
stabilization [6][12][20]. Commonly, FA is composed by calcium, silicon and aluminium. The main 111
oxides are CaO, SiO2 and Al2O3. Class C Fly ash contains about 20% of CaO which might induce cation 112
exchanges, flocculation and pozzolanic reactions, resulting in strength gain. Aluminum rich 113
composition of FA might promote a specific cementitious compounds formation, such as CAH and 114
CASH [3][7][25]. 115
In concrete, FA addition stimulates reaction rate of cement hydration, promotes nucleation and 116
growth of cementitious compounds. However, FA may also retard the onset of acceleration (Stage III 117
of hydration) because of (i) inhibition of CH precipitation due to the formation of water containing 118
organic species and (b) slows formation of Ca rich surface layers on clinker phases, in the case of 119
aluminum rich FA [26]. 120
The effects of FA action on soils are then physical and chemical. At physical point of view, finer particles 121
of FA would fill voids of soil particles. Chemically, pozzolanic products induced by FA presence would 122
fill pores. Both effects reduce porosity so that microstructure becomes denser. As results, strength and 123
stiffness are increased and compressibility is reduced [27]. 124
Research findings suggest that FA disperses clusters of soil and strength development is controlled by 125
FA hydration [20][28][29], leading to an analogy with the aforementioned processes in cement pastes. 126
It is worth noting that water content of the fly ash stabilized soil mixture affects the strength [30]. The 127
maximum strength reached in soil-fly ash mixtures generally occurs at moisture contents below 128
optimum moisture content for density. For silt and clay soils the optimum moisture content for 129
strength is generally four to eight percent below optimum for maximum density while for granular 130
soils the optimum moisture content for maximum strength is generally one to three percent below 131
optimum moisture for density. Therefore, it is crucial that moisture content be controlled during 132
construction. Initial water content significantly affects the efficiency of soil stabilization. 133 1 2 3 4 5 6 7 8 9 10 11 12 13 14 15 16 17 18 19 20 21 22 23 24 25 26 27 28 29 30 31 32 33 34 35 36 37 38 39 40 41 42 43 44 45 46 47 48 49 50 51 52 53 54 55 56 57 58 59 60 61
In soil stabilization, FA addition alone is not sufficient to significantly increase strength to the design 134
allowable levels, then a combination with other additives is required [29]. Particular attention must be 135
paid when FA is added to soil-cement mixture. FA may compete with cement for the water available 136
in the soil. This competition may be detrimental to cement hydration and it is more problematic in soil-137
cement because of the typical low water and cement ratio (w/c). 138
Interestingly, in binary combination involving lime and FA, stabilized soils present some benefits 139
resulting in strength gain. Notwithstanding, Sivapullaiah and Jha [29] indicate that there may be 140
particular FA contents to find greater resistance in the short and long term, respectively. Low contents 141
of FA increase strength in 28 days, whereas high contents of FA increase strength in 4-7 days. Generally, 142
FA in soil-lime changes the rate of strength gain and not the strength itself. Therefore, FA content up 143
to 15% is recommended. The effects of initial water content on the compressibility, strength, 144
microstructure, and composition of a lean clay soil stabilized by compound calcium-based stabilizer 145
composed of cement, lime and fly ash was investigated by Yin et al. [31]. It was observed that as the 146
initial water content increases in the range studied (from 11 to 19%), both the compaction energy and 147
the maximum compaction force decrease linearly and there are less soil aggregates or agglomerations, 148
and a smaller proportion of large pores in the compacted mixture structure. In addition, for specimens 149
cured with or without external water supply and under different compaction degrees, the variation 150
law of the unconfined compressive strength with initial water content is different and the highest 151
strength value is obtained at various initial water contents. Finally, with the increase of initial water 152
content, the percentage of the oxygen element tends to increase in the reaction products of the 153
calcium-based stabilizer, whereas the primary mineral composition of the soil-stabilizer mixture did 154
not change notably. 155
Regarding the microstructure organization, Furlan et al. [6] demonstrate that FA addition refines the 156
pore structure prior the development of pozzolanic reaction. This previous study demonstrates that 157
FA can be used as soil stabilization additive. However, some question related to the reactivity of FA 158
combined with other chemical additive requires further investigation. This paper aims to investigate 159 1 2 3 4 5 6 7 8 9 10 11 12 13 14 15 16 17 18 19 20 21 22 23 24 25 26 27 28 29 30 31 32 33 34 35 36 37 38 39 40 41 42 43 44 45 46 47 48 49 50 51 52 53 54 55 56 57 58 59 60
the contribution of FA in soil stabilization using hydraulic binders, with the purpose of finding: (i) 160
technically compatible material options, (ii) rational use of waste and byproducts and (iii) optimized 161
mix dosage. 162
2. Experimental program 163
Chemical stabilization of soils induces physicochemical changes of soils characteristics due to chemical 164
interactions between additives and soil. These changes imply improvements in the mechanical 165
behavior of the soil. Therefore, a multiscale analysis was selected in order to provide a holistic 166
knowledge of the stabilization mechanisms. 167
If, on the one hand, microscopic analysis can show the new cementing products resulting from 168
chemical reactions, on the other hand, it is worth quantifying their impacts on mechanical 169
performance improvement of stabilized soils. Then, measurements of design and mechanical 170
properties are necessary. Moreover, the combined use of these techniques allows to relate the 171
changes in different scales, in order to highlight advantages and disadvantages of chemical 172
stabilization. 173
Thus, the present experimental program aims to respond these questions, demonstrating the 174
beneficial of using fly ash as a complementary additive in soil stabilization, indeed, when combined 175
with conventional hydraulic binders. 176
In this study, dredged sediment from La Baule Le Pouliguen Harbor, France, and two cementitious 177
additives were used. Fly ash was added to mixtures containing lime, cement and lime and cement. 178
Only chemical stabilization was made (so without gradation correction) in order to find the best 179
combination of additives to improve the characteristics of this dredged soil considered as waste, 180
regarding economic and environmental aspects. 181 2.1. Materials 182 1 2 3 4 5 6 7 8 9 10 11 12 13 14 15 16 17 18 19 20 21 22 23 24 25 26 27 28 29 30 31 32 33 34 35 36 37 38 39 40 41 42 43 44 45 46 47 48 49 50 51 52 53 54 55 56 57 58 59 60 61
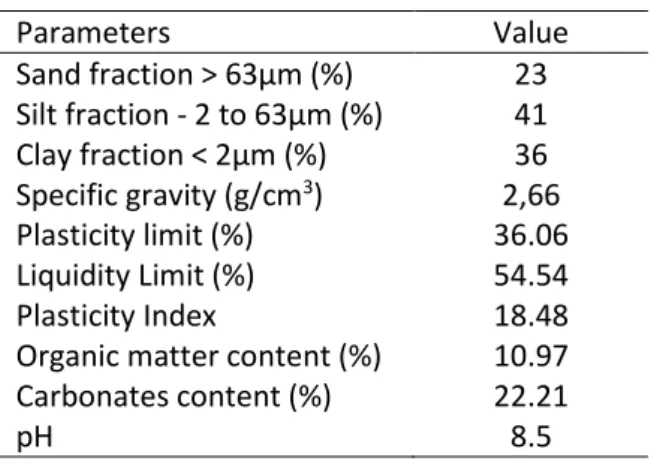
The geotechnical properties of the sediment were carried out in accordance with GTR guide [32] 183
dedicated for embankment and pavement applications. Table 1 shows results of soil characterization 184
based on results of maximum specific gravity, and organic material, pH and carbonates contents. 185
Table 1. Geotechnical properties of sediment 186 Parameters Value Sand fraction > 63µm (%) 23 Silt fraction - 2 to 63µm (%) 41 Clay fraction < 2µm (%) 36 Specific gravity (g/cm3) 2,66 Plasticity limit (%) 36.06 Liquidity Limit (%) 54.54 Plasticity Index 18.48
Organic matter content (%) 10.97 Carbonates content (%) 22.21
pH 8.5
187
Proviacial® ST quicklime was added to the sediment soil. The quicklime was provided by LHOIST from 188
Dugny-sur-Meuse, in Lorraine, France. This lime contains at least 90% of calcium oxide and at 189
maximum 2% of magnesium oxide. The lime content added to soil was 2%. 190
Portland cement was a CEM II/B-LL 32,5R CE CP2 (French Standard) whose short-term resistance is 191
32.5 MPa. Clinker content is between 65 and 79%, being its chemical constituents: tricalcium silicate 192
(66%), dicalcium silicate (10%) and tricalcium aluminate (7%). Limestone is the main natural 193
component of this cement, presenting a total organic material less than 0.20% in mass. The cement 194
content added to soil was 7% of the dry mass of the sediment. 195
Sodeline® Fly ash is manufactured and was provided by the central Emile Huchet in Saint Avold, France.
196
The main constituents of this fly ash are silicon dioxide(47.36%), aluminum oxide(21.63%) and calcium 197
oxide (8.52%). It is important to point out that sulfur content (4.02%) is higher than the conventional 198
ones. The fly ash content added to soil was 9%. 199
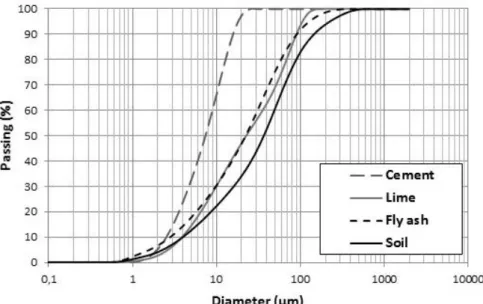
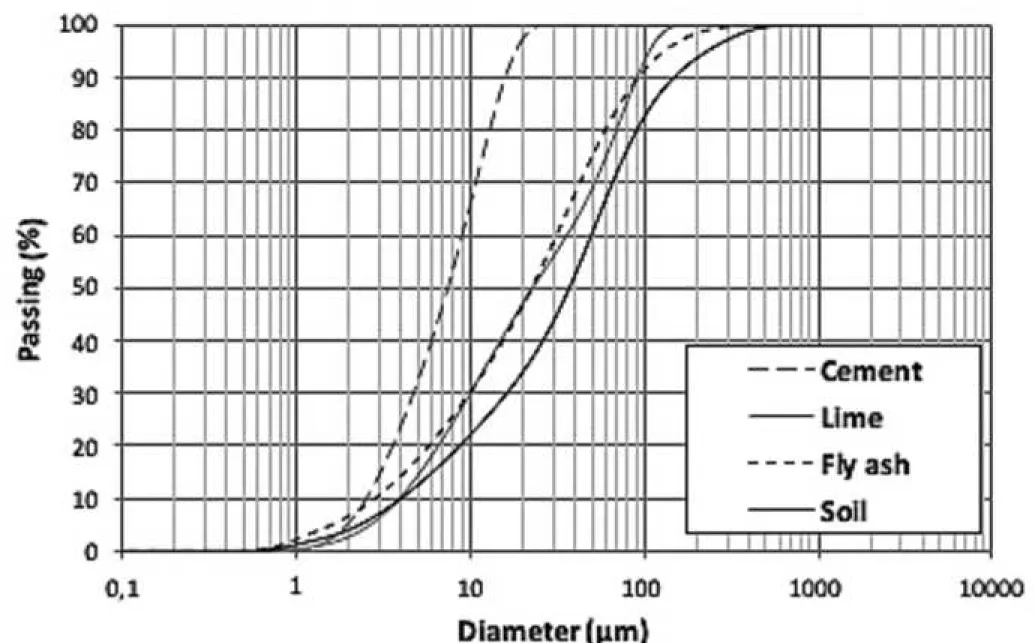
The particle size distribution of sediment, hydraulic binders and fly ash are summarized in Figure 1. 200
The particle size distributions help to understand the contribution of binders on the sediment particle 201
arrangement. The particle size distributions were carried out with Malvern mastersizer. 202 1 2 3 4 5 6 7 8 9 10 11 12 13 14 15 16 17 18 19 20 21 22 23 24 25 26 27 28 29 30 31 32 33 34 35 36 37 38 39 40 41 42 43 44 45 46 47 48 49 50 51 52 53 54 55 56 57 58 59 60
203
Figure 1: Grain size distribution of materials 204
Comparing the curves from Figure 1, it can be observed that the sediment is composed with coarsest 205
material (D90 =150 μm), with particle diameters between 500 and 1 μm; and cement is the finest binder 206
compared to lime and FA (D90 =15 μm), with particle diameters between 10 and 2 μm, that is also the 207
most uniform distribution. Particle-size distributions of lime and FA are quite similar (D90 =90 μm), with 208
particle diameters between 200 and 0.8 μm. 209
2.2. Procedures of specimen preparation 210
Raw sediments have been oven-dried at 50°C for 48h prior to the treatment process. The sediment 211
mixtures considered in this study are respectively formulated with 2% lime (S2L), 7% cement (S7C) or 212
2% lime and 7% cement (S2L7C). The percentages considered here correspond to the dry mass of 213
sediment. A binary or ternary binder mixture has also been proposed for the mixture including fly ash 214
(FA). The rate of fly ash addition, which is equal to 9%, represents the sum of the standard binder rates 215
used, i.e. 2% lime and 7% cement: S2L9FA, S7C9FA, S2L7C9FA. 216
Proctor tests were performed according to French standard (NF P94-093) to get the optimum 217
parameters of the mixtures, that is optimum water content and maximum dry density. All mixtures 218
were prepared based on several precedent dosages [33]. In addition to mixture design, shrinkage tests 219 1 2 3 4 5 6 7 8 9 10 11 12 13 14 15 16 17 18 19 20 21 22 23 24 25 26 27 28 29 30 31 32 33 34 35 36 37 38 39 40 41 42 43 44 45 46 47 48 49 50 51 52 53 54 55 56 57 58 59 60 61
have been carried out to measure the effect of the binder on the volumetric strain of the compacted 220
mixtures. Mixtures were compacted at their optimum characteristics in an oedometric cell of 101 mm 221
in diameter and 7mm thick. 222
Specimens for UCS test were prepared according to Proctor optimum parameters. Mixing procedure 223
considered the addition of extra amount of water due to the binder presence, in order to preserve the 224
optimum Proctor parameters. Thus, water content was increased in 1% for each percentage of added 225
lime, 0.4% for each percentage of added cement, and 0.1% for each percentage of added fly ash. 226
Before compaction, the mixtures using lime underwent a previous period of 2 hour in a closed recipient 227
for the former reactions of lime and to avoid carbonation reactions. Cylindrical specimens 228
(76mmx38mm) were statically compacted. After compaction, specimens were packed in plastic film, 229
to prevent the loss of moisture during curing. Curing was made in a room at controlled temperature 230
(20±1°C) in different times, namely: 7, 28 and 90 days. 231
An extra specimen of each mixture was produced for the microstructure investigation. Cubic samples 232
(10mm3) were sampled and freeze-dried from a compacted specimen at 7 and 28 days. To stop the
233
hydration and chemical reactions of the binders, cubic samples had the water removed by sublimation. 234
2.3. Methods 235
Unconfined compression strength (UCS) tests were performed according to French standard (NF P94-236
420) under a constant strain rate of 1mm/min. After test, water content (w) was measured by oven 237
drying method at 105°C. In total, 3 specimens were tested and all results represent the average value 238
of UCS and w. 239
The volumetric deformation induced by shrinkage was followed until full stabilization within 9 days for 240
all mixture. Volumetric deformation of all samples was monitored by means of a digital caliper. 241
Microscale analysis was based on X-ray diffraction (XRD) analyses, Scanning Electron Microscopy (SEM) 242
observations and Mercury intrusion porosimetry (MIP) measurements. 243 1 2 3 4 5 6 7 8 9 10 11 12 13 14 15 16 17 18 19 20 21 22 23 24 25 26 27 28 29 30 31 32 33 34 35 36 37 38 39 40 41 42 43 44 45 46 47 48 49 50 51 52 53 54 55 56 57 58 59 60
XRD analyses were used not only to identify the crystallized component resulting from the hydration 244
of cement and pozzolanic reactions but also to characterize sediment matrix. The XRD analyses were 245
performed on powder using a Brucker diffractometer with a detector over the range 5°80°2θ using Cu-246
Kα1 radiation (1.55Å). Diffractometer operated with input voltage of 30 kV and current of 10mA. 247
Crystallography Open Database (COD) was used to identify constituents and new crystalline phases in 248
the patterns. 249
SEM images were used to investigate the mineral phases resulting from the interaction between the 250
sediment and the binder components. SEM observations were carried out using a FEI Inspect F-50 SEM 251
instrument coupled to an energy dispersive X-ray analyzer (EDX). To improve the image quality, 252
samples are coated with gold. 253
The impact of the mineral compound development on the sediment structure resulting from hydration 254
mechanism of the binder mixture was followed by the pore distribution. The pore size distributions 255
were plotted from MIP data obtained with Micromeritics Autopore IV. 256 3. Results 257 3.1. Microstructure investigation 258 3.1.1. Microstructure investigation by XRD 259
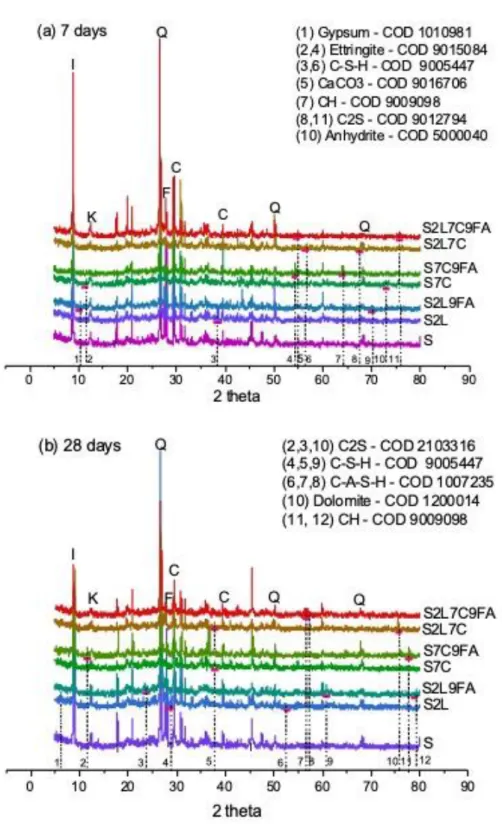
The main strength gain in chemical stabilized soil is mostly attributed to cementitious compounds 260
formed from cement hydration and/or pozzolanic reactions. Figure 2 shows XRD patterns of all 261
mixtures at 7 and 28 days. These patterns compare mixtures with original soil, in order to identify new 262
crystalline phases addressed to chemical reactions. Different curing times are considered in attempt 263
to evidence the formation and growth of cementitious compounds. New peaks in patterns confirmed 264
not only the formation of cementitious compounds but also indicated the presence of non-hydrated 265
materials. 266
In Figure 2, it is observed that untreated sediment presents quartz (Q), feldspar (F), calcium carbonate 267
(C), Illite (I) and kaolinite (K) in its composition. Samples at 7 days (Figure 2a) showed the presence of 268 1 2 3 4 5 6 7 8 9 10 11 12 13 14 15 16 17 18 19 20 21 22 23 24 25 26 27 28 29 30 31 32 33 34 35 36 37 38 39 40 41 42 43 44 45 46 47 48 49 50 51 52 53 54 55 56 57 58 59 60 61
gypsum (S2L9FA), C2S (S2L7C and S2L7C9FA) and anhydrite (S7C). It may indicate (a) insufficient water 269
to hydrate the binders, (b) delay in cement hydration due to FA addition, (c) restricted water 270
availability of anhydrous grains surrounded by hydration products due to the formation of strong 271
bounds between soil aggregates which can modify the porous structure and thus can slow down or 272
hinders the permeation and/or diffusion process of water, (d) a combination of previous assumptions. 273
A remarkable peak of calcium carbonate (CaCO3) was particularly observed in S2L7C9FA at 7 days. The 274
occurrence of CaCO3 was associated to the presence of limestone in the cement (CEM II) and 275
carbonates in the untreated sediment. The non-observation of such CaCO3 peak in S7C or S2L7C could 276
be explained by the heterogeneous distribution of binders in the sediment, the sediment itself and the 277
low percentage of cement used. Since the specimens have been kept packed during curing, 278
carbonation reactions were disregarded. 279
Regarding hydration products, new peaks pointed out CH in S7C9FA, C-S-H in S2L and S2L7C, and 280
ettringite in S7C and S7C9FA. The mixture with S2L9FA presented CASH peak. Even though some 281
crystalized new phases from cement hydration have been identified, they did not occur in an evident 282
way and this might be a consequence of the low water/cement ratio (w/c). 283 284 1 2 3 4 5 6 7 8 9 10 11 12 13 14 15 16 17 18 19 20 21 22 23 24 25 26 27 28 29 30 31 32 33 34 35 36 37 38 39 40 41 42 43 44 45 46 47 48 49 50 51 52 53 54 55 56 57 58 59 60
285
Figure 2: XRD results of mixtures at 7 days (a) and 28 days (b) 286
Figure 2(b) shows the pattern of mixtures at 28 days. Belite is still identified in S7C9FA and S2L7C. 287
Other new peaks refer to C-S-H in S2L, S7C, S2L9FA and S2L7C, CH in S2L9FA and S7C9FA, and CASH in 288
S2L and S2L7C9FA. The presence of non-hydrated material suggests hydration delay or water 289 1 2 3 4 5 6 7 8 9 10 11 12 13 14 15 16 17 18 19 20 21 22 23 24 25 26 27 28 29 30 31 32 33 34 35 36 37 38 39 40 41 42 43 44 45 46 47 48 49 50 51 52 53 54 55 56 57 58 59 60 61
insufficiency. This might be related to (i) lime addition, because the change of texture (agglomeration) 290
would interfere with the amount of available water for hydration, since water may be trapped in the 291
soil cluster; and/or (ii) FA addition, because water demand for FA is generally important due to its 292
appreciable porosity, it might create a competition for available water. Besides, it is important to 293
remember that cementitious compounds in early ages are poorly crystalized and they are not well 294
detected by diffractometer. 295
Regarding cementitious compounds, one may observe that all treated samples had produced them at 296
28 days, unlike what happened at 7 days. Curing time was preponderant to development of 297
cementitious compounds, since time allows binders to hydrate according to their own reaction rates 298
(pozzolanic reactions) and allows also the transport of water necessary to the reactions of anhydrous 299
grains surrounded by hydration products. This implies that it would be recommended at least 28 days 300
to verify strength gains, at macroscale. 301
Hydrated silicates exhibit different morphologies and it might be more problematic for chemically 302
stabilized soil due to the several factors, such as the type of additive, the low additive contents, the 303
low water content, the complexity of hydration mechanisms and cementitious material formation of 304
multicomponent mixed materials [15][25]. 305
In other words, since C-S-H are amorphous and/or poorly crystallized, it may be advisable to be careful 306
when reading XRD patterns because of the disturbing factors (producing a heterogeneous sample) and 307
to combine other microstructural data sources to help to support the results analyses. 308
3.1.2. Microstructure observation by Scanning Electron Microscopy (SEM) 309
SEM images are often used to provide evidences of cementitious compounds development and 310
mixture changes. Firstly, Figure 3 attempts to demonstrate visually constituents and compounds, 311
which were previously identified in the mixtures using XRD tests (Figures 2 and 3). SEM Images are 312
presented in appropriate magnificence to highlight details of the materials. As it can be seen in figure 313 1 2 3 4 5 6 7 8 9 10 11 12 13 14 15 16 17 18 19 20 21 22 23 24 25 26 27 28 29 30 31 32 33 34 35 36 37 38 39 40 41 42 43 44 45 46 47 48 49 50 51 52 53 54 55 56 57 58 59 60
3, almost all compounds identified with the XRD patterns are observed and confirmed, such as gypsum, 314
CaCO3 (found in sediment and in mixtures with cement), hydrated silicates and FA as well. 315
316
Figure 3: Identification of constituents and cementitious compounds of mixtures from (a)S2L9FA-7d, 317
(b) S7C, (c)S2L7C9FA – 7d, (d) S7L9FA – 7d, (e)S2L7C9FA-7d,(f) S2L9FA-28d 318
Secondly, Figures 4 shows SEM images obtained from sediment mixtures without and with FA (4a and 319
4b), in order to observe structural changes and cementitious compound presence from 7 to 28 days. 320
Figure 4(a) shows images from mixtures using conventional binders. Mixture with lime (S2L) at 7 days 321
exhibits a flaked-like structure, as a result of cation exchange and flocculation mechanism. At 28 days, 322
a block-like structure may be observed, indicating pozzolanic reactions, as demonstrated by 323
identification of needle-shape C-S-H. 324
Regarding mixture with cement (S7C), block-like structure may be observed already at 7 days. Besides 325
it might be identified the formation needle-shape C-S-H. Shrinkage fissure (due to cement hydration) 326
are observed at 28 days. 327 1 2 3 4 5 6 7 8 9 10 11 12 13 14 15 16 17 18 19 20 21 22 23 24 25 26 27 28 29 30 31 32 33 34 35 36 37 38 39 40 41 42 43 44 45 46 47 48 49 50 51 52 53 54 55 56 57 58 59 60 61
The mixture with binary binder, lime and cement (S2L7C), exhibited a combination of the 328
aforementioned observations related to structure, i.e. flaked and block-like. Notwithstanding, in this 329
mixture, C-S-H and ettringite are identified and as well as some shrinkage fissures at 7 and 28 days. 330
331 332
Figure 4: SEM images from mixtures without FA (a) and with FA (b) 333 1 2 3 4 5 6 7 8 9 10 11 12 13 14 15 16 17 18 19 20 21 22 23 24 25 26 27 28 29 30 31 32 33 34 35 36 37 38 39 40 41 42 43 44 45 46 47 48 49 50 51 52 53 54 55 56 57 58 59 60
The observation of cementation products and the resulting block-like structure lead to infer some 334
increase in strength at macroscale, for instance. Again, that is in accordance with the assumption that 335
cementation enhances the mixture cohesion and controls strength gain of mixtures using cement [12]. 336
Figure 4(b) presents images of binary and ternary mixtures using FA, in attempt to observe its effect 337
when combined with conventional binders. Generally, mixtures using FA revealed significant 338
occurrence of pozzolanic and hydration products. These phenomena are more effective surrounding 339
FA spheres. This finding is consistent to nucleation process and reaction stimulation reported in 340
technical literature [3][12][25]. 341
Concerning visual aspect, at 7 days, it can be observed that mixture with lime and FA shows a flaked-342
like structure. At 28 days, mixture revealed a blocky structure. The change in structure is remarkable 343
and is attributed to the development of cementation between the soil clusters and also covering FA, 344
as seen in S2L9FA mixture at 28 days. 345
For mixture with cement and FA (S7C9FA), blocky structure is observed at 7 and 28 days. C-S-H gel 346
covers the surface of soil and FA and shrinkage fissures were identified. For the mixture with lime, 347
cement and FA (S2L9FA), once again the flocculated structure was observed (at 7 days) as well as its 348
evolution to a blockier structure (at 28 days). 349
Cementitious compounds and hydration fissures seem to occur more frequently in mixtures using FA 350
for both curing time. The increase of CaO content due to addition of FA as long as the nucleation 351
process would promote formation of cementitious materials [3][4][26]. 352
3.1.3 MIP results 353
The XRD patterns (Figure 2) showed the occurrence of cementation from new crystalline phases in the 354
mixtures such as hydrated silicates. The SEM images (Figures 4) confirmed the presence of the 355
cementitious compound and qualified the changes of the structure caused by the additives. MIP tests 356
were carried out, in attempt to clarify the mechanism of interaction between FA and conventional 357
binder which govern the alteration of sediment fabric. 358 1 2 3 4 5 6 7 8 9 10 11 12 13 14 15 16 17 18 19 20 21 22 23 24 25 26 27 28 29 30 31 32 33 34 35 36 37 38 39 40 41 42 43 44 45 46 47 48 49 50 51 52 53 54 55 56 57 58 59 60 61
Figure 5 presents cumulative intrusion versus pore diameter curves. In general, additives reduced the 359
pore diameter of original soil. In mixtures S2L and S2L9FA, for large pores (from 10 to 0.1 µm), it is 360
observed that there are reductions of diameter of pore. Whereas, for small pores (from 0.1 to 0.001 361
µm) there is an increase of cumulative intrusion, i.e. an increase of percentage of small pores. Curves 362
are approximately parallels, but it can be seen that FA tends to change further large pores. 363
364
365
Figure 5: Pore distributions of all mixtures (7 days) 366
Mixtures S7C and S7C9FA presented significant changes mostly in large pores. This finding suggests 367
that changes in the pore distribution depend on the type and amount of binder added, and particularly 368
the gradation of binders. 369
Pore distributions revealed the soil fabric changes resulting from addition of binders. For instance, at 370
7 days, it is expected that: 371
(i) Lime generates a formation of aggregates/flocculates with finer pore width resulted from the 372
exothermic reaction which take place during lime hydration [10][34]. 373
(ii) Cement hydration produces cementitious compounds that fill large pores and also causes 374
shrinkage reducing original soil pores diameter. No significant evolution of small pores domain is 375
observed for both treatments using lime and cement. This is due to the fact that small pores are 376
mainly associated with intra-aggregate porosity which is less affected by the treatment. 377
(iii) both lime and cement combine these two mentioned effects, and 378 1 2 3 4 5 6 7 8 9 10 11 12 13 14 15 16 17 18 19 20 21 22 23 24 25 26 27 28 29 30 31 32 33 34 35 36 37 38 39 40 41 42 43 44 45 46 47 48 49 50 51 52 53 54 55 56 57 58 59 60
(iv) in addition to the role of filler played by FA, it also promotes nucleation and formation of 379
cementitious compounds around FA, increasing the percentage of small pores of the original soil 380
[12]. 381
Since total pore volume (i.e. the highest cumulative intrusion value) is an indicator of material 382
densification, one could assume that, at macroscale, the resistance of mixtures using FA would be 383
higher than that of mixtures without FA. Nevertheless, accordingly [28], cementation controls 384
predominantly the resistance development of soil-cement mixtures. 385
3.2. Macroscale analysis 386
Macroscale analysis was done in two steps. The first consisted of immediate property assessment of 387
the mixtures based on Proctor, shrinkage, and UCS test results. The latter was based on UCS results 388
throughout curing time. First and second steps focused on distinguishing the filler effect from curing 389
effect, respectively, in an attempt to remark the most adequate stabilization process, in terms of 390
additive content and strength gain. 391
3.2.1. Design parameters and immediate strength 392
Binder addition and content may change soil gradation. Since additives are finer than the soil (Figure 393
1), they shall fill partially empty voids of soil and increase the initial strength values, due to the filler 394
effect. Table 2 present design parameters and immediate strength. Comparing to untreated sediment, 395
it is observed that binder addition promoted (a) the reduction of maximum dry densities (ρdmax) and
396
the increase of optimum water content (wopt), (b) the reduction of the volumetric variation (dV) and 397
(c) the increase of immediate strength (UCS0d). Nevertheless, the intensity of changes depends on the 398
type and the content of binder. 399
Table 2. Design parameters and immediate strength 400
Proctor
Parameters Shrinkage Parameters
Type of mixture Legend %
filler
wopt dmax Time dv dv/T UCS0d
(%) (g/cm3) (days) (%) (%/hours) (MPa)
Soil S 0,0 27.8 1.48 3,0 27.0 0.44 0.28 1 2 3 4 5 6 7 8 9 10 11 12 13 14 15 16 17 18 19 20 21 22 23 24 25 26 27 28 29 30 31 32 33 34 35 36 37 38 39 40 41 42 43 44 45 46 47 48 49 50 51 52 53 54 55 56 57 58 59 60 61
Soil+ 2% lime S2L 2.0 32.2 1.38 2.6 20.5 0.50 0.21 Soil+ 2% lime + 9% fly ash S2L9FA 11.0 32.0 1.37 2.8 17.0 0.39 0.30
Soil+ 7% cement S7C 7.0 28.1 1.46 2.4 19.0 0.32 0.31
Soil+ 7% cement + 9% FA S7C9FA 16.0 30.3 1.41 3.0 15.5 0.33 0.37 Soil+ 2% lime+ 7% cement S2L7C 9.0 30.7 1.43 2.2 18.0 0.25 0.37 Soil+ 2% lime+ 7% cement+9% FA S2L7C9FA 18.0 31.6 1.37 2.0 12.5 0.17 0.49 401
To illustrate filler effect, Figure 6 shows correlations between Proctor and shrinkage parameters, and 402
immediate UCS values in function of additive content. Figure 6(a) shows that the reduction of ρdmax is 403
a result of the increase of binder content, but this behavior depends on the type of binder considered. 404
It is observed that the evolution of the ρdmax follow a linear regression law with high degree of
405
accuracy (R2). R2 values for mixtures containing lime (L) and cement (C) are 0.81 and 0.88, respectively.
406
FA addition reduced ρdmax in mixtures with cement. In mixtures with lime this behavior was not 407
observed. 408
Linear law demonstrates that cement addition reduces maximum dry density less than lime addition. 409
Both curves converge to the ρdmax value of the SLCFA mixture, which was the minimum one. 410
Volumetric deformation is often consequence of shrinkage which occurs in cemented materials due to 411
the water consumption for clinker component, generating fissures. Shrinkage test reports the variation 412
of volume (dV) that a soil-cement may present and gives an idea about material durability in dosage 413
phase. Figure 6(b) shows a strong correlation between dV and additive content (R2=0.93), indicating
414
that dV decreases with increasing additive content. In other words, partial filling of the voids would 415 inhibit shrinkage. 416 417 1 2 3 4 5 6 7 8 9 10 11 12 13 14 15 16 17 18 19 20 21 22 23 24 25 26 27 28 29 30 31 32 33 34 35 36 37 38 39 40 41 42 43 44 45 46 47 48 49 50 51 52 53 54 55 56 57 58 59 60
Figure 6: Immediate Properties and characteristics of mixtures 418
It would be reasonable to indicate the addition of inactive fillers in order to reduce shrinkage in soil-419
cement type mixtures. Figure 6(b) led to infer that FA plays this role in this phase, because its addition 420
in the mixtures further reduced dV. In mixtures without FA, the reduction of dV was approximately 421
equals to 30% in relation to untreated soil. When FA was added, this reduction was about 40% for SL 422
and SC mixtures, and 55% for SLC mixture. 423
Regarding the filler effect on immediate strength, Figure 6(c) shows a good correlation (R2=0.79)
424
between additive content and UCS of the mixtures, where the higher the additive content the greater 425
the UCS0d. It is important to point out that immediate UCS0d of SL mixture was lower than the 426
untreated sediment. This behavior is attributed to flocculation reactions of lime that increase of voids 427
in the mixture, decreasing ρdmax and increasing water content (as seen in Table 2).
428
It is worth emphasizing that the combination of additives changes gradation of untreated sediment. 429
As additives are finer than the sediment soil, they may fill empty voids, increasing the sediment 430
strength. As a rule, the initial strength values gradually improve as binder percentages increase. 431
In spite of the good correlation between immediate UCS and additive content, the strength gain may 432
be also related to the type of additive, or combination between them, since the greatest immediate 433
UCS were observed in mixtures SLC, SCFA and SLCFA. The common point of these mixtures is the 434
presence of cement associated to other(s) additive(s). It seems to be a contribution of additive 435
gradations to the particle size arrangement of mixtures, resulting in the increase of their immediate 436
UCS. Immediate UCS is a reference point that might lead to dosage optimization attempts. Accordingly, 437
from this point on, it shall be observed the strength gain over time due to chemical reactions. 438
3.2.2. UCS and water content results over time 439
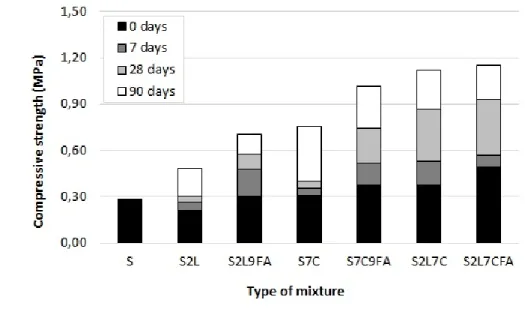
In order to highlight the effects of additives on the mechanical resistance of mixtures, Figure 7 presents 440
the kinetics of the UCS over time. Regarding compressive strength values (UCS), one may observe that 441
additives increased initial property of untreated sediment (0,27 MPa), even though some mixtures 442 1 2 3 4 5 6 7 8 9 10 11 12 13 14 15 16 17 18 19 20 21 22 23 24 25 26 27 28 29 30 31 32 33 34 35 36 37 38 39 40 41 42 43 44 45 46 47 48 49 50 51 52 53 54 55 56 57 58 59 60 61
required more time to present significant strength gains, such as mixture S2L that presented reduction 443
of UCS value at 7 days. All other additives combination increased UCS values and these increases are 444
more expressive when FA is added. 445
From 0 to 7 days, the strength gain of S2L and S7C was about 0.05 MPa that represents respectively 446
20% and 16% of their initial UCS values (0.21 and 0.31 MPa). For conventional binders, the mixture 447
with lime and cement (S2L7C) had the higher strength gain (~0.15 MPa), that is 40% of its initial 448
strength (0.37 MPa). 449
For mixtures containing FA, strength gains were in average of 0.15 MPa. It is worth emphasizing the 450
strength gain of the mixture S2L9FA that was about 70%. In contrast, the strength gain at 7 days of the 451
mixture S2L7C9FA was the lowest one (0.10MPa) that represents about 20% of initial UCS value. 452
At 28 days, the UCS value of S2L was 0.31 MPa, S7C was 0.40 MPa, and S2L7C was 0.87 MPa. From 7 453
to 28 days, the gain of UCS remains about 0.05 MPa for S2L and S7C. Interestingly, FA addiction 454
doubled the strength gains in these mixtures. The faster strength gain was also observed by Kang et al. 455
[27]. 456
457
Figure 7: UCS over time 458
For the mixture S2L7C9, the strength gain was 0.35 MPa. In this case, FA addition did significantly not 459
increase strength gain of SLC mixture. In general, mixtures with FA presented the higher UCS values. 460 1 2 3 4 5 6 7 8 9 10 11 12 13 14 15 16 17 18 19 20 21 22 23 24 25 26 27 28 29 30 31 32 33 34 35 36 37 38 39 40 41 42 43 44 45 46 47 48 49 50 51 52 53 54 55 56 57 58 59 60
In order to observe the tendency of strength evolution, Figure 7 also presents UCS at 90 days. As it can 461
be noticed, UCS values continued increasing, with emphasis on the highest strength gains of mixture 462
S7C and S2L. Another point to remark is that mixtures using FA showed slower strength gains compared 463
to mixtures with conventional binders, unlike what was observed for other curing time (7 and 28 days), 464
suggesting a deceleration of these gains at 90 days. 465
UCS Kinetics confirmed the additive mechanism-based assumptions. Regarding mixture with lime, 466
cation exchanges and flocculation did not improve soil resistance. Over time, pozzolanic reactions were 467
not effective to increase significantly the strength even in long term (from 28 days). In the mixture with 468
cement, the occurrence of cementitious compounds increased strength at early age (7 days). 469
Interestingly, it continued to increase up 90 days but at lower intensities, in contrast to expectations 470
of fast reacting cements. This delay is probably associated to the salt presence and organic matter in 471
the marine sediment that alters the kinetics of hydration cement, as mentioned by Horpibulsuk et al. 472
[35]. 473
On the other hand, FA addition has led to the higher strength gains in all tested mixtures. This 474
observation is consistent with the hypotheses of nucleation and growth of cementitious materials 475
promoted by FA [15][26][27], which here were observed and discussed based on the results of 476
microscale test (Figures 2 to 4). 477
Assuming that the gain of resistance over time results from the cementing products of the additive 478
components [28], it is also necessary to understand how the hydric state of the mixtures evolves. 479
Figure 8 presents the evolution of water content over time. The plotted curves indicate that water 480
content reduces over time and the intervals of variation are significant over long periods, as can be 481
seen for all mixtures using cement. 482 483 1 2 3 4 5 6 7 8 9 10 11 12 13 14 15 16 17 18 19 20 21 22 23 24 25 26 27 28 29 30 31 32 33 34 35 36 37 38 39 40 41 42 43 44 45 46 47 48 49 50 51 52 53 54 55 56 57 58 59 60 61
484
Figure 8: Variation of water content over time 485
In early age (7 days), water contents change slightly, maintaining practically the initial values, i.e. close 486
to the wopt (Table 4). However, for intermediary age (28 days), these changes evidence the reduction 487
of water content, the average reduction was 5%. For longer period (90 days), the average reduction of 488
water content is 12%, except for SLC, which was 31%. 489
FA addition also alters hydric conditions of stabilized mixtures over time but at lower intensity. As a 490
rule, one may suppose that the greater the decrease in moisture content the greater the gain in 491
resistance. This hypothesis is true since water is consumed in formation and/or crystallization of 492
cementing products, becoming the structure denser and more resistant than the original soil. 493
4. Discussion 494
The decision for a given product takes into account technical, economic and environmental 495
parameters. This study has shown that combining FA with stabilized soil with lime and cement (or both) 496
is promising because of the FA action mechanisms promoted an acceleration of strength gain 497
regardless of the curing time. Besides, mixtures using FA have always shown higher resistance, either 498
through physical interactions or chemical reactions. These findings support technically the choice for 499
combining FA with chemical soil stabilization using conventional binders. 500
For instance, UCS value at 90 days of mixture using cement (S7C) is compatible with that of the mixture 501
using cement and FA (S7C9FA) at 28 days, or with mixture using lime and FA (S2L9FA) at 90 days. These 502
mechanical compatibilities indicate alternative material options that might save time and economy, 503 1 2 3 4 5 6 7 8 9 10 11 12 13 14 15 16 17 18 19 20 21 22 23 24 25 26 27 28 29 30 31 32 33 34 35 36 37 38 39 40 41 42 43 44 45 46 47 48 49 50 51 52 53 54 55 56 57 58 59 60
since it is possible to select mixtures that present greater resistance ahead of time, use cheaper 504
additives or smaller quantities of conventional binders. 505
These benefits have a positive impact on environmental indicators because they promote the rational 506
use of waste and byproducts (marine sediment and fly ash). In this sense, it is worth mentioning that 507
the mixture with lime, cement and FA (S2L7C9FA) presented resistance compatible with the mixture 508
without FA (SLC), leading to question the advantages of this mixture (S2L7C9FA) as well as to think 509
alternatively about the possibility of reducing the cement content in order to optimize the mixture 510
design in terms of economic and environmental. 511
5. Conclusions 512
The effects of FA addition on microstructural and resistance characteristics of mixtures stabilized with 513
conventional binders were investigated. From this study the conclusions are made focusing the 514
interrelations between microstructural and macrostructural analyses. 515
Regarding microstructural analyses, it was identified new crystalline phases in DRX patterns. 516
Cementitious materials, such as ettringite, portlandite and hydrated silicates, are produced over time 517
by cement hydration and pozzolanic reactions. The occurrence of these products depends on the 518
curing time due to particular binder reaction rate. These findings are supported by SEM images, that 519
confirmed the presence of hydrated silicates in different morphologies (gel, acicular C-S-H for 520
instance), mainly in mixtures using FA. The SEM images also show physical modification of the soil 521
fabric over time, which was also confirmed by analysis of pore distributions. The results of the pore 522
distribution measurements show a structural densification of the sediment matrix at early age, 523
demonstrating the contribution of finer gradations of the additives on the sediment pore 524
rearrangement, i.e. filler effect. 525
Macroscale analyses led also to observe a prevalent filler effect on gain of immediate resistance and 526
reduction of volumetric variation by shrinkage (dV). These physical responses are especially 527
remarkable in mixtures using FA. These findings led to recommend more studies in dosage parameters 528 1 2 3 4 5 6 7 8 9 10 11 12 13 14 15 16 17 18 19 20 21 22 23 24 25 26 27 28 29 30 31 32 33 34 35 36 37 38 39 40 41 42 43 44 45 46 47 48 49 50 51 52 53 54 55 56 57 58 59 60 61
and properties in order to identify the best combination of binder blend for chemical stabilization 529
purposes and to optimize the mixture design with several binders, i.e. the choice and the content of 530
binder(s). UCS values increase and water contents decrease over curing time, with emphasis on the 531
significant contribution of FA to the better mechanical performance. Based on microstructural analysis, 532
it can be stated that available water was consumed for cementing and pozzolanic reactions over time. 533
6. Acknowledgement 534
The authors are very thankful of the research team of University Gustave Eiffel and University of 535
Nantes for laboratory experiments and technical supports. 536
7. Funding Source 537
This work was financially supported by CAPES-PRINT in the framework of Post doctorial fellowship ref. 538
88887.371953/2019-00. 539
8. References 540
[1] Rajasekaran, G. (2005) Sulphate attack and ettringite formation in the lime and cement stabilized marine 541
clays. Ocean Eng. 32, pp. 1133-1159. DOI:10.1016/j.oceaneng.2004.08.012. 542
[2] Puppala, A.J. (2016) Advances in ground modification with chemical additives: From theory to practice, 543
Transportation Geotechnics, 9, pp. 123-138. DOI: 10.1016/j.trgeo.2016.08.004. 544
[3] Solanki, P., Zaman, M. (2012) Microstructural and mineralogical characterization of clay stabilized using 545
calcium-based stabilizers. Scanning Eletro Microscopy, Ed. Dr. Viacheslav Kazmiruk, Intech, pp. 772-798. 546
DOI: 10.5772/34176. 547
[4] Horpibulsuk, S. (2012) Strength and microstructure of cement stabilized clay. Scanning Eletron Microscopy, 548
Ed. Dr. Viacheslav Kazmiruk, Intech, pp. 440-480. DOI: 10.5772/35225. 549
[5] Simoni, J.P.S.C. (2019). Contribution regarding the design and the mechanical behavior of soil-aggregate-550
cement mixture for pavement course. Dissertation (Master degree). 130p. Sao Carlos School of Engineering, 551
University of Sao Paulo (in Portuguese). 552
[6] Furlan, A.P., Razakamanantsoa A., Ranaivomanana H., Levacher D., Katsumi T. (2018) Shear strength 553
performance of marine sediments stabilized using cement, lime and fly ash. V. 184, pp. 454-463. 554
DOI: 10.1016/j.conbuildmat.2018.06.231. 555
[7] Chew, S.H., Kamruzzaman, A.H.M., Lee, F.H. (2004) Physicochemical and engineering behavior of cement 556
treated clays.J. Geotech. Eng., V. 130 (7) pp 696-706. DOI: 10.1061/(ASCE)1090-024130:7(696). 557
[8] G. Ye. (2003) Experimental study and numerical simulation of the development of the microstructure and 558
permeability if cementitious materials. PhD thesis. Delft University of Technology. 559
[9] Franus, W., Panek, R., Wdowin, M. (2015) SEM Investigation of Microstructures in Hydration Products of 560
Portland Cement. In: Polychroniadis E., Oral A., Ozer M. (eds) 2nd International Multidisciplinary Microscopy and 561
Microanalysis Congress. Springer Proceedings in Physics, vol 164, Springer, Cham. 562 1 2 3 4 5 6 7 8 9 10 11 12 13 14 15 16 17 18 19 20 21 22 23 24 25 26 27 28 29 30 31 32 33 34 35 36 37 38 39 40 41 42 43 44 45 46 47 48 49 50 51 52 53 54 55 56 57 58 59 60
[10] Lemaire, K. Deneele, D. Bonnet, S. Legret, M. (2013) Effects of lime and cement treatment on the 563
physicochemical, microstructural and mechanical characteristics of a plastic silt, Engineering Geology. 166, 564
pp. 255–261. DOI: 10.1016/j.enggeo.2013.09.012. 565
[11] Ranaivomanana H., Razakamanantsoa A., Amiri O. (2018) Effects of Cement Treatment on Microstructural, 566
Hydraulic, and Mechanical Properties of Compacted Soils: Characterization and Modeling. Int. J. Geomech., 2018, 567
18(9): 04018106. DOI: 10.1061/(ASCE)GM.1943-5622.0001248. 568
[12] Horpibulsuk, S. Rachan, R., Raksachon, Y. (2009) Role of fly ash on strength and microstructure development 569
in blended cement stabilized silty clay. Soils and Foundation. Volume 48, Issue 1, pp. 85-98. 570
DOI: 10.3208/sandf.49.85. 571
[13] Consoli, N.C., Lopes Jr., L.S., Heineck, K.S. (2009) Key parameters for strength control of lime stabilized soils. 572
J. Mater. Civ. Eng., V.21 (5), pp. 210-216. DOI: 10.1061/(ASCE)0899-1561(2009)21:5(210) 573
[14] Silva, J., Azenha, M., Gomes Correia, A., François, B., (2018). Two staged kinetics of moduli evolution with 574
time of a lime treated soil under different curing temperatures. Transportation Geotechnics. Volume 17, Part A, 575
pp. 133-140. DOI: 10.1016/j.trgeo.2018.09.013. 576
[15] Yin, B., Kang, T., Kang, J., Chen, Y., Wu, L., Du, M. (2018) Investigation of the hydration kinetics and 577
microstructure formation mechanism of fresh fly ash cemented filling materials based on hydration heat and 578
volume resistivity characteristics. Applied Clay Science, V. 166, pp.146-158. DOI: 10.1016/j.clay.2018.09.019. 579
[16] Consoli, N.C., Rosa, A.R., Cruz, R.C., Dalla Rosa, A., (2011). Water content, porosity and cement content as 580
parameters controlling strength of artificially cemented silty soil. Engineering geology. Volume 122, (3-4), pp. 581
328-333. DOI:10.1016/j.enggeo.2011.05.017. 582
[17] Ribeiro, D., Néri, R., Cardoso, R., (2016). Influence of water content in the UCS of soil-cement mixtures for 583
different cement dosages. Procedia Engineering. Volume 143, (3-4), pp. 59-66. DOI: 584
10.1016/j.proeng.2016.06.008. 585
[18] Consoli, N.C., Prietto, P.D.M., Lopes Jr., L.S., Winter, D., (2014). Control factors for the long term compressive 586
strength of lime treated sandy clay soil. Transportation Geotechnics. Volume 1 (3), pp. 129-136. DOI: 587
10.1016/j.trgeo.2014.07.005. 588
[19] Siham, K. Fabrice, B. Edine A.N., Degrugilliers, P. (2008) Marine dredged sediments as new materials 589
resource for road construction. Waste Management, 28 - 5, pp. 919-928. DOI: 10.1016/j.wasman.2007.03.027. 590
[20] Phetchuay, C., Horpibulsuk, S., Arulrajah, A., Suksiripattanapong, C., Udomchai, A. (2016) Strength 591
development in soft marine clay stabilized by fly ash and calcium carbide residue based geopolymer. Applied 592
Clay Science 127-128, pp. 134-142. DOI: 10.1016/j.clay.2016.04.005. 593
[21] Hung Le, N., Razakamanantsoa, A., Nguyen M., Phan V.T., Dao P., Nguyen D.H. (2018). Evaluation of 594
physicochemical and hydromechanical properties of MSWI bottom ash for road construction. V.80, pp. 168-174. 595
DOI: 10.1016/j.wasman.2018.09.007 596
[22] Thuy Minh Nguyen, T., Rabbanifar, S., Brake, A. N., Qian, Q., Kibodeaux, K., Crochet, H.E., Oruji, S, Whitt, R., 597
Farrow, J., Belaire, B., Bernazzani, B., Jao, M., (2018).Stabilization of silty clayey dredged material. Journal of 598
Material in Civil Engineering. Volume 30 (9), DOI: 10.1061/ASCEMT.1943-5533.0002391 599
[23] Yoobanpot, N., Jamsawang, P., Poorahong, H., Jongpradist, P., Likitlersuang, S., (2020). Multiscale laboratory 600
investigation of the mechanical and microstructural properties of dredged sediments stabilized with cement and 601
fly ash. Engineering geology. Volume 267. DOI: 10.1016/j.enggeo.2020.105491. 602
[24] Lee, C.Y., Lee, H.K., Lee, K.M. (2003) Strength and microstructural characteristics of chemically activated fly 603
ash–cement systems. Cement and Concrete Research, 33, pp. 425-431. DOI: 10.1016/S0008- 8846(02)00973-0. 604
[25] Fernandez, R., Ruiz, A.I., Cuevas, J. (2016) Formation of C-A-S-H phases from the interaction between 605
concrete or cement and bentonite. Clay Minerals, V. 51, pp. 223-235. DOI:10.1180/claymin.2016.051.2.09. 606
[26] Biernacki, J.J., Williams, P.J., Stutzman, P.E. (2001) Kinetics of reaction of calcium hydroxide and fly ash. ACI 607
Materials Journal 98(4), pp. 340-349. 608
[27] Kang, X., Kang, G.C., Chang, K.T., Ge L. (2015) Chemically Stabilized Soft Clays for Road-Base Construction. J. 609
Mater. Civil. Eng. ASCE, 27(7) ASCE4 (ASCE) MT.1943-5533.0001156. 610 1 2 3 4 5 6 7 8 9 10 11 12 13 14 15 16 17 18 19 20 21 22 23 24 25 26 27 28 29 30 31 32 33 34 35 36 37 38 39 40 41 42 43 44 45 46 47 48 49 50 51 52 53 54 55 56 57 58 59 60 61
[28] Horpibulsuk, S., Rachan, R., Chinkulkijniwat, A., Raksachon Y., Suddeepong, A. (2010) Analysis of strength 611
development in cementstabilized silty clay form microstructural considerations. Constr. Build. Mater. 24, pp. 612
2011–21. DOI:10.1016/j.conbuildmat. 2010.03.01. 613
[29] Sivapullaiah, P.V., Jha, A.K. (2014) Gypsum induced strength behavour of fly ash-lime stabilized expansive 614
soil. Geotech Geol Eng 32: 1261. DOI : 10.1007/s10706-014-9799-7. 615
[30] American Coal Ash Association. (2003). Fly ash facts for highway engineers. Technical Report (FHWA-IF-03-616
019). 617
[31] Yin, C., Zhang, W., Jiang, X., Huang, Z., (2018). Effects of Initial Water Content on Microstructure and 618
Mechanical Properties of Lean Clay Soil Stabilized by Compound Calcium-Based Stabilizer. Materials. Volume 619
11(10) : 1933. DOI: 10.3390/ma11101933 620
[32] Guide des Terrassements Routier (GTR), Réalisation des remblais et des couches de forme, in: Technical 621
guide, Fascicule 1, Principe généraux, 2nd Ed, SETRA – LCPC, D 9233-2, 2000, 221p. 622
[33] Liang, Y. (2012) Co-valorisation de sédiments et de sols fins par apport de liants et de fibres, PhD thesis, U. 623
Caen – Normandie. 624
[34] Cuisinier O., Auriol, J.C. Borgne, T., Deneele, D. (2011) Microstructure and hydraulic conductivity of a 625
compacted lime-treated soil, Engineering Geology, 123, 187–193. DOI: 10.1016/j.enggeo.2011.07.010. 626
[35] Horpibulsuk, S., Phojan, W., Suddeepong, A., Chinkulkijniwat, A., Liu, M.D. (2012) Strength development in 627
blended cement admixed saline clay. Applied Clay Science 55, pp. 44-52. DOI: 10.1016/j.clay.2011.10.003 628 629 630 631 1 2 3 4 5 6 7 8 9 10 11 12 13 14 15 16 17 18 19 20 21 22 23 24 25 26 27 28 29 30 31 32 33 34 35 36 37 38 39 40 41 42 43 44 45 46 47 48 49 50 51 52 53 54 55 56 57 58 59 60
Parameters Value Sand fraction > 63µm (%) 23 Silt fraction - 2 to 63µm(%) 41 Clay fraction < 2µm (%) 36 Specific gravity (g/cm3) 2.66 Plasticity limit (%) 36.06 Liquidity Limit (%) 54.54 Plasticity Index 18.48
Organic matter content (%) 10.97 Carbonates content (%) 22.21
pH 8.5
Table 1: Geotechnical properties of sediment
Proctor
Parameters Shrinkage Parameters
Type of mixture Legend %
filler
wopt dmax Time dv dv/T UCS0d
(%) (g/cm3) (days) (%) (%/hours) (MPa)
Soil S 0,0 27.8 1.48 3,0 27.0 0.44 0.28
Soil+ 2% lime S2L 2.0 32.2 1.38 2.6 20.5 0.50 0.21
Soil+ 2% lime + 9% fly ash S2L9FA 11.0 32.0 1.37 2.8 17.0 0.39 0.30 Soil+ 7% cement S7C 7.0 28.1 1.46 2.4 19.0 0.32 0.31 Soil+ 7% cement + 9% FA S7C9FA 16.0 30.3 1.41 3.0 15.5 0.33 0.37 Soil+ 2% lime+ 7% cement S2L7C 9.0 30.7 1.43 2.2 18.0 0.25 0.37 Soil+ 2% lime+ 7% cement+9%
FA S2L7C9FA 18.0 31.6 1.37 2.0 12.5 0.17 0.49
Table 2: Design parameters and immediate strength
Table Click here to access/download;Table;tables on table 1 and