Any correspondence concerning this service should be sent
to the repository administrator:
[email protected]
This is an author’s version published in:
http://oatao.univ-toulouse.fr/22649
To cite this version: Astsatryan, Hrachya V. and Grogoryan, Hayk and
Gyulgyulyan, Eliza and Hakobyan, Anush and Kocharyan, Aram and
Narsisian, Wahi and Sahakyan, Vladimir and Shoukourian, Yuri and
Abrahamyan, Rita and Petrosyan, Zarmandukht and Aligon, Julien Weather
Data Visualization and Analytical Platform. (2018) Scalable Computing:
Practice and Experience, 19 (2 special). 79-86. ISSN 1895-1767
Official URL
DOI :
https://doi.org/10.12694/scpe.v19i2.1351
Open Archive Toulouse Archive Ouverte
OATAO is an open access repository that collects the work of Toulouse
researchers and makes it freely available over the web where possible
DOI : 10.12694/scpe.v19i2.1351
WEATHER DATA VISUALIZATION AND ANALYTICAL PLATFORM
HRACHYA ASTSATRYAN, HAYK GRIGORYAN, ELIZA GYULGYULYAN, ANUSH HAKOBYAN, ARAM KOCHARYAN, WAHI NARSISIAN, VLADIMIR SAHAKYAN, YURI SHOUKOURIAN, ARTUR MKOYAN∗, RITA
ABRAHAMYAN, ZARMANDUKHT PETROSYAN †, AND JULIEN ALIGON ‡
Abstract. This article aims to present a web-based interactive visualization and analytical platform for weather data in Armenia by integrating the three existing infrastructures for observational data, numerical weather prediction, and satellite image processing. The weather data used in the platform consists of near-surface atmospheric elements including air temperature, pressure, relative humidity, wind and precipitation. The visualization and analytical platform has been implemented for 2-m surface temperature. The platform gives Armenian State Hydrometeorological and Monitoring Service analytical capabilities to analyze the in-situ observations, model and satellite image data per station and region for a given period.
Key words: Weather data, OLAP, web-based visualization, observational data, numerical weather prediction, satellite image processing.
1. Introduction. Armenia occupies the north-eastern part of Armenian plateau and central part of Lesser Caucasus range (latitude 38.51’ to 41.18’ North, longitude 43.29’ to 46.37’ East), with the area of about 30 000 sq.km. The geographical location of Armenia and complex mountainous relief has led to the diversity of natural conditions across the country. Armenia is on the northern edge of the sub-tropical zone, in latitudes characterized by an arid and continental climate. Due to a mountainous relief, different climatic zones exist and the weather may have high spatial gradients. High fluctuations in annual and daily temperatures are typical for the Armenian climate. The presence of six climatic zones from dry subtropical to rigorous high mountainous and from everlasting snowcaps to warm humid subtropical forests and humid semi-desert steppes make additional challenges on weather forecasting and climate prediction for the Armenian State Hydrometeorological and Monitoring Service (AHMS).
The meteorological data, received from 47 meteorological stations, serves as an input for the global atmo-spheric models to produce weather forecasts at the global scale. Only four stations provide historical data and monthly updates to the Global Climate Observing System Surface Network and three meteorological stations provide synoptic data to the gridded analysis dataset.
The observation data received from the meteorological stations and data received from a global model used as inputs and outputs to the high-resolution numerical weather prediction models to produce outputs of temperature, precipitation, and other meteorological elements from the ground to the top of the atmosphere [1, 2].
The Three-Dimensional Variational (3DVAR) data assimilation method is used to combine all available information on the atmospheric state in a given time-window to generate an estimate of atmospheric conditions valid at a prescribed analysis time [3]. Sources of information used to produce the analysis include observations, previous forecasts (the background or first-guess state) and satellite images. Currently, satellite imagery is used for the future experiments, as the availability of reasonable data over regions, where observations are scarce, is crucial to increase the accuracy of numerical prediction. The high-performance computational (HPC) resources of the Armenian e-infrastructure are used to resolve mesoscale weather events better and hence to give reasonably accurate forecasts in a short range [4, 5].
This article aims to present the weather data interactive web-based visualization and analytical platform1 . The platform has been developed for the weather data in Armenia by integrating the three existing platforms
∗Institute for Informatics and Automation Problems of the National Academy of Sciences of the Republic of Armenia, 1, P. Sevak str., 0014 Yerevan, Armenia ([email protected]).
†Armenian State Hydrometeorological and Monitoring Service, 09/8 A. Mikoyan Str. 4th Block of Davitashen, 0054 Yerevan, Armenia.
‡University of Toulouse, 41 All´es Jules Guesde - CS 61321, Toulouse, France.
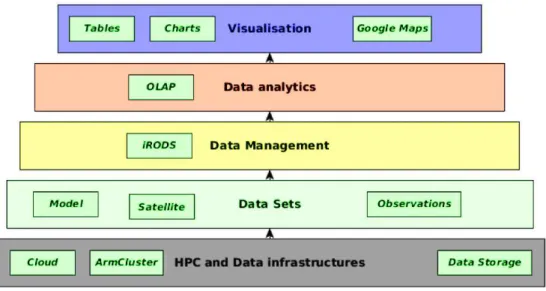
Fig. 2.1. The framework of the platform.
for observational data, numerical weather prediction and satellite image processing. The platform provides a way to compare the output of forecasting model with the observation data gathered from different stations for a chosen frame of time. The suggested platform is essential for a wide range of applications, such as urban area management, sustainable development and nature protection, regional and local planning, agriculture, forestry and fisheries, health, civil protection, infrastructure, transport and mobility or tourism.
The remainder of this paper is divided into the following sections: section 2 introduces the infrastructure, section 3 represents the discussions and analyzes and finally, section 4 is the conclusion.
2. Infrastructure. The suggested interactive web-based visualization and analytical platform consist of 5 main layers (see Fig. 2.1). The bottom layer provides HPC and data resources, which is especially important for the digital models and satellite image processing [6]. The resources of the Armenian e-infrastructure are used, which is a complex national IT infrastructure consisting of both communication and distributed computing infrastructures.
The datasets layer combines three types of data platforms for further analysis: • Model output: outputs of weather prediction models;
• Satellite images: multispectral satellite images covering the territory of Armenia;
• In-situ data: meteorological stations observations, as a base to analyze the deviation values with other model outputs and satellite images.
The Data management layer provides intelligent tools to transfer raw data to data analytics layer. The Integrated Rule-Oriented Data System (iRODS) provides a middleware between the physical data storage systems and the user interface [7].
As soon as data reaches data analytics layer, it is processed and only several indexes are left from huge amount of initial raw data. Finally, the top layer and final destination of already processed data is visualiza-tion layer, where the outcome indexes are transformed to more user-friendly graphs or tables. Moreover, the advantages of Google Maps are used to map these indexes with their real location on the map.
2.1. Datasets. Observational datasets provide from various weather stations obtained with codes SYNOP (surface station reports observations). SYNOP reports are typically sent every three hours, which consists of groups of numbers describing general weather information, such as the temperature, sea level pressure, visibility, wind direction and speed, etc.
The numerical weather prediction models are initialized using NCEP (National Centers for Environmental Prediction) Global Forecast System analysis and forecasts at 0.5 deg horizontal resolution [8]. Data produced
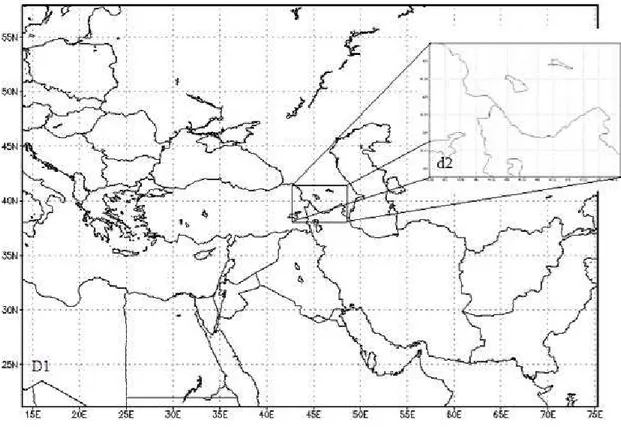
Fig. 2.2. Parent (D1) and nested (d2) domains using in the models.
during pre-processing and simulations of the models are in the Lambert conformal projection, which is well-suited for mid-latitude domains.
The model’s setup (see Fig. 2.2) consists of a parent D1 domain (with a common center located at longitude 44.7, latitude 40.0) covering partly of Europe and all the Caucasus and parts of Central Asia and the Middle East and the nest domain d2 covering the whole territory of Armenia. The model uses 1-way nesting strategy and vertical 31 eta levels.
Earth surface temperature, including land surface temperature (LST), is an important parameter reflecting earth surface environment and is widely used for climate change and weather forecasting. Landsat imagery is used, which supplies high-resolution visible and infrared imagery, with thermal imagery and a panchromatic image also available from the ETM+ (Enhanced Thematic Mapper Plus) sensor [9]. The single-channel method is used for LST retrieval. This method employs only the single thermal band of satellite imagery. This method is suitable for sensors that have only one thermal band such as Landsat TM/ETM+. The data acquisition dates had highly clear atmospheric conditions, and the images were acquired through the United States Geological Survey Earth Explorer Data Center, which has corrected the radiometric and geometrical distortions of the images to a quality level of 1G before delivery. The images are available in the GeoTiff format allowing to reformat, re-project and easily perform operations. Two images per day for daytime and nighttime is available covering the territory of Armenia.
2.2. Tools and models. As a geographic information system (GIS) software suite, the Geographic Re-sources Analysis Support System (commonly termed GRASS GIS) is used for satellite image processing, pro-ducing graphics and maps, spatial and temporal modeling, and visualization [10]. GRASS GIS is currently used in academic and commercial contexts around the world, as well as in many governmental agencies and environmental consulting companies. It can handle raster, topological vector, image processing, and graphic data. GRASS GIS contains over 350 modules to render maps and images on monitor and paper; manipulate raster and vector data including vector networks; process multispectral image data; and create, manage and
store spatial data.
In the beginning, the workspace containing the following information is set up for every GRASS GIS session: • Location - defines the projection, default spatial extent, and resolution for all data in the project; • Mapset - defines collections of data within a given location. Mapsets can be used to organize data of
similar types or categories;
• Database - defines where in the file system the files for the GIS will be stored for the given location and mapset.
As soon as all the images are the same GeoTiff type the created workspaces are identical and the same ESPG geodetic parameter dataset is used. After the workspace is created, ”r.in.gdal” is used to import raster image to the workspace. Than by using r.mapcalc the LST index is calculated for every point on the map to allow quickly retrieve LST for a given coordinates by using ”r.what” module. By implementing these steps we get the LST as an output.
The mesoscale Weather Research and Forecasting (WRF) model [11, 12], which is adapted for the territory of Armenia, is used for operational weather forecasting (WRF-ARW version 3.6). The WRF model has become one of the world’s most widely used numerical weather prediction models. Designed to serve both research and operational needs, it has been grown to offer a spectrum of options and capabilities for a wide range of applications. The WRF model is initialized using NCEP (National Centers for Environmental Prediction) Global Forecast System analysis and forecasts at 0.5 deg horizontal resolution. USGS (US Geological Survey) 30 arc-second digital topography database is used to interpolate the topography and land use. The Lambert conformal projection is used, as it is well suited for the mid-latitude domains. The model operates on two grids, the first parent domain covers the major part of Europe and all the Caucasus and some parts of the Central Asia and the Middle East (40.0 N, 44.7 E) with 202x202 grid points at 18-km, the second nest domain covers the whole territory of Armenia with 6-km horizontal resolution and 97x70 grid points. The following physical parameterization schemes are used in the model:
• microphysics; WRF Single-Moment 6-class (WSM6); • radioactive processes: RRTM/ Dudhia;
• the surface layer: Eta similarity based on Monin-Obukhov with Zilitinkevich; • the processes on the underlying surface and in the soil: Noah Land Surface Model; • the planetary boundary layer: Mellor-Yamada-Janjic;
• cloudiness parameterizations: Kain-Fritsch.
Due to the limited computational resources, the inner domain with 6 km resolution has been implemented. As a range of every run, 24hours always starting at 0000 UTC of each day has been considered. Observable 2-meters long temperatures from 42 operational stations in Armenia are used for data assimilation and to study the accuracy of forecasting air temperature by the model.
2.3. Data analytics. The everyday rapid growth of data and need in analyze of this data pushed the development of analytical processing tools. OLAP (Online analytical processing) is a model for accessing multidimensional data in data warehouses [13]. Data cubes and OLAP session are central concepts in OLAP. A data cube is a collection of facts and dimensions organizing the data of a data warehouse according to different analysis axes and aggregation measures. OLAP provides a set of operations (such as drill-down and slice-and-dice) that transform one multidimensional query into another, which provide high querying. OLAP queries are formulated as sequences called OLAP sessions. For analyzing data with the spatial and georeferenced components the Spatial OLAP (SOLAP) technology is used, which allows rapid and easy navigation within spatial databases and that offers many levels of information granularity, many themes, many epochs and many display modes synchronized or not: maps, tables and diagrams [14]. It allows tight integration of GIS and OLAP systems. A SOLAP system supports three types of spatial dimensions: the non-geometric spatial dimensions, the geometric spatial dimensions and the mixed spatial dimensions. During an OLAP session, the user analyzes the results of a query and, depending on the specific data, applies an operation to determine a new query that will give a better understanding of information.
2.4. Visualization. The implemented tool consists of 3 main logical blocks and the data circulates between these blocks. The first block is the Database. PostgreSQL with its PostGIS extension is used to store datasets with geometrical data. The next block is implementing data analytic logic. The special type of OLAP approach
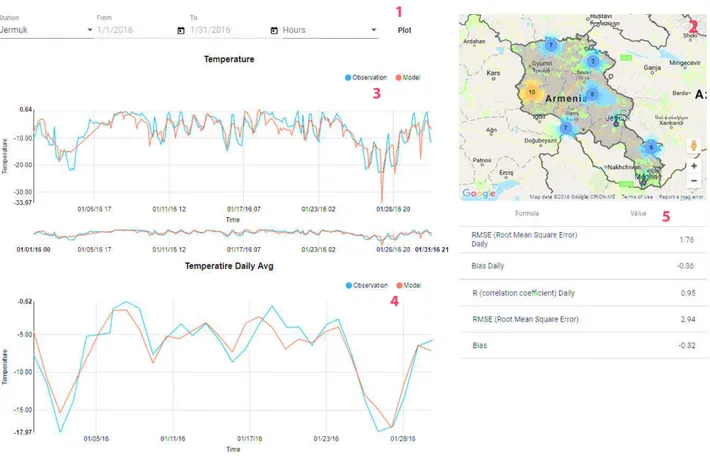
Fig. 2.3. Webbased visualization and analytical platform consists of the following sections: 1 query form, 2 map, 3 -temperature chart, 4 - daily average -temperature chart, 5 - coefficients table.
is used (Spatial OLAP) to process required data. As a query language for OLAP, the MultiDimensional eXpressions (MDX) is used to interact and perform tasks with multidimensional databases (OLAP Cubes). Afterwards, the processed data is transferred to User Interface where user can create various graphs, tables and see the output on the map (see Fig. 2.3).
The main screen includes many parts which are marked with red numbers.
• Query form - user can select the station, start and end dates and the period (by default it takes all hours from 0 to 21) for requesting the needed plot information. After plot action the charts and the table will be updated with corresponding values;
• Map - highlights the territory of Armenia and with markers displayed the physical locations of the stations in the Earth coordinate system;
• Temperature and daily average temperature - displays the observation and model temperature data lines correspondingly for each period and the daily average;
• Coefficients table - shows the RMSE, BIAS and R correlation coefficients.
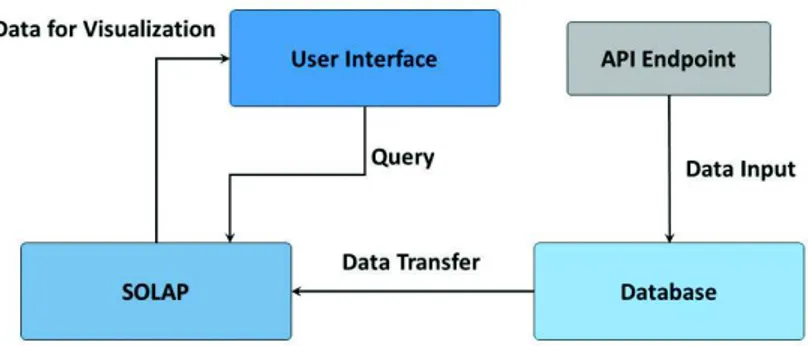
The platform provides the ability to upload new data to the database by using API endpoints. Currently only the administrator of the platform has access for this actions. For observation data SYNOP files (the records are in ascii format) must be used which will be parsed using script written in JavaScript language. For WRF model outputs which are generated in netCDF file format the Python script was created for finding corresponding values based on the stations information stored in the database (see Fig. 2.4).
For observation data the parser script was made with JavaScript for parsing SYNOP files (the records are in ASCII format).
Fig. 2.4. Data workflow consists of API endpoint, database, SOLAP and user interface steps. Table 3.1
Mean estimates of verification of temperature forecasts for several meteo stations per region.
Region Station Height
above sea-level, m RMSE BIAS R
4*Ararat Armavir 870 3.97 -3.53 0.82 Artashat 829 5.69 -5.10 0.73 Ararat 818 5.65 -4.83 0.62 Merdzavan 942 4.71 -4.11 0.79 2*Yerevan Zvartnots 853 4.44 -3.91 0.82 Arabkir 1113 3.24 -1.92 0.77 2*Syunik Meghri 627 9.89 -7.37 -0.70 Kapan 705 9.69 -7.81 -0.43 2*Tavush Ijevan 732 7.61 -4.47 -0.40 Bagratashen 453 7.56 -6.02 -0.31 2*Shirak Ashotsk 2012 2.52 -1.10 0.91 Gyumri 1513 3.91 -3.04 0.82 2*Gegharkunik Gavar 1960 2.74 -1.61 0.89 Lake Sevan 1917 2.59 1.74 0.90
3. Discussions and analyzes. Various statistical and object-oriented methods are used in the suggested web-based analytical platform to investigate the characteristics of model-forecast and satellite image errors, which is important for providing useful guidance to end-users.
As a case study, the 2m temperature has been investigated using the observational and regional high-resolution WRF model data for the January, 2016. For the studied period, the RMSE, BIAS and R correlation coefficients are calculated for the observational data and model-forecast data for 42 observation points dis-tributed in the territory of Armenia (see Table 3.1). The table shows that the average difference between the forecast data and observations is about 4-50
C. For all the stations studied, an acceptable correlation coefficient has been obtained, which allows one to judge the adequacy of the model.
The analyzes, which have been carried out for 42 stations (some high-altitude stations are not considered), show that the model data for almost all stations are overstated. RMSE values are about 1.6-2.50C for the stations located at altitudes above 1500m-2000m, 4.6-9.80
C for the stations below 1000m. It means that the model predicts well the temperature values at a height of 2m for stations located above 1500m and gives unsatisfactory results for stations below 1500m. The worst results are obtained for stations below 1000m, such as stations located in Meghri, Kapan, Ijevan, Bagratashen, and the valley of Syunik and Tavush region.
The January 2016 temperature for Ararat valley and Yerevan is also projected unsatisfactory. In Ararat valley RMSE 5.6-6.40
for Yerevan-Arabkir station, which is located at an altitude of 1113m, and the worst result for Yerevan-Zvartnots. The correlation coefficient varies from 0.80-0.97 for mountain and foothill areas, as for valleys it is from 0.7 to 0.25 and from -0.7 to -0.31.
From all that has been described above, it can be concluded that the WRF model with the described configuration, for a cold period of time, gives a positive forecast for a variable air temperature of 2 m for the mountain and foothill regions of the republic (Shirak, Kotayk, Gegharkunik, Lori, mountain and foothill areas of Aragatsotn) and at the same time an unsatisfactory forecast for the Valley of Syunik, Tavush, Ararat valley and Yerevan.
Analysing all the factors that make up the temperature, we see that there were fogs in the valley during the selected period, which was the reason for low temperatures. Therefore we can conclude that the model WRF, is not predicted by low temperatures of occurrence of the lowland, effect of the fog at surface inversion. Such a result does not satisfy, therefore, it is necessary to improve the accuracy of the model data, through a proper tuning, it would be useful to test the impact of resolution given, because the Armenian terrain has a rather complex orography and is characterized by several land-category types.
4. Conclusion. The suggested platform enables to integrate already available observational, model-fore-cast and multispectral satellite images and use these data sources for studies and analyzes in a web-based visualization environment. The interactive comparison charts for 2m air temperature allows to visually analyze and gather the information about model accuracy. It enables to adjust the forecasting results with additional methods by implementing statistical analyzes and provides a fairly high result in cases where the model’s sensitivity is low.
It is planned to improve the functionality of the platform by adding new visualization tools of various for-mats, such as to analyze and compare other near-surface atmospheric elements. Different nowcasting method-ologies based on artificial intelligence and the utilization of satellite imagery will be implemented for the develop-ment of a hazardous hydro-meteorological phenomena alarm system. The extended platform will be integrated with the available cloud services [15, 16, 17] by providing access to the required specialized climatic data.
The ultimate goal is to develop an integrated web-based service, which can be used by AHMS for operational weather forecasting and for data analytics for scientific studies.
Acknowledgments. The research leading to these results has been co-funded by the European Commission under the H2020 Research Infrastructures contract no. 675121 (project VI-SEEM) and the State Target Program ”Creating a cloud computing environment in order to solve scientific and applied problems”.
REFERENCES
[1] A. Gevorgyan, Summertime wind climate in Yerevan: valley wind systems, Climate Dynamics, 48:5–6 (2017), pp. 1827–1840. [2] Artur Gevorgyan, Hamlet Melkonyan, Rita Abrahamyan, Zarmandukht Petrosyan, Anna Shachnazaryan, Hrachya Astsatryan, Vladimir Sahakyan, Yuri Shoukourian, A Persistent Surface Inversion Event in Armenia as Simulated by WRF Model, in IEEE Proceedings of the International Conference on Computer Science and Information Technologies, CSIT’2015, pp. 105–110.
[3] C. Faccini, D. Cimini, R. Ferretti, F.S. Marzano, A.C. Taramasso, 3DVAR assimilation of SSM/I data over the sea for the IOP2b MAP case, Adv Geosci, 2 (2005), pp. 229–235.
[4] Hrachya Astsatryan, Vladimir Sahakyan, Yuri Shoukourian, Pierre-Henri Cros, Michel Dayde, Jack Dongarra, Per Oster, Strengthening Compute and Data intensive Capacities of Armenia, in IEEE Proceedings of 14th RoEduNet International Conference - Networking in Education and Research, NER’2015, pp. 28–33.
[5] Yuri Shoukourian, Vladimir Sahakyan, Hrachya Astsatryan, E-Infrastructures in Armenia: Virtual research environ-ments , in IEEE Proceedings CSIT 2013 - 9th International Conference on Computer Science and Information Technolo-gies, Revised Selected Papers, CSIT’2013, pp. 1–7.
[6] H. Astsatryan, Yu. Shoukourian, V. Sahakyan, The ArmCluster Project: Brief Introduction, in Proceedings of the International Conference on Parallel and Distributed Processing Techniques and Applications, PDPTA ?2004, pp. 1291– 1295.
[7] M. Hedges, T. Blanke, A. Hasan, Rule-based curation and preservation of data: A data Grid approach using iRODS., Future Gener. Comput. Syst, 25:4 (2009) , pp. 446–452.
[8] W. S. Jefrey , T. M. Hamill, X. S. Yucheng, Z. Toth, Ensemble data assimilation with the ncep global forecast system, Monthly Weather Review, 136 (2008), pp. 463–482.
[9] J. A. Sobrino, J. C. Jimenez-Munoz, L. Paolini, Land surface temperature retrieval from Landsat TM 5, Remote Sensing of Environment, 90(2004), pp. 434–440.
[10] M. Neteler, M. Bowman M. Landa M. Metz, Grass gis: A multi-purpose open source gis, Environmental Modelling & Software, 31(2011), pp. 124–130.
[11] William C. Skamarock, Joseph B. Klem, A time-split non-hydrostatic atmospheric model for weather research and fore-casting applications, Computational Physics, 227–7(2008), pp. 3465–3485.
[12] J.G. Powers, J.B. Klemp,et. al, The Weather Research and Forecasting Model: Overview, System Efforts, and Future Directions, Bulletin of the American Meteorological Society, 98–8(2017), pp. 1717–1737.
[13] Surajit Chaudhuri, Umesh Dayal, An Overview of Data Warehousing and OLAP Technology, SIGMOD Record, 26– 1(1996).
[14] S. Aissi, M.S. Gouider, T. Sboui, L.B. Said, Enhancing spatial data warehouse exploitation: a solap recommendation approach, In: Computer and Information Science, Springer (2016), pp. 131–147.
[15] Hayk Grigoryan, Hrachya Astsatryan, Tigran Gevorgyan, Vahe Manukyan, Cloud Service for Numerical Calculations and Visualizations of Photonic Dissipative Systems, Cybernetics and Information Technologies, 15–5(2017), pp. 89–100. [16] H. Astsatryan, W. Narsisian, Sh. Asmaryan, SWAT Hydrological Model as a DaaS Cloud Service, Springer Earth Science
Informatics, 9–3(2016), pp. 401–407.
[17] Hrachya Astsatryan, Vladimir Sahakyan, Yuri Shoukouryan, Michel Dayd, Aurelie Hurault, Ronan Guivarch, Arutyun Terzyan, Levon Hovhannisyan, Services Enabling Large-Scale Linear Systems of Equations and Algorithms based on Integrated P-Grade Portlal, Springer Journal of Grid Computing, 11–2(2013), pp. 239–248.