Science Arts & Métiers (SAM)
is an open access repository that collects the work of Arts et Métiers Institute of
Technology researchers and makes it freely available over the web where possible.
This is an author-deposited version published in: https://sam.ensam.eu
Handle ID: .http://hdl.handle.net/10985/6681
To cite this version :
Mohammad Ali MIRZAEI, JeanRémy CHARDONNET, Christian PÈRE, Frédéric MERIENNE
-Designing a 3D Navigation System Using Cognitive Factors - 2012
Any correspondence concerning this service should be sent to the repository
Administrator : [email protected]
Designing a 3D Navigation System Using Cognitive Factors
M. Ali Mirzaei∗ Jean-R ´emy Chardonnet† Christian P `ere‡ Fr ´ed ´eric M ´erienne§Arts et M ´etiers ParisTech, CNRS, Le2i, Institut Image
ABSTRACT
This paper focuses on the measurement and the mathematical def-inition of cognitive parameters of designing a navigation system based on these parameters. The nausea level due to different ve-locities of a 3D scene, the user head rotation around Yaw, Roll and Pitch axes, the delay between navigation device stimuli and the 3D display movement are measured. Appropriate mathematical func-tions are fitted to the measurements. A sickness level is defined as an accumulation of a nausea level due to the velocity and the delay. Assigning an analog control button on the navigation device will help the user to adjust the speed. The records of the test-bed and practical experiments prove the effectiveness of this kind of design. Moreover, due to the parametric design of the system, any mal-operation can be readjusted with further inquiries over the specific applications. In addition, any amendment or modification perfor-mance can be compared with the parametric criteria.
Index Terms: H.1.2 [Models and Principles]: User/Machine Systems—Human factors; H.5.2 [Information Interfaces and Pre-sentation]: User Interfaces—User-centered design
1 INTRODUCTION
Navigation is an important part of any real or virtual dynamic sys-tem. A lot of navigation and interaction devices with different func-tionalities for different applications were developed during the last decades. However, the list of navigation and interaction devices is not limited only to what we literary know in robotics, haptics, remote control systems. These devices cover a wide spectrum of applications and devices, for instance a gear handle of our per-sonal car is a kind of navigation device. Navigation and interaction devices of Virtual Reality (VR) systems or Virtual Environments (VE) attracted especial attention due to the rapid development of robotics and game consoles. Three-dimensional virtual environ-ments (VEs) are used in fields as diverse as manufacturing [14], medicine [9], construction [12], psychotherapy [16], design [11], and education [15]. They also play an important role in the inves-tigation of spatial processes, such as examining directional knowl-edge [19] or assessing spatial abilities [19] allowing researchers to design realistic experimental settings and a flexibly record user be-havior [8].
Topics such as navigation devices, metaphors, menus, user’s rep-resentations, etc., are just a short list of these research topics. The development of useful VE applications, however, needs an appro-priate user interface in a real environment and requires optimiza-tion of the most basic interacoptimiza-tions, in particular object manipula-tion, navigamanipula-tion, moving inside 3D; hence, users can concentrate on high-level tasks rather than on low level motor activities [18]. However, recently, some cognitive issues have emerged in VE such
∗e-mail:[email protected]
†e-mail:[email protected] ‡e-mail:[email protected] §e-mail:[email protected]
as motion sickness, cyber sickness; the effect of different metaphors on the end-users turns this topic to a serious concern of researchers. It seems selection of interaction devices for navigation and manip-ulation considering cognitive issues is one of the most challenging topics of engineering researches.
Travel is the motor component of navigation. Navigation is the task of performing the actions that move us from our current loca-tion to a new target localoca-tion or in the desired direcloca-tion. In addiloca-tion, watching a specific part of a 3D scene from different perspectives is demanding in almost all 3D applications [6]. In physical environ-ments, travel is often a no-brainer, or to be more precise, it involves unconscious cognition. Therefore, it is quite crucial that the 3D scene moves with the same (perceivable) speed as a human. There are many different reasons why a user might need to perform a 3D travel task. Understanding the various types of travel tasks is im-portant because the usability of a particular technique often depends on the task for which it is used.
Although traveling is among the most important interactions in VEs [13], we are not aware of any formal experimental studies which propose a design with the support of mathematics, and sys-tematically evaluate and categorize traveling techniques for immer-sive traveling inside VEs. Prior research relates primarily to the assessment of user performance as a function of the properties of input and output devices [20]. In contrast, the focus of some study is on human factor aspects of mappings between the user input (captured by input devices) and the resulting actions in VEs [13]. Tracking is one of the fundamental tasks for navigation in 3D envi-ronments.
Currently, there is little understanding of how navigation inter-faces should be designed to maximize user performance in VE [13] and provide sickness-free handling gadget. Research that system-atically investigates human factors and design implications of im-mersive navigation tasks, devices, metaphors, remains sparse [7]; consequently, VE designers have had to rely on their intuition and common sense rather than on the guidance of established theory and research results. However, as Brooks [2] has noted, the unin-formed and untested intuition for metaphor design is almost always wrong.
Although the diversity of VE applications makes it necessary to design VE interfaces that support domain dependent needs [3], some tasks are common to all VE applications and are essential, even when they are not the main objective of a user in a VE. Nav-igation can be defined as the process whereby people determine where they are, where everything else is and how to get to particu-lar objects or places [10]. Navigation is the aggregate task of way finding and motion. Way finding is the cognitive element of naviga-tion. It does not involve movement of any kind but only the tactical and strategic parts that guide movement [4]. The navigation behav-ior of users in VEs has been investigated to a large degree [5]. To navigate successfully, people must plan their movements using spa-tial knowledge they have gained about the environment and which they store as a mental map. However, accurate spatial knowledge of VEs typically develops very slowly after long periods of navi-gation or study, and users may not always be willing to spend this time [17]. Thus, if the navigation support provided by user inter-faces of VEs is insufficient, people become disoriented and get lost. In fact the final objective of current researches is to answer these
two questions: 1) how can we select a metaphor and the correspond-ing device for a specific task to have comfortable and more natural (close to human action in real life) navigation? 2) if a device is selected for interaction, how can the parameters of the device be adjusted to remove any cognitive problems? (or how can we have a sickness-free navigation with the selected device?)
A lot of navigation metaphors and their corresponding devices have been proposed during the last decades [1]. However, the cur-rent literature will concentrate on tracking and traveling in a 3D scene, taking into account cognitive parameters. It means, first we introduce available navigation, we evaluate some cognitive aspects and introduce some cognitive parameters, then, based on these pa-rameters, a mathematical model is proposed to be used in future designs or studies.
This paper is organized as follows: traveling and navigation metaphors will be described and implemented in section 2. In sec-tion 3, a test bench for measurement will be proposed and the ap-paratus of the real-test will be described. The measurements will be illustrated and interpreted based on mathematical definitions in section 4. In section 5, a mathematical model of navigation inter-faces based on cognitive parameters will be proposed, before the conclusion.
2 IMPLEMENTATION
Knowing the sub-tasks definition for any kind of navigation in VEs will help to design a generic traveling and tracking metaphor (see Figure 1). Assume we are planning a travel from point A to E. Sup-pose points B, C and D are located between these two points. The very basic question is how to go from point A to E? If the basic function of traveling is defined as going from point A to B, then the entire travel is a combination of four small travels or applying four times this function. Moreover, this strategy could be employed everywhere with any kind of navigation tool, and it is quite a plat-form independent definition. That is why defining these detailed metaphors has great deal of importance. The travel function should have a starting point, a target point, a specification of velocity and the acceleration and deceleration rate.
Figure 1: Generic metaphor definition for tracking and traveling inside VEs.
For this purpose, we use VR Jugglua. VR Jugglua scripting lan-guage manages the relation between virtual reality software plat-forms for a single and cluster support in one side, and those who are designing the efficient content for interaction and navigation
metaphors through prototyping. VR JuggLua is a high-level virtual reality application framework based on combining Lua, as a dy-namic and interpreted language, with VR Juggler and OpenScene-Graph. This framework allows fully-featured immersive applica-tions to be written entirely in Lua, and also supports the embedding of the Lua engine in C++ applications. Jugglua has been success-fully used in an immersive application implementing two different navigation techniques entirely in Lua, and a physically-based vir-tual assembly simulation, where C++ code handles physics compu-tations while Lua code handles all display and configuration. The required function was entirely developed in this scripting language. Like native C++ VR Juggler applications, VR JuggLua-based ap-plications can support a wide variety of systems ranging from a sin-gle desktop machine to a 49-node cluster successfully. Sometimes, it is necessary to have access to the child node of the 3D model. This facility is provided by adding some functions and classes. The osgLua (OpenSceneGraph Lua) introspection-based bindings facil-itate scene-graph manipulation from Lua code. A thread-safe run buffer allows new Lua code to be passed to the interpreter during run time, supporting interactive creation of scene-graph structures. One of the best part of Lua language is a navigator test bench which facilitates the execution of files with lua extension (*.lua). Fig-ure 2 shows the test bench GUI. There is a part for scripting in the test bench that helps the user to test only a single line of command, exactly in the same way as done in the command line of MATLAB.
Figure 2: 3D display of Jugglua GUI.
After successful connection of the device, a 3D model can be easily uploaded and the user can navigate with a mouse or a key-board on the laptop or desktop PC. For our visualization purpose, we used this interface to see the position of the input device. The position of the head can be seen as a ball in the middle of our 3D scene in Figure 2. The only way to see the coordinates of the head in Jugglua is to use the print function. As a model depicted in Figure 2, we used the digital mockup of our laboratory, the Insti-tut Image in Chalon-sur-Saˆone. Not only the navigation function should be coded, but some subsidiary functions need to be written to provide enough feedback from the system. This requirement is achieved under the platform shown in Figure 3.
The test bench collects data from three essential components of the virtual environment: the user, the navigation device and the 3D system. Bio-feedback (e.g., EEG signal, blood pressure) will be recorded to show the situation of a user when operating with nav-igation tools inside a CAVE for example. EEG signal can provide
Figure 3: Interconnection between feedback provider functions, main navigation functions, navigation devices, 3D display and the render-ing system.
the most complete feedback, however the feedback can be returned from simpler sensors like blood pressure, skin resistance sensor, heart rate sensor. Another signal is the image stream that comes from an external camera. This camera is responsible of showing the response of the system to the input command. Acceleration, velocity, the delay between input and output, etc., will be extracted from this signal.
Finally, VRPN interfacing will help us to record appropriate sig-nals from the navigation tool and other input devices. Simultaneous analysis of these signals and feedback will help us to understand the system performance deeply. Since we collect data from dif-ferent users, based on user characteristics, age, etc., we can select appropriate values for the setting units. Different criteria could be selected to verify the results of the tests and then be applied to the setting units. The highlighted region in blue color in Figure 3 is under the current research. The objective of the next step is to find an accurate mapping function with continuous measurement from the process, users and the navigation tool, to improve the quality of the navigation system.
3 EXPERIMENT 3.1 Apparatus
A virtual research set of a CAVE system with an ARTracker is used in this study. The indicators (a set of aligned balls) are mounted on 3D glasses. The system is promoted with an NVidia Quadruplex Graphic processing unit. Different navigation tools can be attached by VRPN or Gadgeteer interfacing. In this experiment, a fly-stick, a gamepad, a mouse and a keyboard are connected to the system as navigation tools by a wireless connection. The user wears 3D glasses in the CAVE to see a virtual 3D scene which is projected inside the CAVE (Figure 4).
The glasses are synchronized with the projectors so that each eye only sees the correct image. People using the CAVE can see objects and scenes apparently real, and can walk around them, get-ting a proper view of what they look in reality. This is possible with optical illusions and laser triangulation. The frame of the CAVE is
Figure 4: Summary of CAVE system operation.
made of non-magnetic stainless steel to interfere as little as possible with the electromagnetic sensors. A CAVE user’s movements are tracked by a tracking system (like a head mounted tracker) and the 3D scene is updated based on the user’s current location. The com-puters rapidly generate a pair of images, one for each of the user’s eyes. The position of the head in the Cartesian coordinates (x, y, z) and roll, pitch, yaw coordinates of the head are registered by the interface software of the head tracker. The standard of different ro-tations is provided in Figure 5. This standard will be used later to record, analyse and demonstrate the data.
Figure 5: Illustration of the viewer-central coordinates used in the head mounted tracker data recording.
3.2 Navigation tasks
Two groups of tasks were examined in this experiment: 1) walk-ing (forward, backward, up and down), 2) turnwalk-ing to the left and right. Complex movement is interpreted by these two groups of ba-sic tasks. For example going from point A to B may contain a series of these two tasks. It can be formalized by rotation and translation matrices.
3.3 Data grabbing system
Different measurements are saved in a *.txt file with a time
stamp for each sample and component. For example, forward, backward, rotation to the left and right, up, down movements, and their associated mechanical and software resolutions are recorded for a given navigation tool (for example a joystick).(x,y,z) coordi-nates and rotation around Pitch, Yaw and Roll axes are stored in the
same*.txtfile but in a second line. A third line is used to save
measurements of the acceleration sensor at the first moment (the first time stamp). Then, other lines of the file are used to save the over mentioned variables of navigation, tracker and sensor for the second time (second time stamp) and so on. If our sampling time is one millisecond and the first index of the time stamp is 0.000s then the second index is 0.001s. Therefore, the second line of the
*.txtfile is ”Tracker, 0.000, x0, y0, z0,θx0,θy0,θz0”.
A couple of images are recorded by the virtual camera of OpenGL and an external camera for each location of the tracker, with the same time stamp as the tracker, acceleration sensor and navigation tool. For instance, the second couple of images gets 0.001s time stamp. Acceleration and velocity of the scene are cal-culated from these two image streams. The time stamp is used to calculate the time difference between the input and output of the system, as well as the delay between different processing units. Two sets of analysis tools were developed in MATLAB and C++. Currently, these tools are applied offline just to extract features from the measured data. However, with a fast platform, it can be used as a real-time solution. Figure 6 shows the interconnection of record-ing modules, processrecord-ing and analysis units. As seen, one of the outputs of the tool is the delay of different processing units.
Figure 6: Interconnection between processing units and analysis tools.
4 RESULTS
So far, the implementation of the system and the test bench for the data collection has been explained. Here, we try to interpret the information and take out some features from the measurement, to be able to parameterize the navigation system and have a full control over it in real-time performance. Figure 7 shows the measurements of the velocity around the Yaw and Roll axes. First, user movement and spatial shift of the scene were recorded, then the velocity was computed from this movement by a simple speed equation, which is the difference of the spatial shift over time (see Figure 7). The velocity is computed by using the images of a high-speed camera.
As seen in Figure 7, there are sharp variations of velocity in some points (at times: 3600ms, 3750ms, 3970ms, and 4025ms). Sharp variations in velocity mean an acceleration (positive variation) and a deceleration (negative variation). Deceleration in this context looks like making a sudden break in the real movement, like when we are driving a car on the road. Intuitively, a sudden break most of the time makes a motion sickness. Based on our experience, the same deceleration gives rise to cyber sickness. Acceleration of the user head tracker and the 3D scene can be directly related to the nausea and vomiting level of a user. But it is not still clear that this relation can be linear or non-linear via a multivariable function. Because speed can be seen as a relative parameter, thus either the user or the scene movement or both of them affects the visual perception, which in turn leads to nausea (in the worse case vomiting). Table 1 shows the acceleration and velocity around the Yaw and Roll axes. Here just the acceleration process is illustrated.
Figure 7: Velocity around the Yaw and Roll axes.
The acceleration and velocity can be controled by the user via the navigation device. In fact when the user feels sick, he can pitch down or up the speed of movement by a button on the navigation device. The rate of these variations can be considered as another symptom of nausea. As a result, the speed rate signal of the nav-igation device plays a critical role in the sickness-free navnav-igation design, because it can reflect human factors while it is recording navigation data. Figure 8 shows the simultaneous variation of the speed rate and the rotation variations along the vertical axis.
Figure 8: Simultaneous variation of rotation angle variation and rota-tion accelerarota-tion/velocity index.
As seen, when the step of movement is reduced and the velocity of movement gets faster and faster, rotations gets smoother. Be-tween 3600ms and 3750ms, and 3750ms and 3900ms, the speed control was unchanged; it means that the velocity of movement was appropriate for the user, which in turns means less sickness. The duration that users navigate in the 3D system is very impor-tant, because it is another important factor leading to sickness, and, as the time of navigation increases, the level of sickness can in-crease. Figure 9 shows three different times of navigation: in the first case (#1), the time of navigation increases dramatically, so the level of nausea will increase in the low velocity phase faster than in case 2 or 3, and after 40 m.s−1, navigation is stopped. The
reduc-Table 1: Yaw, Roll acceleration and velocity variation during 8 steps 1 2 3 4 5 6 7 8 roll-velocity 2.04 1.76 2.75 15.61 21.2 25.51 30.02 33.1 yaw-velocity 2.1 1.29 2.01 17.81 18.4 23.17 24.23 28.18 roll-acceleration 1.01 1.09 2.08 37.2 38.5 40.31 45.13 45.89 yaw-acceleration 1.41 6.77 5.1 22.71 30.1 32.84 34.2 34.15
tion in the curve does not mean a dramatic reduction of the level of nausea in higher speed, in contrast, it means the user gets badly sick and leaves the system. This situation appears practically after 15 minutes of navigation with very low speed. The duration of ex-periment is less in the two other cases (#2, 3). Especially, in case 3, navigation is continued with higher speed because the level of nausea was less in the low speed phase, due to a short duration of this phase. However, in the second case, the level of nausea in-creases in the higher speed phase, because of a longer duration of a low speed movement. The average of five measurements under longer navigation, and one of the five cases are shown in Figure 9. There is a curve fitting to the average curve which is mostly used in mathematical modeling. As seen, the behavior of the average curve is closer to the second category (#2) while the individual curve is closer to the third category (#3).
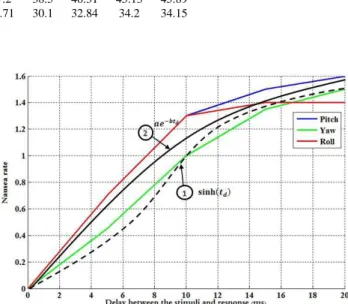
Figure 9: Level of nausea versus speed of navigation and time. The delay between navigation device stimuli and the scene movement also is important because delay leads to sickness too. To solve this issue, the delay of the system response is computed from the synchronous measurements, as explained in the test bench. Figure 10 shows the effect of rotations around three main axes on the nausea. As seen, when the delay increases, the level of nausea increases in all the cases but with different trends and curves.
The delay due to the stimuli of the rotation around Pitch and Roll axes increases the level of nausea with an exponential trend, as shown in trend 2 of Figure 10. The behavior of the nausea level versus the delay due to the stimuli of the rotation around Yaw axis is more similar to a sinh function.
5 DISCUSSION
A navigation system without parameters tuning for sure will induce sickness. The level of sickness is dependent on a lot of parameters like age, gender, race, profession, career, previous experiences, etc.
Figure 10: Relation between the level of nausea and the response delay.
That is why the level of sickness is different from a user to another one, and in the same situation, it might be perceived by a user while no symptoms appear in another user. As seen, velocity and delay have great effects on the level of nausea and total cyber sickness. These parameters will help us to propose an effective navigation system based on cognitive parameters. The proposed navigation system taking into account human cognitive issues with two factors of movement velocity and response delay is shown in Figure 11.
Figure 11: An efficient navigation controller based on cognitive fac-tors.
One of the important aspects of this model is the parametric defi-nition which makes it suitable for real-time application, and a com-parison of the performance under different circumstances and situ-ations. As explained before, the navigation parameters depend on
different factors of the users. Therefore, the best solution is to pro-vide a dynamic level of sickness and give a notification to the user before the sickness level goes beyond specific threshold.
6 CONCLUSION
Different steps of a navigation system design, the test-bed estab-lishment and the data collection procedure have been explained. By analyzing the collected data, we came to conclusion that the relative velocity of the scene versus user movement and the delay between different processing units, especially the delay between inputs and outputs of the system, are two important cognitive factors. Using these factors, the navigation system were proposed. The proposed system is quite efficient because it provides a real-time solution for 3D applications and is not platform or user dependent. Moreover, it is quite easy to implement as a simple function. Besides, it is a quantitative representation that lets the designer adapt the solution and set it up for new circumstances, and the modification in the per-formance or the parameters of the system can be easily compared with previous situations, and any amendment can be easily verified.
REFERENCES
[1] D. Bowman, E. Kruijff, J. LaViola, and I. Poupyrev. 3D user inter-faces: theory and practice, volume 1. Addison-Wesley Boston (MA), 2004.
[2] F. Brooks. Grasping reality through illusioninteractive graphics serv-ing science. In Proceedserv-ings of the SIGCHI conference on Human factors in computing systems, pages 1–11. ACM, 1988.
[3] J. Chen and D. Bowman. Effectiveness of cloning techniques for ar-chitectural virtual environments. In Virtual Reality Conference, 2006, pages 103–110. IEEE, 2006.
[4] R. Darken and B. Peterson. Spatial orientation, wayfinding, and rep-resentation. Handbook of virtual environments, 1:493–518, 2002. [5] R. Darken and J. Sibert. A toolset for navigation in virtual
environ-ments. In Proceedings of the 6th annual ACM symposium on User interface software and technology, pages 157–165. ACM, 1993. [6] M. G ¨obel. Industrial applications of ves. IEEE Computer Graphics
and Applications, 16(1):10–13, 1996.
[7] K. Herndon, A. van Dam, and M. Gleicher. The challenges of 3d interaction: a chi’94 workshop. ACM SIGCHI Bulletin, 26(4):36–43, 1994.
[8] P. Jansen-Osmann. Using desktop virtual environments to investigate the role of landmarks. Computers in Human behavior, 18(4):427–436, 2002.
[9] N. John. The impact of web3d technologies on medical education and training. Computers & Education, 49(1):19–31, 2007.
[10] S. Jul and G. Furnas. Navigation in electronic worlds: a chi 97 work-shop. Sigchi Bulletin, 29:44–49, 1997.
[11] M. Lou Maher, P. Liew, N. Gu, and L. Ding. An agent approach to supporting collaborative design in 3d virtual worlds. Automation in Construction, 14(2):189–195, 2005.
[12] P. Mehdi Setareh, D. Bowman, A. Kalita, et al. Development of a virtual reality structural analysis system. Journal of architectural en-gineering, 11:156, 2005.
[13] M. Mine. Virtual environment interaction techniques. UNC Chapel Hill Computer Science Technical Report TR95-018, 1:507248–2, 1995.
[14] T. Mujber, T. Szecsi, and M. Hashmi. Virtual reality applications in manufacturing process simulation. Journal of Materials Processing Technology, 155:1834–1838, 2004.
[15] Z. Pan, A. Cheok, H. Yang, J. Zhu, and J. Shi. Virtual reality and mixed reality for virtual learning environments. Computers & Graph-ics, 30(1):20–28, 2006.
[16] G. Riva. Cybertherapy: Internet and virtual reality as assessment and rehabilitation tools for clinical psychology and neuroscience, vol-ume 99. Ios Pr Inc, 2004.
[17] R. Ruddle, S. Payne, and D. Jones. The effects of maps on navigation and search strategies in very-large-scale virtual environments. Journal of Experimental Psychology: Applied, 5(1):54, 1999.
[18] K. Stanney. Realizing the full potential of virtual reality: human fac-tors issues that could stand in the way. In Virtual Reality Annual Inter-national Symposium, 1995. Proceedings., pages 28–34. IEEE, 1995. [19] D. Waller. The walkabout: Using virtual environments to assess
large-scale spatial abilities. Computers in human behavior, 21(2):243–253, 2005.
[20] B. Watson, V. Spaulding, N. Walker, and W. Ribarsky. Evaluation of the effects of frame time variation on vr task performance. In Virtual Reality Annual International Symposium, 1997., IEEE 1997, pages 38–44. IEEE, 1997.