Technology researchers and makes it freely available over the web where possible.
This is an author-deposited version published in: https://sam.ensam.eu Handle ID: .http://hdl.handle.net/10985/13054
To cite this version :
Lynda HALIT, Andras KEMENY, Armand LE GOUGUEC, Frédéric MERIENNE, Hakim MOHELLEBI - Head Motion parallax effect on driving performances when using an AR-HUD: Simulation Study on Renault’s CARDs Simulator - In: Driving Simulation Conference, Allemagne, 2015-09-16 - Driving Simulation Conference - 2015
Head Motion parallax effect on driving
performances when using an AR-HUD: Simulation
Study on Renault’s CARDs Simulator
Lynda Halit 1,2, Andras Kemeny 1,2, Armand Le Gouguec 1,2, Frédéric Mérienne 2, Hakim Mohellebi 1
(1) Renault, Virtual Reality and Immersive Simulation Center, TCRAVA 013, 1, avenue du Golf 78288 Guyancourt, France
[email protected], [email protected], [email protected], [email protected] (2) Arts & Métiers ParisTech – Institut Image ENSAM
Abstract – Augmented Reality information on Head-Up display (AR-HUD) in a car can be relevant for visual aid
and for strengthening the safety of the driver. However, some display Parameters are necessary to guarantee the good perception of these information and the driving environment. In this study, we are interested on head motion parallax, and specifically the ones generated with lateral head movements of the driver. In fact, during natural observation this cue physiologically strengthens depth perception and its absence may impact driver perception. Our goal is to demonstrate the impact of the generated movements and the projection distance on driver’s perception, using an AR-HUD. This was investigated in terms of eye-comfort and driver preferences. In this article, we focus on the primary driving task with basic lane marking highlight, and we observe how the different conditions affect subject’s perception especially during curves negotiation. Results show the importance of eye-tracking when using an AR-HUD for alignment accuracy and better comfort which directly driver performance and safety.
Keywords: Augmented Reality Head-Up Display (AR-HUD), Perception and Motion Parallax, Driving Simulation,
Driver Behavior and Performance
Introduction
Perception is highly involved during driving, and many visual strategies are used by drivers to perform well this task. In order to facilitate the achievement of this task and help assure the security of the driver, a Head-Up Display has been admitted as a satisfactory solution to respond to this need without disturbing or distracting the driver from the road, since information is directly displayed in his vision field. Moreover, recent advances in augmented reality allow to highlight the real world in real time and those information can be displayed in depth on a Head-Up Display.
In the present study, we are concerned about the perception of AR depth information by the drivers and the impact of two important linked parameters: the impact of the generated head motion parallax (with and without head tracking consideration when displaying AR information), and the projection distance (6m and 10m). An experimentation was carried out in
CCARDS-Renault driving simulator, where a virtual HUD was designed virtually and allowed to highlight road lane marking for enhanced perception and better anticipation of car trajectory. This installation allowed to test the four set experimental conditions with simulation experts, and thus through a defined driving path. In this paper, we first start by a literature review on motion parallax and some previous work done on the subject. Then, we expose the experimental protocol. Afterward, results are shown and discussed. Finally, we conclude on these obtained results.
Literature Review
Head motion parallax is a strong depth cue used by drivers continuously to estimate depth of near and far environmental objects. This process is done through the differential motion on the retina, which is generated by either objects or observer movements. During our displacement, images of nearby objects move faster on the retina than those of distant objects [Ler09].
As we have shown in our previous work [Hal14], head motion parallax should be taken to consideration when designing an AR-HUD, especially when the projection distance is less than optical infinity. Misalignment can interfere with the driving scene, generating misperception of pertinent information for drivers, and cause safety issues. In these earlier studies, results on a static simulator showed that the correction of this misalignment, thanks to head-tracking device, was relevant for most drivers, and produced a significant difference. Mestre and his collaborators in [Mes12], investigated head motion amplitude in the static simulator, and results confirmed that head movements are part of a global visual anticipatory strategy, in accordance with results observed during real driving [Mes12], head is lined up with some visual features of the road.
In addition, head motion parallax is necessary for driver space location and depth estimation of different objects around him, such as vehicles, obstacles, and road signs. Authors in [Ayt12], studied the motion parallax cue from microscopic head movements during visual fixation. They indicated, for example, that there are involuntary head movements continuously under a normal viewing condition, and eyes are therefore shifted in space. Moreover, they specify that images are never stationary in our retinas, even when attempting to maintain steady gaze on a single point, because of small fluctuations.
This indication is even more evident when driving a car, since the driver is carried through the velocity of his vehicle. When the driver is looking at the horizon in his central vision, many objects scroll through rapidly and attract unconsciously his attention, even if the driver doesn’t always shift his gaze, micro-saccades are made involuntarily which reinforce space localization.
In the study by [Lan01], they found a close relationship between the driver’s head direction and the rate of rotation of the car 1s later. They proposed that head direction is driven by the same information that he uses to control steering and speed, namely his knowledge of the track and his racing line round it. They for example highlight the fact that when a driver directs his head at an angle proportional to his estimate of car rotation speed, this automatically bring his head roughly into line with the tangent points of the bends.
Nawrot in [Naw03], studied how depth from motion parallax scales with eye movement. They focused on this cue because they considered that it’s one of the most important depth cues. The advantage of this depth cue, is that it’s used for short and very large viewing distance [Gib50]. Although, the effectiveness of motion parallax created with head translations decrease with viewing distance [Ono01].
Experimentation Protocol
Context
Drivers need to use the information from motion parallax to deduct depth information from the environmental objects. Unconsciously in most cases, drivers use this information and we can’t control or ensure a head steady state position during driving. It’s important that drivers’ feels totally free in their movements, since it was demonstrated in the literature that when using the motion parallax cue performance of depth perception is strengthened.
The driver is continuously in motion; along with the vehicle velocity and also generates additional lateral movements while performing his task. This is why it’s important to evaluate the degree of head movements and how this affects perception of the driver. AR-HUD design should consider how to keep this natural process of depth perception and not alter this cue, even if AR and real information are not perceived at exactly the same distance.
AR-HUD Simulation & Conditions
An Augmented Reality Head-Up Display (AR-HUD) is one of the solutions to highlight important information in the driving scene. It allows the driver to better perceive important information in the road and be aware of potential dangers. Although, it is important to optimize technical parameters to avoid visual discomfort and inconvenient intrusion.
In this study, the AR-HUD was simulated virtually, and consisted of lane marking highlight (as shown is Figure.1 below) designed as an aid for better perception. This information is typically used for car trajectory control. As seen in [Mes04], they pointed out the study by Riemersma in 1981, which demonstrated that the edge line motion was an effective visual cue for the control of heading and lateral control. In the figure below, the designed AR-HUD for this experiment.
Figure 1. Designed AR-HUD "Lane marking highlight"
The virtual simulation of AR-HUD allowed us to evaluate and link two major parameters: (1) the Impact of the generated parallax with head
movements, (2) the projection distance of the AR-HUD. The first condition was assessed through activating and disabling head tracking for displaying augmented reality information on the virtual head-up display, in order to evaluate the appreciation rate of alignment accuracy. The second condition concerned the depth of augmented reality information, where two projection distances were set for the virtual head up display: 6m and 10m. The goal was to associate the impact head motion parallax with depth of the HUD, report any sort of discomfort if any, during the four experimental conditions, and finally pick the best combination for participants.
Participants
Ten expert subjects, from the Virtual Reality and Immersive Simulation Center (Renault-Technocenter), volunteered to participate to this experiment, and both genders were represented. The age varied from 23 to 51 years old. They all had a good visual acuity (either naturally or with ophthalmic correction) and were all able to perceive stereopsis. The experimental conditions were initially ignored by all subjects to guarantee natural behavior and avoid results skewing.
Material & Methodology
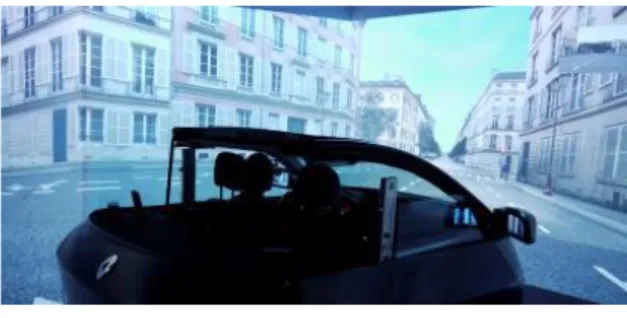
This experimentation is carried out using RENAULT’s “CARDS” Driving Simulator (in Figure.2) with CAVE like 3D and 4 sides display.
Figure 2. CCARS Driving Simulator - Renault
Every subject had 4 driving sessions in total, which lasted about 6 minutes each (depending on participant’s speed). The course of the experiment was conducted during photopic condition (daylight).
After each session, subjects were asked to fill in a questionnaire. The order of the sessions was counterbalanced, in order to avoid bias due to the learning effect.
For every driver, the initial posture was recorded, and head motion is recorded in a frequency of 20 Hz.
The driving scenario consisted of two zones: an urban environment where the driving speed was limited between 50-70 km/h, and peripheral zone where speed was limited at 110 km/h.
Itinerary indication was intentionally done through verbal GPS without any image. Thus, in order to avoid interference with our visual interface system, and make sure that the reported feedback concerns the chosen information displayed in the virtual HUD and the alignment with the real world.
Hypothesis
In order to study the interaction between the two defined factors: head motion parallax and the projection distance, and their impact on driver’s perception, different parameters are chosen to evaluate the comfort of the AR-HUD and the combination with the driving scene.
Our previous experience allowed us to make some observations and make assumptions concerning the visual comfort of drivers. So the correction of head motion parallax with tracking is expected to have a significant effect on driver comfort viewing, especially for the closest projection distance (6m in our case). This would affect focusing ability, line marking distinction, alignment precision during curves and straight lines, and driver’s behavior. An adaptation strategy could be adapted by drivers when tracking is not enabled for system display. The preference for the tracking system is expected to be considerably high with consequently better alignment precision during curves and straight lines. Two projection distances are chosen in the conducted experimented, the goal is to relate the depth of augmented reality information and the head motion parallax. It’s more likely less distracting and possibly lower effects at 10 meters than 6m. Although, even if the projection distance is theoretically lower than optical infinity (less than 6 meters), the distance to screen is stationary and is equal to 2.2 meters. Which makes the eye accommodate always on screen, even though the convergence distance is different. It was demonstrated in the literature
[Ler09]
that the more this depth parallax distance is high (between convergence distance and accommodation distance), the more it departs from natural physiological condition, which may create more eyestrain after some time. To limit its impact and motion sickness, each driving session is limited to 7 minutes maximum and questionnaire are filled just after the session, which also allows to have a little break from the simulation environment.The succeeding parts below show obtained results for the evaluated parameters.
Parameters analysis
The statistical analysis was done through a subjective study through questionnaires.
Subjects were asked clearly if they could focus easily on the real marking and the virtual information. Resulted values of reported difficulty are evaluated with a scale of 10 points from: none (no focusing problems at all = 0), to High (= 10). Average values are shown in the histogram below with a confident level of 95%.
Figure 3. Average ranks of focusing difficulty
1- Comparison of focusing problems with and without tracking: no significant difference was detected when comparing the system that included head tracking and the one that didn’t.
2- Comparison of focusing problems between the two projections distances (6m and 10m): difference of focusing abilities between the two distances revealed significant results: p=0.0361 <0.05, (h=1, z=2.0955, ranksum=131.5).
In histograms showed in Figure.3 we notice that according to the surveyed population, the worst situation where focusing problems were important is the case where the projection distance was at 6m and no head tracking consideration.
II-
Line marking distinction
Subjects were asked to evaluate the degree of recognition and distinction between real marking and augmented reality information. The goal here is to evaluate how this depth perception is influenced by motion parallax and the projection distance.
1- Comparison with and without head tracking consideration: there isn’t any major difference detected whether the projection distance was at 6m or at 10m.
Parallax impact on line marking distinction is negligible, whether subjects were head tracked or
not. This means that they could distinguish correctly the augmented reality highlight from real lane marking.
2-
Comparison between the two projection distances (6m and 10m): in the histogram in Figure.4 below, we can see that when the AR-HUD is displayed 10m away, we have better ranks for the lane marking distinction.Figure 4. Average ranks for lane marking distinction
The best configuration for the majority of the population is the when head-tracked and the projection distance is at 10m. We could suppose that in that case the system is more reliable for most participants. In the contrary, when head tracking was off and the projection distance of 6m, it wasn’t as much obvious for most subjects. Although, when applying a statistical test, the difference was not statistically significant (p=0.3435, h=0, z=0.9473,
ranksum=117).
III-
Precision of the system and
alignment of AR information
Subjects were asked to evaluate the precision of the AR-HUD in terms of alignment of AR and the real world after each driving session, and thus during curves and straight lines. In Figure.5 (during curves) and Figure.6 (during straight lines) below, average values of attributed ranks are shown in a scale of 10, where the maximum values represents a very high precision.
Alignment precision during curves
0 1 2 3 4 5 6 7 8 9 10 6 m 10 m 6 m 10 m With Head-Tracking WithoutHead-Tracking R A N KS O F F O CUS IN G DIF FICUL TY 0 2 4 6 8 10 12 6 m 10 m 6 m 10 m With Head-Tracking Without
Head-Tracking R A N KS O F L A N E DIS TIN CT IO N
Figure 5. AR alignment precision during curves
1- Comparison of alignment precision with and without tracking: when comparing ranks of Augmented Reality (AR) alignment precision, we clearly see higher scores for the system that included head tracking. We can distinguish the best situation where information is judged accurately aligned: System with head tracking and projection distance of 10m. In the contrary, the worse situation of very weak alignment was when the system didn’t use any head tracking with a projection distance of 6m. Distance 6m
The difference in the alignment with and without tracking was considerable during curves and straight lines.
During curves 80 % of the population noted a difference (10 % medium difference, 70% strong difference)
During straight lines 80 % of the population noted a difference (40 % medium difference, 40 % strong difference)
The statistical test for the comparison of: system 6m-with tracking vs system 6m-6m-without tracking yielded significant results: p=0.0015 <<0.05 (h=1, z=3.1784,
ranksum=146).
Distance 10m
The difference in the alignment with and without tracking was considerable during curves and straight lines.
During curves 100% of the population noted a difference (10 weak difference, 30% medium difference, 60% strong difference) During straight lines 100% of the
population noted a difference (20% weak difference, 70% medium difference, 10% strong difference)
The statistical test for the comparison of: system 10m-with tracking vs system 10m-without tracking yielded significant results: p=0.0015 <<0.05 (h=1,
z=3.1784,ranksum=146).
2- Comparison of alignment precision between the two projections distances (6m and 10m)
It may be noted that subject were tempted to put higher scores for the precision scale for the system 10m-with tracking then to the system 6m-with tracking. This can be explained by the fact that subject didn’t converge as easily to the system at 6m-with tracking as they easily did to the one at 10m-with tracking. Some subjects reported that it didn’t seem as comfortable.
The statistical test for the comparison of: system 10m-with tracking vs system 6m-with tracking yielded significant results: p=0.0257 <0.05
(h=1, z=2.2312,ranksum=134). Some subjects
reported a misleading impression of depth in the case of projection distance 6m, others reported that from time to time they had a hard time to merge further real line marking with the displayed virtual reality information.
The statistical comparison between the system 10m-without tracking vs system 6m-without tracking didn’t reveal any significant difference
(p=0.7186, h=0, z=-0.3604, ranksum=100). This can
be explained by the fact that alignment precision of the AR system wasn’t sufficient for both distances (6m and 10 m) when head tracking was not used.
Alignment precision during straight
lines
Figure 6. AR alignment precision during straight lines
0 1 2 3 4 5 6 7 8 9 10 6m 10m 6m 10m With Head-Tracking Without Head-Tracking
R A N KS O F A R A LIG N ME N T P R ECIS IO N 0 1 2 3 4 5 6 7 8 9 10 6m 10m 6m 10m With Head-Tracking Without Head-Tracking
R A N KS O F A R A LIG ME N T P R ECIS IO N
1- Comparison of alignment precision with and without tracking:
The statistical test for the comparison of: system 10m-with tracking vs system 10m-without tracking yielded significant results: p=0.0213 <0.05
(h=1, z=2.3031,ranksum=134.5).
The statistical test for the comparison of: system 6m-with tracking vs system 6m-without tracking didn’t yield any significant result (p=0.2948,
h=0, z=1.0477, ranksum=118.5). Some subjects
were highly disturbed when the projection distance was at 6m and some of them reported that they didn’t rely on the system and didn’t look at it as much as when it was displayed at 10 m away.
2- Comparison of alignment precision between the two projections distances (6m and 10m)
The statistical test for the comparison of: system 10m-with tracking vs system 6m-with tracking yielded significant results: p=0.0106 <0.05 (h=1,
z=-2.5547,ranksum=72).
The statistical test for the comparison of: system 10m-without tracking vs system 6m-without didn’t yield any significant result (p=0.1409, h=0,
z=-1.4723, ranksum=86).
All subjects (100%) highly preferred overall the session with 10m projection distance whether head tracked or not, and all of them agreed that it was much more comfortable visually, even though they were not informed that the changing condition between the two sessions was the depth projection.
IV-
Tracking preference analysis
The large majority of subjects preferred the session where motion parallax was corrected. In the histogram below Figure.7, the average preference rank is represented with a confident level of 95%.
Figure 7. Preference average rank for head tracking session
The session where the AR-HUD is at 6m away, 70% of the population preferred the driving course where head tracking is included (Scale 10, average=8.21, Median=7.5, standard deviation=1.89). Other subjects didn’t have any preference.
As for the second session, where the distance is moved forward at 10m, the head tracking preference reached 90% (Scale 10, average=8.61, Median=10, standard deviation=2.41), and 10% didn’t show a preference.
V-
Behavior adaptation analysis
The change in behavior of the driver and an effort in head adjustment would signify that subjects were disturbed when head tracking wasn’t active for displaying augmented reality information, to overcome this perception discomfort a head stable strategy would be adapted.
1)
Speed reduction
A tendency of speed reduction when the projection distance of the AR-HUD is reported by subjects but statistical test didn’t revealed significant. (At 6 m: 60% of the population reported speed reduction with 40% weak, 40% medium and 10% at10 m: only 30% with 20%weak, and 10 strong).
2)
Head fit strategy
Subjects reported some adaptation strategy of head movements in this experimentation. At 6m, 70% of the population affirmed it, with 30% weak, 20% medium, and 50% strong. At 10m, less population reported this behavior 60%, with 20% weak, 30% and only 10% strong). We can notice some variations of head movements, but the difference in head fit strategy between the two sessions wasn’t statistically significant.
VI-
Discussion
The majority of subjects reported a preference for the tracking system (70% at 6m and 90% at 10m). The precision of the alignment between AR and the real world was significantly higher when head-tracked for both distances.
All subjects (100%) highly preferred overall the session with 10m projection distance whether head tracked or not, and all of them agreed that it was much more comfortable visually, even though they were not informed that the changing condition between the two sessions was the depth projection. Many recurring reason have been reported: better convergence, better visual comfort, better depth alignment, eye-comfort. Some of the problems reported for the session “AR-HUD at 6m” as compared to the session AR-HUD at 10m” are: difficulties to merge the stereo-images of augmented 0 2 4 6 8 10 12 6 m 10 m TR A CKIN G P R EF ER EN CE L EV EL
Max Planck Institute for Biological Cybernetics, Tübingen, 16 – 18 Sep 2015
reality beyond a certain distance in the driving scene, visual discomfort related to convergence difficulty, impression of decrease of the augmented reality marking zone, depth alignment trouble and visual impairment, some of the older population reported a double image and an inability to fuse AR images in some cases, the more some subjects looked further in the driving scene the more the convergence problem for AR was pronounced. The other way around, as concerning appreciation reported for the AR-HUD at 10m when compared to the AR-HUD at 6m, verifies even more obtained results. Participants qualify the display with a better virtual image presentation, less flickering related to depth lag (white real marking and red AR marking), better depth marking presentation, better visual comfort especially for further information, and less confusion between the marking when looking further.
Conclusion
The impact of head motion parallax was evaluated in this study subjectively, as well as the influence of the projection distance. Since the daylight condition was privileged during this experimentation, the white line markings were still visible all time. When displaying augmented reality information, it is important to have an acceptable alignment of the augmented reality highlight and the real marking. Otherwise, it creates a confusion and some perception problems discussed in this paper.
Difference in depth projection and parallax inclusion were set and compared in order to evaluate subject’s preferences, precision of the alignment, visual comfort, and driver behavior. Amongst the reported discomfort related to the augmented reality display during the none-ideal experimental conditions: eyestrain, focusing problems, and the alignment of the AR-HUD. Impact of head motion parallax and the depth of the display were both important and their consideration allow to optimize the HUD to better perceive the displayed information.
Some of the important results, include a significant difference of focusing abilities between the two distances of AR-HUD (6m and 10m), the precision of the AR-real alignment when head tracked yielded significant results for both distances, and a very large population had a preference for the head-tracked AR-HUD for the two distances.
References
Aytekin, Murat, and Michele Rucci. "Motion parallax from microscopic head movements during visual fixation."Vision research 70 (2012): 7-17.
Halit, Lynda; Kemeny Andras; Mohellebi, Hakim; Garbaya, Samir; Merienne, Frédéric, Michelin, Sylvain; & Albaut, Valentin. "Augmented Reality Head-Up-Display for
Advanced Driver Assistance System: A Driving Simulation Study". Proceedings of the 5th International
Conference on Applied Human Factors and Ergonomics AHFE 2014, Kraków, Poland 19-23 July 2014.
Kemeny, Andras. "From driving simulation to virtual reality"
In
Proceedings of the 2014 Virtual Reality International Conference, p. 32. ACM, 2014.Land, Michael F., and Benjamin W. Tatler. "Steering with the head: The visual strategy of a racing driver."Current Biology 11, no. 15 (2001): 1215-1220.
Leroy, Laure. "Interfaçage visuel stéréoscopique: diminution de la fatigue visuelle et caractérisation de la perception des formes."PhD diss., École Nationale Supérieure des Mines de Paris, 2009.
Mestre, Daniel; Authié, Colas. “Why do we move our
head during curve driving?”. 4th International Conference on Applied Human Factors and Ergonomics, 21-25 July 2012, San Francisco, USA. Nawrot, Mark. "Depth from motion parallax scales with eye movement gain."Journal of Vision 3, no. 11 (2003):
17.
Ono, Hiroshi, and Hiroyasu Ujike. "Motion parallax driven by head movements: Conditions for visual stability, perceived depth, and perceived concomitant motion."Perception-London 34, no. 4 (2005): 477-490.
Tawari, Ashish, Sujitha Martin, and Mohan Manubhai Trivedi. "Continuous Head Movement Estimator for Driver Assistance: Issues, Algorithms, and On-Road Evaluations."(2014): 1-13
Zikovitz, Daniel; Laurence, Harris. "Head tilt during driving."Ergonomics, 42, no. 5 (1999): 740-746.